PixFRET, an ImageJ plug-in for FRET calculation ... - ResearchGate
PixFRET, an ImageJ plug-in for FRET calculation ... - ResearchGate
PixFRET, an ImageJ plug-in for FRET calculation ... - ResearchGate
- No tags were found...

You also want an ePaper? Increase the reach of your titles
YUMPU automatically turns print PDFs into web optimized ePapers that Google loves.
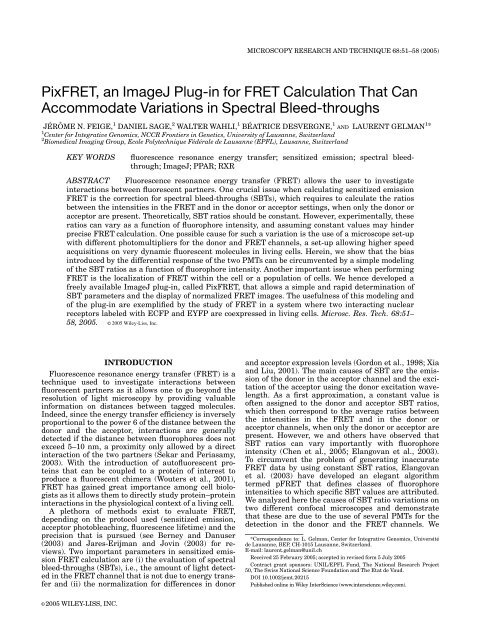
MICROSCOPY RESEARCH AND TECHNIQUE 68:51–58 (2005)<strong>Pix<strong>FRET</strong></strong>, <strong>an</strong> <strong>ImageJ</strong> Plug-<strong>in</strong> <strong>for</strong> <strong>FRET</strong> Calculation That C<strong>an</strong>Accommodate Variations <strong>in</strong> Spectral Bleed-throughsJÉRÔME N. FEIGE, 1 DANIEL SAGE, 2 WALTER WAHLI, 1 BÉATRICE DESVERGNE, 1 AND LAURENT GELMAN 1 *1 Center <strong>for</strong> Integrative Genomics, NCCR Frontiers <strong>in</strong> Genetics, University of Laus<strong>an</strong>ne, Switzerl<strong>an</strong>d2 Biomedical Imag<strong>in</strong>g Group, Ecole Polytechnique Fédérale de Laus<strong>an</strong>ne (EPFL), Laus<strong>an</strong>ne, Switzerl<strong>an</strong>dKEY WORDSfluorescence reson<strong>an</strong>ce energy tr<strong>an</strong>sfer; sensitized emission; spectral bleedthrough;<strong>ImageJ</strong>; PPAR; RXRABSTRACT Fluorescence reson<strong>an</strong>ce energy tr<strong>an</strong>sfer (<strong>FRET</strong>) allows the user to <strong>in</strong>vestigate<strong>in</strong>teractions between fluorescent partners. One crucial issue when calculat<strong>in</strong>g sensitized emission<strong>FRET</strong> is the correction <strong>for</strong> spectral bleed-throughs (SBTs), which requires to calculate the ratiosbetween the <strong>in</strong>tensities <strong>in</strong> the <strong>FRET</strong> <strong>an</strong>d <strong>in</strong> the donor or acceptor sett<strong>in</strong>gs, when only the donor oracceptor are present. Theoretically, SBT ratios should be const<strong>an</strong>t. However, experimentally, theseratios c<strong>an</strong> vary as a function of fluorophore <strong>in</strong>tensity, <strong>an</strong>d assum<strong>in</strong>g const<strong>an</strong>t values may h<strong>in</strong>derprecise <strong>FRET</strong> <strong>calculation</strong>. One possible cause <strong>for</strong> such a variation is the use of a microscope set-upwith different photomultipliers <strong>for</strong> the donor <strong>an</strong>d <strong>FRET</strong> ch<strong>an</strong>nels, a set-up allow<strong>in</strong>g higher speedacquisitions on very dynamic fluorescent molecules <strong>in</strong> liv<strong>in</strong>g cells. Here<strong>in</strong>, we show that the bias<strong>in</strong>troduced by the differential response of the two PMTs c<strong>an</strong> be circumvented by a simple model<strong>in</strong>gof the SBT ratios as a function of fluorophore <strong>in</strong>tensity. Another import<strong>an</strong>t issue when per<strong>for</strong>m<strong>in</strong>g<strong>FRET</strong> is the localization of <strong>FRET</strong> with<strong>in</strong> the cell or a population of cells. We hence developed afreely available <strong>ImageJ</strong> <strong>plug</strong>-<strong>in</strong>, called <strong>Pix<strong>FRET</strong></strong>, that allows a simple <strong>an</strong>d rapid determ<strong>in</strong>ation ofSBT parameters <strong>an</strong>d the display of normalized <strong>FRET</strong> images. The usefulness of this model<strong>in</strong>g <strong>an</strong>dof the <strong>plug</strong>-<strong>in</strong> are exemplified by the study of <strong>FRET</strong> <strong>in</strong> a system where two <strong>in</strong>teract<strong>in</strong>g nuclearreceptors labeled with ECFP <strong>an</strong>d EYFP are coexpressed <strong>in</strong> liv<strong>in</strong>g cells. Microsc. Res. Tech. 68:51–58, 2005. VC 2005 Wiley-Liss, Inc.INTRODUCTIONFluorescence reson<strong>an</strong>ce energy tr<strong>an</strong>sfer (<strong>FRET</strong>) is atechnique used to <strong>in</strong>vestigate <strong>in</strong>teractions betweenfluorescent partners as it allows one to go beyond theresolution of light microscopy by provid<strong>in</strong>g valuable<strong>in</strong><strong>for</strong>mation on dist<strong>an</strong>ces between tagged molecules.Indeed, s<strong>in</strong>ce the energy tr<strong>an</strong>sfer efficiency is <strong>in</strong>verselyproportional to the power 6 of the dist<strong>an</strong>ce between thedonor <strong>an</strong>d the acceptor, <strong>in</strong>teractions are generallydetected if the dist<strong>an</strong>ce between fluorophores does notexceed 5–10 nm, a proximity only allowed by a direct<strong>in</strong>teraction of the two partners (Sekar <strong>an</strong>d Periasamy,2003). With the <strong>in</strong>troduction of autofluorescent prote<strong>in</strong>sthat c<strong>an</strong> be coupled to a prote<strong>in</strong> of <strong>in</strong>terest toproduce a fluorescent chimera (Wouters et al., 2001),<strong>FRET</strong> has ga<strong>in</strong>ed great import<strong>an</strong>ce among cell biologistsas it allows them to directly study prote<strong>in</strong>–prote<strong>in</strong><strong>in</strong>teractions <strong>in</strong> the physiological context of a liv<strong>in</strong>g cell.A plethora of methods exist to evaluate <strong>FRET</strong>,depend<strong>in</strong>g on the protocol used (sensitized emission,acceptor photobleach<strong>in</strong>g, fluorescence lifetime) <strong>an</strong>d theprecision that is pursued (see Berney <strong>an</strong>d D<strong>an</strong>user(2003) <strong>an</strong>d Jares-Erijm<strong>an</strong> <strong>an</strong>d Jov<strong>in</strong> (2003) <strong>for</strong> reviews).Two import<strong>an</strong>t parameters <strong>in</strong> sensitized emission<strong>FRET</strong> <strong>calculation</strong> are (i) the evaluation of spectralbleed-throughs (SBTs), i.e., the amount of light detected<strong>in</strong> the <strong>FRET</strong> ch<strong>an</strong>nel that is not due to energy tr<strong>an</strong>sfer<strong>an</strong>d (ii) the normalization <strong>for</strong> differences <strong>in</strong> donor<strong>an</strong>d acceptor expression levels (Gordon et al., 1998; Xia<strong>an</strong>d Liu, 2001). The ma<strong>in</strong> causes of SBT are the emissionof the donor <strong>in</strong> the acceptor ch<strong>an</strong>nel <strong>an</strong>d the excitationof the acceptor us<strong>in</strong>g the donor excitation wavelength.As a first approximation, a const<strong>an</strong>t value isoften assigned to the donor <strong>an</strong>d acceptor SBT ratios,which then correspond to the average ratios betweenthe <strong>in</strong>tensities <strong>in</strong> the <strong>FRET</strong> <strong>an</strong>d <strong>in</strong> the donor oracceptor ch<strong>an</strong>nels, when only the donor or acceptor arepresent. However, we <strong>an</strong>d others have observed thatSBT ratios c<strong>an</strong> vary import<strong>an</strong>tly with fluorophore<strong>in</strong>tensity (Chen et al., 2005; El<strong>an</strong>gov<strong>an</strong> et al., 2003).To circumvent the problem of generat<strong>in</strong>g <strong>in</strong>accurate<strong>FRET</strong> data by us<strong>in</strong>g const<strong>an</strong>t SBT ratios, El<strong>an</strong>gov<strong>an</strong>et al. (2003) have developed <strong>an</strong> eleg<strong>an</strong>t algorithmtermed p<strong>FRET</strong> that def<strong>in</strong>es classes of fluorophore<strong>in</strong>tensities to which specific SBT values are attributed.We <strong>an</strong>alyzed here the causes of SBT ratio variations ontwo different confocal microscopes <strong>an</strong>d demonstratethat these are due to the use of several PMTs <strong>for</strong> thedetection <strong>in</strong> the donor <strong>an</strong>d the <strong>FRET</strong> ch<strong>an</strong>nels. We*Correspondence to: L. Gelm<strong>an</strong>, Center <strong>for</strong> Integrative Genomics, Universitéde Laus<strong>an</strong>ne, BEP, CH-1015 Laus<strong>an</strong>ne, Switzerl<strong>an</strong>d.E-mail: laurent.gelm<strong>an</strong>@unil.chReceived 25 February 2005; accepted <strong>in</strong> revised <strong>for</strong>m 5 July 2005Contract gr<strong>an</strong>t sponsors: UNIL/EPFL Fund, The National Research Project50, The Swiss National Science Foundation <strong>an</strong>d The Etat de Vaud.DOI 10.1002/jemt.20215Published onl<strong>in</strong>e <strong>in</strong> Wiley InterScience (www.<strong>in</strong>terscience.wiley.com).VC 2005 WILEY-LISS, INC.
52 J.N. FEIGE ET AL.thereafter show that a simple model<strong>in</strong>g to estimatethese SBT ratios as a function of <strong>in</strong>tensity greatlyimproves the accuracy of <strong>FRET</strong> <strong>calculation</strong>.Another import<strong>an</strong>t <strong>in</strong>terest <strong>for</strong> biologists when <strong>an</strong>alyz<strong>in</strong>g<strong>FRET</strong> <strong>in</strong> liv<strong>in</strong>g cells concerns the location of the<strong>in</strong>teraction studied with<strong>in</strong> the cell or the cell population.We report here the development of <strong>an</strong> <strong>ImageJ</strong><strong>plug</strong>-<strong>in</strong>, called ‘‘<strong>Pix<strong>FRET</strong></strong>,’’ which allows one to calculate<strong>an</strong>d display <strong>FRET</strong> directly on images by per<strong>for</strong>m<strong>in</strong>ga pixel-by-pixel <strong>an</strong>alysis of images <strong>an</strong>d assist<strong>in</strong>g <strong>in</strong>the determ<strong>in</strong>ation of SBTs.The usefulness of the model<strong>in</strong>g of SBT ratios <strong>an</strong>d ofthe pix<strong>FRET</strong> <strong>plug</strong>-<strong>in</strong> is exemplified us<strong>in</strong>g the enh<strong>an</strong>cedcy<strong>an</strong> <strong>an</strong>d yellow fluorescent prote<strong>in</strong>s (ECFP <strong>an</strong>dEYFP), the <strong>FRET</strong> pair which is today the most widelyused by biologists to study <strong>in</strong>teractions of prote<strong>in</strong>s <strong>in</strong>liv<strong>in</strong>g cells, fused to each partner of a well-establishedheterodimer: the peroxisome proliferator-activatedreceptor (PPAR) <strong>an</strong>d the ret<strong>in</strong>oid X receptor (RXR)(Feige et al., 2005).MATERIALS AND METHODSPlasmid Constructs <strong>an</strong>d ReagentscDNAs encod<strong>in</strong>g mouse PPARa as well as RXRa weresubcloned after PCR amplification <strong>in</strong>to the pEYFP-N1<strong>an</strong>d pECFP-N1 plasmids (BD Biosciences Clontech,Switzerl<strong>an</strong>d) as described previously (Feige et al., 2005).The ECFP–DEVD–EYFP construct <strong>an</strong>d GI262570-FITCwere k<strong>in</strong>d gifts of Dr. J.M. Tavaré (Rehm et al., 2002)<strong>an</strong>d Dr. Peterson (DeGrazia et al., 2003), respectively.Cell Culture <strong>an</strong>d Tr<strong>an</strong>sient Tr<strong>an</strong>sfection AssaysCos-7 cells were ma<strong>in</strong>ta<strong>in</strong>ed <strong>in</strong> Dulbecco’s modifiedEagle’s medium supplemented with 10% fetal calfserum (Gibco/Invitrogen, Switzerl<strong>an</strong>d). Penicill<strong>in</strong> <strong>an</strong>dstreptomyc<strong>in</strong> (Gibco) were added to the media at 100units/ml <strong>an</strong>d 100 lg/ml, respectively.Tr<strong>an</strong>sient tr<strong>an</strong>sfection assays were per<strong>for</strong>med us<strong>in</strong>gLipofectam<strong>in</strong>e 2000 (Invitrogen, Switzerl<strong>an</strong>d). Cellswere plated <strong>in</strong> 4-well LabTek chambered coverglasses(Nunc) <strong>for</strong> microscopy studies.Confocal Imag<strong>in</strong>gLive cells grown on LabTek chambered coverglasseswere washed once with phenol red free Optimemmedium (Gibco) <strong>an</strong>d observed <strong>in</strong> the same medium.Observations were per<strong>for</strong>med at 378C on a TCS SP2AOBS confocal microscope (Leica, Germ<strong>an</strong>y) equippedwith four photomultipliers (PMTs) <strong>an</strong>d with a wholemicroscope<strong>in</strong>cubator (Life Imag<strong>in</strong>g Service, Switzerl<strong>an</strong>d).Additional experiments were per<strong>for</strong>med on <strong>an</strong>LSM510 Meta confocal microscope, us<strong>in</strong>g the Metaarray of PMTs (Zeiss, Germ<strong>an</strong>y), <strong>an</strong>d on <strong>an</strong> OlympusIX70 wide-field microscope equipped with a PolychromeII monochromator (Photonics, USA) set at420 nm, a Zeiss 488027 filter set (Ex BP 410/16 þ 489/22 – Em BP 456/17 þ 535/44) or <strong>an</strong> Olympus YFP filterset (BP535/30) <strong>an</strong>d <strong>an</strong> Imago charge-coupled device(CCD) camera (Photonics, USA). Acquisitions were per<strong>for</strong>medwith a 63X/NA 1.2 water or a 63X/NA 1.4 oilimmersion objective. Qu<strong>an</strong>tification of images was per<strong>for</strong>medus<strong>in</strong>g either the Leica Confocal Software (LCS)version 2.4 or <strong>ImageJ</strong> version 1.33.For <strong>FRET</strong> experiments, tr<strong>an</strong>sfections were per<strong>for</strong>medas described above <strong>an</strong>d expression levels ofdonor <strong>an</strong>d acceptor prote<strong>in</strong>s were adjusted to similarlevels by Western blot. Unless otherwise stated, thethree different sett<strong>in</strong>gs used <strong>for</strong> the <strong>an</strong>alysis of <strong>FRET</strong>with the CFP/YFP pair were (i) <strong>FRET</strong>: Ex 405 nm/Em525–545 nm, (ii) CFP: Ex 405 nm/Em 465–485 nm, (iii)YFP: Ex 514 nm/Em 525–545 nm. Laser power <strong>an</strong>ddetector ga<strong>in</strong> were adjusted <strong>in</strong> the different ch<strong>an</strong>nels<strong>in</strong> order to observe equimolar concentrations of CFP<strong>an</strong>d YFP at equal <strong>in</strong>tensities (equimolar concentrationsof CFP <strong>an</strong>d YFP were obta<strong>in</strong>ed by express<strong>in</strong>g a referencefusion prote<strong>in</strong> of CFP <strong>an</strong>d YFP spaced by 475 residues).The <strong>an</strong>alysis of <strong>FRET</strong> with the FITC/Cy3 pairwas per<strong>for</strong>med with the follow<strong>in</strong>g sett<strong>in</strong>gs: (i) <strong>FRET</strong>:Ex 488 nm/Em 565–585 nm, (ii) FITC: Ex 488 nm/Em510–530 nm, (iii) Cy3: Ex 514 nm/Em 565–585 nm. Sett<strong>in</strong>gswere kept unch<strong>an</strong>ged <strong>for</strong> <strong>an</strong>alysis of all samples.Unless otherwise stated, donor emission was detectedon the photomultiplier 1 (PMT1) <strong>an</strong>d acceptor <strong>an</strong>d<strong>FRET</strong> emissions were recorded on PMT2. Donor <strong>an</strong>dacceptor SBTs <strong>in</strong> the <strong>FRET</strong> sett<strong>in</strong>g were determ<strong>in</strong>ed oncells express<strong>in</strong>g the donor or the acceptor alone bycalculat<strong>in</strong>g the <strong>in</strong>tensity (I) ratios <strong>in</strong> the appropriatesett<strong>in</strong>gs (I <strong>FRET</strong> /I Donor <strong>an</strong>d I <strong>FRET</strong> /I Acceptor , respectively).L<strong>in</strong>ear <strong>an</strong>d exponential fits were per<strong>for</strong>med us<strong>in</strong>gMicrosoft Excel <strong>an</strong>d F<strong>in</strong>dGraph, respectively. <strong>FRET</strong>measured <strong>in</strong> coexpress<strong>in</strong>g cells was then corrected <strong>for</strong>SBTs <strong>an</strong>d normalized (N<strong>FRET</strong>) <strong>for</strong> expression levelsaccord<strong>in</strong>g to the follow<strong>in</strong>g <strong>for</strong>mula (Xia <strong>an</strong>d Liu, 2001):N<strong>FRET</strong> ¼ I <strong>FRET</strong> I Donor 3 BT Donor I Acceptor 3 BT AcceptorpffiffiffiffiffiffiffiffiffiffiffiffiffiffiffiffiffiffiffiffiffiffiffiffiffiffiffiffiffiffiffiffiffiffiI Donor 3 I AcceptorProgram <strong>for</strong> the Plug-<strong>in</strong>The program <strong>Pix<strong>FRET</strong></strong> presented <strong>in</strong> this paper is a<strong>plug</strong>-<strong>in</strong> of the public-doma<strong>in</strong> software <strong>ImageJ</strong>. <strong>ImageJ</strong>is a general-purpose image-process<strong>in</strong>g program; it isthe Java offspr<strong>in</strong>g of the NIH Image software. As aresult, it c<strong>an</strong> run on <strong>an</strong>y plat<strong>for</strong>m with a Java VirtualMach<strong>in</strong>e (Mac<strong>in</strong>tosh, W<strong>in</strong>dows, Unix, etc.). The application<strong>an</strong>d its source are available at http://rsb.<strong>in</strong>fo.nih.gov/ij/. <strong>Pix<strong>FRET</strong></strong> is freely available at http://www.unil.ch/cig/page16989.html.RESULTSSBT Ratios C<strong>an</strong> Vary as a Functionof Fluorophore IntensityTo study <strong>FRET</strong> <strong>in</strong> liv<strong>in</strong>g cells, we chose two nuclearreceptors previously shown to <strong>for</strong>m heterodimers <strong>in</strong>vitro <strong>an</strong>d <strong>in</strong> vivo, PPAR <strong>an</strong>d RXR that were, respectively,fused to ECFP (donor) <strong>an</strong>d EYFP (acceptor)(Feige et al., 2005).An import<strong>an</strong>t parameter <strong>in</strong> <strong>FRET</strong> experiments is theamount of SBT between ch<strong>an</strong>nels. To estimate SBTs,average fluorescence <strong>in</strong>tensities <strong>in</strong> cells express<strong>in</strong>gonly the donor (or the acceptor) were qu<strong>an</strong>tified, both<strong>in</strong> the <strong>FRET</strong> <strong>an</strong>d <strong>in</strong> the donor (or acceptor) ch<strong>an</strong>nels.The ratios between the fluorescence <strong>in</strong>tensities <strong>in</strong> eachch<strong>an</strong>nel were calculated after background subtraction.In cells express<strong>in</strong>g PPAR-CFP alone, the donor SBTratio, def<strong>in</strong>ed as the ratio between the amount of light
<strong>Pix<strong>FRET</strong></strong>: AN IMAGEJ PLUG-IN FOR PIXEL-BY-PIXEL ANALYSIS OF <strong>FRET</strong>53Fig. 1. The donor bleed-through ratio <strong>in</strong>creases with donor <strong>in</strong>tensity.A: Cos-7 cells were tr<strong>an</strong>sfected with <strong>an</strong> expression vector <strong>for</strong>PPARa-ECFP. Fluorescence <strong>in</strong>tensity <strong>in</strong> the ECFP (Exc. 405 nm/Em.465–485 nm, PMT1) <strong>an</strong>d <strong>FRET</strong> (Exc. 405 nm/Em. 525–545 nm,PMT2) sett<strong>in</strong>gs was measured on at least 300 cells. The SBT ratio isthe ratio between the average <strong>FRET</strong> <strong>an</strong>d ECFP <strong>in</strong>tensities measured<strong>in</strong> <strong>in</strong>dividual cells. F CFP <strong>an</strong>d CFP CFP are the <strong>in</strong>tensities measured <strong>in</strong>the <strong>FRET</strong> <strong>an</strong>d CFP sett<strong>in</strong>gs, respectively, when only CFP is present.B: Liv<strong>in</strong>g Cos-7 cells were <strong>in</strong>cubated with GI262570-FITC. Fluorescence<strong>in</strong>tensity <strong>in</strong> the FITC (Exc. 488 nm/Em. 510–530 nm, PMT1)<strong>an</strong>d <strong>FRET</strong> (Exc. 488 nm/Em. 565–585 nm, PMT2) sett<strong>in</strong>gs was measuredon at least 100 cells. The SBT ratio is the ratio between the average<strong>FRET</strong> <strong>an</strong>d FITC <strong>in</strong>tensities measured <strong>in</strong> <strong>in</strong>dividual cells.emitted by the donor <strong>in</strong> the <strong>FRET</strong> ch<strong>an</strong>nel (F CFP ) <strong>an</strong>d<strong>in</strong> the donor ch<strong>an</strong>nel (CFP CFP ), was not const<strong>an</strong>t <strong>an</strong>d<strong>in</strong>creased with CFP <strong>in</strong>tensity (Fig. 1A). To underst<strong>an</strong>dthe causes of such <strong>an</strong> <strong>in</strong>crease, we tested several possiblefactors. Photobleach<strong>in</strong>g or photoconversion of thefluorophores was not <strong>in</strong>volved as no modification of therelationship between the CFP SBT ratio <strong>an</strong>d CFP<strong>in</strong>tensity was observed after 60 sc<strong>an</strong>s of the specimenor after sc<strong>an</strong>n<strong>in</strong>g with full laser power (data notshown). We then tested whether this phenomenon wasdependent on the type of fluorophore used by test<strong>in</strong>gthe SBT of FITC. Liv<strong>in</strong>g cells were <strong>in</strong>cubated with thePPAR lig<strong>an</strong>d GI262570 coupled to FITC, which accumulates<strong>in</strong> cellular membr<strong>an</strong>es <strong>an</strong>d <strong>in</strong> nuclei. Interest<strong>in</strong>gly,when GI262570-FITC was used as a <strong>FRET</strong> donorwith Cy3, the donor SBT ratio also varied with FITC<strong>in</strong>tensity (Fig. 1B).To determ<strong>in</strong>e if the fluctuations of SBTs were due toour <strong>in</strong>strumentation (Leica TCS SP2 AOBS), we per<strong>for</strong>medthe same experiment with different microscopes.When PPAR-CFP SBT was <strong>an</strong>alyzed on a ZeissLSM510 Meta confocal microscope, us<strong>in</strong>g the Metaarray of PMTs, a very similar <strong>in</strong>crease was observedwhen the SBT ratio was plotted as a function of fluorophore<strong>in</strong>tensity. However, this donor SBT ratio wasconst<strong>an</strong>t on a wide-field microscope us<strong>in</strong>g a CCD camera(data not shown). It there<strong>for</strong>e appeared that thedependency of the SBT ratio on fluorophore <strong>in</strong>tensitywas restricted to confocal microscopes. To further identifythe possible causes lead<strong>in</strong>g to this variation, wetested the impact of laser power <strong>an</strong>d PMT ga<strong>in</strong> on SBTratio variations. Variations of CFP SBT ratios were stillobserved when the laser was tuned from 15% to 75% ofits maximum power (data not shown). We then <strong>an</strong>alyzedSBT ratios with four different sett<strong>in</strong>gs where thega<strong>in</strong>s of the PMTs used <strong>for</strong> the detection <strong>in</strong> the donor<strong>an</strong>d <strong>FRET</strong> ch<strong>an</strong>nels were set to different voltages.Laser power was adjusted to allow the <strong>an</strong>alysis of thesame batch of cells with each sett<strong>in</strong>g (Fig. 2A). Interest<strong>in</strong>gly,although the CFP SBT ratio was <strong>in</strong>dependentFig. 2. Influence of PMT ga<strong>in</strong> on the relationship between ECFPSBT ratio <strong>an</strong>d ECFP <strong>in</strong>tensity. Cos-7 cells were tr<strong>an</strong>sfected with <strong>an</strong>expression vector <strong>for</strong> PPARa-ECFP. Fluorescence <strong>in</strong>tensity <strong>in</strong> theECFP <strong>an</strong>d <strong>FRET</strong> sett<strong>in</strong>gs was measured on at least 100 cells per condition.The percentage of SBT is the ratio between the average <strong>FRET</strong><strong>an</strong>d ECFP <strong>in</strong>tensities measured <strong>in</strong> <strong>in</strong>dividual cells. A: The ga<strong>in</strong> <strong>an</strong>dlaser power were set as <strong>in</strong>dicated us<strong>in</strong>g PMT1 <strong>an</strong>d PMT2 <strong>for</strong> ECFP(465–485 nm) <strong>an</strong>d <strong>FRET</strong> (525–545 nm) detection, respectively. B: Thega<strong>in</strong> <strong>an</strong>d laser power were set as <strong>in</strong>dicated us<strong>in</strong>g PMT2 both <strong>for</strong> ECFP<strong>an</strong>d <strong>FRET</strong> detection.of CFP <strong>in</strong>tensity at low PMT ga<strong>in</strong>s (500 V donor/530V<strong>FRET</strong>), this ratio <strong>in</strong>creased with CFP <strong>in</strong>tensity athigher ga<strong>in</strong>s. Similar results were obta<strong>in</strong>ed when onlythe donor or the <strong>FRET</strong> ga<strong>in</strong> were ch<strong>an</strong>ged, or whenboth ga<strong>in</strong>s were ch<strong>an</strong>ged <strong>an</strong>d laser power was kept const<strong>an</strong>t(data not shown).These results suggested that problems <strong>in</strong> PMT l<strong>in</strong>earitycould account <strong>for</strong> the observed dependency ofSBT ratios on fluorophore <strong>in</strong>tensity. While it is moreconvenient to use two different PMTs <strong>for</strong> the detection<strong>in</strong> the donor <strong>an</strong>d <strong>FRET</strong> ch<strong>an</strong>nels, we <strong>in</strong>vestigatedwhether the phenomenon could also be observed withone PMT only. When the same PMT was used <strong>for</strong> boththe donor <strong>an</strong>d <strong>FRET</strong> ch<strong>an</strong>nels, the SBT ratio was con-
54 J.N. FEIGE ET AL.Fig. 3. The ECFP SBT ratio c<strong>an</strong> be fitted as a function of ECFP<strong>in</strong>tensity. The data from Figure 1 were fitted with a l<strong>in</strong>ear (A) or <strong>an</strong>exponential (B) model.st<strong>an</strong>t, irrespective of the ga<strong>in</strong> applied to the PMT(Fig. 2B). This result suggests that the variations observedwith the set-up with two PMTs, or with the arrayof PMTs, reflect a differential response of the PMTs.Improv<strong>in</strong>g <strong>FRET</strong> Calculation by Model<strong>in</strong>g SBTRatios as a Function of Fluorophore IntensityTo circumvent the problem of SBT variation, us<strong>in</strong>g aunique PMT both <strong>for</strong> the detection of the donor <strong>an</strong>d ofthe acceptor seems there<strong>for</strong>e to be the best solution.However, this imposes to acquire the three ch<strong>an</strong>nelssequentially because of mech<strong>an</strong>ical movement of thePMT, a time-consum<strong>in</strong>g process that is not compatiblewith the <strong>FRET</strong> <strong>an</strong>alysis of rapidly diffus<strong>in</strong>g complexes.El<strong>an</strong>gov<strong>an</strong> et al. (2003) have already reported thevariation of SBT ratios as a function of fluorophore<strong>in</strong>tensity <strong>an</strong>d proposed <strong>an</strong> eleg<strong>an</strong>t but only commerciallyavailable algorithm to tackle this problem. Alternately,we propose <strong>an</strong> easily applicable method thatconsists <strong>in</strong> model<strong>in</strong>g SBT ratios as a function of fluorophore<strong>in</strong>tensity. For the problem reported here<strong>in</strong>, theCFP SBT ratio c<strong>an</strong> be fitted as a function of CFP <strong>in</strong>tensityeither with a l<strong>in</strong>ear or <strong>an</strong> exponential model(Fig. 3). These models are then used to estimate theSBT ratio correspond<strong>in</strong>g to each donor <strong>in</strong>tensity <strong>an</strong>dc<strong>an</strong> be implemented <strong>in</strong> the N<strong>FRET</strong> <strong>for</strong>mula describedby Xia <strong>an</strong>d Liu (2001) as follows:where F, CFP, <strong>an</strong>d YFP are the <strong>in</strong>tensities measuredwith the <strong>FRET</strong>, CFP, <strong>an</strong>d YFP sett<strong>in</strong>gs (correspond toF, D, <strong>an</strong>d A <strong>in</strong> the nomenclature proposed by Gordonet al. (1998)), a <strong>an</strong>d b are the average donor <strong>an</strong>dacceptor SBT ratios, <strong>an</strong>d c, d, e, f, <strong>an</strong>d g are the const<strong>an</strong>tsdeterm<strong>in</strong>ed by the fitt<strong>in</strong>g of the SBT ratio,accord<strong>in</strong>g to Figure 3.To validate this approach, the three <strong>FRET</strong> <strong>calculation</strong>methods have then been compared with the sameset of data (Fig. 4). Cells were tr<strong>an</strong>sfected with expressionvectors <strong>for</strong> ECFP <strong>an</strong>d EYFP (negative control),ECFP fused to EYFP (positive control), or PPAR-ECFP<strong>an</strong>d RXR-EYFP. The three <strong>for</strong>mulas give similar results<strong>for</strong> both the positive <strong>an</strong>d negative <strong>FRET</strong> controls as,under these experimental conditions, variations betweencells are small <strong>an</strong>d all fluorescence <strong>in</strong>tensities are close tothe average of the population used to calculate SBT ratios(Fig. 4A). The l<strong>in</strong>N<strong>FRET</strong> values are slightly higherbecause of the underestimation of the ECFP SBT <strong>for</strong> bothlow <strong>an</strong>d high ECFP <strong>in</strong>tensities (see Fig. 3A). The mostdramatic effect is seen when N<strong>FRET</strong> is calculated <strong>for</strong> the<strong>in</strong>teraction between the two nuclear receptors. Indeed,the more accurate l<strong>in</strong>N<strong>FRET</strong> <strong>an</strong>d expN<strong>FRET</strong> <strong>calculation</strong>ssignific<strong>an</strong>tly reduce st<strong>an</strong>dard deviation, with amore pronounced effect <strong>for</strong> expN<strong>FRET</strong>. To better characterizethe reduction of the variability of the measurementswhen model<strong>in</strong>g SBT ratios, we plotted the differencebetween expN<strong>FRET</strong> or l<strong>in</strong>N<strong>FRET</strong> <strong>an</strong>d N<strong>FRET</strong> as afunction of fluorophore <strong>in</strong>tensity (Fig. 4B). In both cases,the highest variation was observed <strong>for</strong> extreme ECFPvalues <strong>for</strong> which us<strong>in</strong>g <strong>an</strong> average SBT ratio leads to agreat under- or overestimation of the correction factor(Figs. 4B <strong>an</strong>d 4C). The results obta<strong>in</strong>ed with l<strong>in</strong>N<strong>FRET</strong><strong>an</strong>d expN<strong>FRET</strong> are hence not only more precise, but alsoimprove the statistical properties of the data, allow<strong>in</strong>gthe user to compare more accurately mild ch<strong>an</strong>ges. Wealso tried to fit the donor SBT with a second order polynomialmodel rather th<strong>an</strong> <strong>an</strong> exponential growth, but thismodel greatly overestimates SBT values when donor<strong>in</strong>tensities are very low or very high (data not shown).Pixel-by-Pixel <strong>FRET</strong> Analysis <strong>an</strong>d VisualizationCells are highly org<strong>an</strong>ized <strong>an</strong>d prote<strong>in</strong> distributionas well as <strong>in</strong>teractions are often limited to specific compartments.It is hence crucial <strong>for</strong> biologists to be able tomap <strong>in</strong>teractions with precision with<strong>in</strong> a cell or a populationof cells to better underst<strong>an</strong>d the spatial org<strong>an</strong>izationof cellular activities. We there<strong>for</strong>e developed <strong>an</strong><strong>ImageJ</strong> <strong>plug</strong>-<strong>in</strong> called ‘‘<strong>Pix<strong>FRET</strong></strong>’’ that allows one togenerate normalized <strong>FRET</strong> images, by comput<strong>in</strong>g pixelN<strong>FRET</strong> ¼ F CFPþYFP CFP CFPþYFP 3 a YFP CFPþYFP 3 bpffiffiffiffiffiffiffiffiffiffiffiffiffiffiffiffiffiffiffiffiffiffiffiffiffiffiffiffiffiffiffiffiffiffiffiffiffiffiffiffiffiffiffiffiffiffiffiffiffiffiffiffiffiffiffiffiffiffiffiffiCFP CFPþYFP 3 YFP CFPþYFPð1Þl<strong>in</strong>N<strong>FRET</strong> ¼ F CFPþYFP CFP CFPþYFP 3 ðc CFP 3 CFP CFPþYFP þ d CFP Þ YFP CFPþYFP 3 bpffiffiffiffiffiffiffiffiffiffiffiffiffiffiffiffiffiffiffiffiffiffiffiffiffiffiffiffiffiffiffiffiffiffiffiffiffiffiffiffiffiffiffiffiffiffiffiffiffiffiffiffiffiffiffiffiffiffiffiffiCFP CFPþYFP 3 YFP CFPþYFPð2ÞexpN<strong>FRET</strong> ¼ F CFPþYFP CFP CFPþYFP 3 ðe CFP 3 expðCFP CFPþYFP 3 f CFP Þ þ g CFP Þ YFP CFPþYFP 3 bpffiffiffiffiffiffiffiffiffiffiffiffiffiffiffiffiffiffiffiffiffiffiffiffiffiffiffiffiffiffiffiffiffiffiffiffiffiffiffiffiffiffiffiffiffiffiffiffiffiffiffiffiffiffiffiffiffiffiffiffiCFP CFPþYFP 3 YFP CFPþYFPð3Þ
<strong>Pix<strong>FRET</strong></strong>: AN IMAGEJ PLUG-IN FOR PIXEL-BY-PIXEL ANALYSIS OF <strong>FRET</strong>Fig. 4. l<strong>in</strong>N<strong>FRET</strong> <strong>an</strong>d expN<strong>FRET</strong> reduce N<strong>FRET</strong> variability. Cos-7 cells were tr<strong>an</strong>sfected with expression vectors <strong>for</strong> ECFP <strong>an</strong>d EYFP,ECFP fused to EYFP, or PPARa-ECFP <strong>an</strong>d RXRa-EYFP. Fluorescence<strong>in</strong>tensity <strong>in</strong> the ECFP, EYFP, <strong>an</strong>d <strong>FRET</strong> sett<strong>in</strong>gs was measured on atleast 50 cells. A: <strong>FRET</strong> was calculated accord<strong>in</strong>g to the three <strong>for</strong>mulasdescribed <strong>in</strong> the text. B: The difference between l<strong>in</strong>N<strong>FRET</strong> orexpN<strong>FRET</strong> <strong>an</strong>d N<strong>FRET</strong> calculated <strong>for</strong> the PPAR/RXR pair was plottedas a function of ECFP <strong>in</strong>tensity. C: The percentage error betweenN<strong>FRET</strong> <strong>an</strong>d l<strong>in</strong>N<strong>FRET</strong> or expN<strong>FRET</strong> calculated <strong>for</strong> the PPAR/RXRpair was plotted as a function of ECFP <strong>in</strong>tensity.by pixel the images of a sample acquired <strong>in</strong> a threech<strong>an</strong>nelsett<strong>in</strong>g. The <strong>plug</strong>-<strong>in</strong> allows one to either enterm<strong>an</strong>ually SBT parameters <strong>for</strong> the donor <strong>an</strong>d theacceptor, or determ<strong>in</strong>e these values onl<strong>in</strong>e us<strong>in</strong>g stacksof <strong>FRET</strong> <strong>an</strong>d donor or acceptor images. <strong>Pix<strong>FRET</strong></strong> isfreely available on our website (http://www.unil.ch/cig/page16989.html) together with a detailed user’s guide.The <strong>Pix<strong>FRET</strong></strong> <strong>plug</strong>-<strong>in</strong> requires different stacks ofimages: (i) <strong>for</strong> <strong>FRET</strong> <strong>an</strong>alysis, a stack of three imagestaken <strong>in</strong> the <strong>FRET</strong>, Donor, <strong>an</strong>d Acceptor sett<strong>in</strong>gs, (ii)<strong>for</strong> Donor SBT determ<strong>in</strong>ation, a stack of two images ofcells express<strong>in</strong>g the Donor only <strong>an</strong>d taken <strong>in</strong> the <strong>FRET</strong><strong>an</strong>d Donor sett<strong>in</strong>gs, (iii) <strong>for</strong> Acceptor SBT determ<strong>in</strong>ation,a stack of two images of cells express<strong>in</strong>gthe Acceptor only <strong>an</strong>d taken <strong>in</strong> the <strong>FRET</strong> <strong>an</strong>d Acceptorsett<strong>in</strong>gs.When launch<strong>in</strong>g <strong>Pix<strong>FRET</strong></strong>, <strong>an</strong> <strong>in</strong>terface appearswhere all parameters <strong>for</strong> <strong>FRET</strong> <strong>calculation</strong> <strong>an</strong>d displayc<strong>an</strong> be set (Fig. 5). The ‘‘Donor SBT’’ or‘‘Acceptor SBT’’ tabs allow one to evaluate SBTparameters (Fig. 5A). The user is first <strong>in</strong>vited todraw a region outside cells to determ<strong>in</strong>e the background<strong>in</strong> each image of the stack. Then, one or severalregions of <strong>in</strong>terest on the cells have to be drawnto allow <strong>Pix<strong>FRET</strong></strong> to plot SBT ratios as a function offluorophore <strong>in</strong>tensity. <strong>Pix<strong>FRET</strong></strong> then calculates theme<strong>an</strong> SBT, or the parameters correspond<strong>in</strong>g to thel<strong>in</strong>ear or exponential fit of the data. The user c<strong>an</strong>drag a slid<strong>in</strong>g w<strong>in</strong>dow on the plot to def<strong>in</strong>e on whichset of po<strong>in</strong>ts the <strong>calculation</strong> is to be per<strong>for</strong>med <strong>an</strong>dmay then rescale the graph to the selected area byclick<strong>in</strong>g the ‘‘Zoom’’ button. It is also noteworthy thatall parameters, <strong>in</strong>clud<strong>in</strong>g background (BG) values,c<strong>an</strong> be directly entered m<strong>an</strong>ually by the user. Next,the stack with cells express<strong>in</strong>g both the donor <strong>an</strong>dthe acceptor should be opened <strong>an</strong>d backgroundshould be determ<strong>in</strong>ed <strong>in</strong> the <strong>FRET</strong> tab (Fig. 5B) bydraw<strong>in</strong>g a region outside cells. Backgrounds may alsobe modified m<strong>an</strong>ually to adjust the threshold abovewhich N<strong>FRET</strong> is calculated. Indeed, the softwareoperates N<strong>FRET</strong> <strong>calculation</strong> only when (i) the localme<strong>an</strong> pixel value, which is calculated by averag<strong>in</strong>gthe values of the pixel of <strong>in</strong>terest <strong>an</strong>d that of its eightsurround<strong>in</strong>g neighbors, is above the me<strong>an</strong> backgroundof the image <strong>in</strong> all three images, <strong>an</strong>d (ii)when the product of the me<strong>an</strong> pixel values <strong>for</strong> donor<strong>an</strong>d acceptor is above the product of the backgrounds<strong>in</strong> the donor <strong>an</strong>d acceptor images. These conditionswere <strong>in</strong>troduced to discard po<strong>in</strong>ts <strong>in</strong> the backgroundthat preclude the visualization of <strong>FRET</strong> with<strong>in</strong> thecell by generat<strong>in</strong>g aberr<strong>an</strong>tly high <strong>FRET</strong> valuesbecause of normalization. All background values mayalso be ch<strong>an</strong>ged by a common multiplication factorwhich c<strong>an</strong> be specified <strong>in</strong> the ‘‘Threshold CorrectionFactor’’ field. The program also offers the option tofilter the images with a Gaussi<strong>an</strong> blur, the st<strong>an</strong>darddeviation of the blur allow<strong>in</strong>g the user to tune thesmooth<strong>in</strong>g effect. Blurr<strong>in</strong>g notably reduces the noise<strong>an</strong>d improves the result<strong>in</strong>g image by prevent<strong>in</strong>gaberr<strong>an</strong>t <strong>FRET</strong> values <strong>in</strong> the background. F<strong>in</strong>ally,the normalization method has to be selected. Indeed,the <strong>FRET</strong> values <strong>for</strong> each pixel c<strong>an</strong> be divided by thevalue <strong>in</strong> the same pixel of the donor <strong>in</strong>tensity, theacceptor <strong>in</strong>tensity, the product of donor <strong>an</strong>d acceptor<strong>in</strong>tensities, or the square root of the product of donor<strong>an</strong>d acceptor <strong>in</strong>tensities. Click<strong>in</strong>g on the ‘‘Compute<strong>FRET</strong>’’ button will generate the normalized <strong>FRET</strong>images, but also will log all parameters to a textfile which will be reloaded when the <strong>plug</strong>-<strong>in</strong> isrelaunched.<strong>FRET</strong> <strong>an</strong>d N<strong>FRET</strong> are calculated only if pixel values<strong>in</strong> each image are above a given threshold. Otherwisethe value is set to zero <strong>in</strong> the computed image<strong>an</strong>d the pixel is displayed <strong>in</strong> blue <strong>in</strong> order to bettervisualize all the <strong>FRET</strong> values of the image (Fig. 6B).Indeed, even if with<strong>in</strong> a cell the average <strong>FRET</strong> valueis positive, some pixels may have negative values,especially when the <strong>FRET</strong> efficiency is low. S<strong>in</strong>ce theoutput image is displayed with a 256 grayscale lookuptable, the background, which corresponds to avalue of zero, may appear <strong>in</strong> gray (<strong>an</strong>d not black as<strong>in</strong>tuitively expected) if negative pixels are present <strong>in</strong>the image, thereby preclud<strong>in</strong>g a good visual exam<strong>in</strong>a-55
56 J.N. FEIGE ET AL.Fig. 5. pix<strong>FRET</strong> <strong>plug</strong>-<strong>in</strong> <strong>in</strong>terfaces. A: SBT determ<strong>in</strong>ation <strong>in</strong>terface. B: <strong>FRET</strong> <strong>in</strong>terface. [Color figurec<strong>an</strong> be viewed <strong>in</strong> the onl<strong>in</strong>e issue, which is available at www.<strong>in</strong>terscience.wiley.com.]tion of the generated <strong>FRET</strong> image. The backgroundpixels are hence automatically colorized <strong>in</strong> blue us<strong>in</strong>ga look-up table designed <strong>for</strong> this purpose.Test of the <strong>Pix<strong>FRET</strong></strong> Plug-<strong>in</strong>To validate the tools described above, we per<strong>for</strong>med apixel-by-pixel <strong>an</strong>alysis of <strong>FRET</strong> by comput<strong>in</strong>g <strong>an</strong> imageof two cells express<strong>in</strong>g different amounts of PPAR-ECFP <strong>an</strong>d RXR-EYFP (Fig. 6) <strong>an</strong>d compared theimpact of us<strong>in</strong>g const<strong>an</strong>t or fitted SBT ratios on <strong>FRET</strong>display. S<strong>in</strong>ce these cells express the same ECFP <strong>an</strong>dEYFP fusion prote<strong>in</strong>s, both of them should exhibit similarnormalized <strong>FRET</strong> values. When const<strong>an</strong>t SBTratios are used, <strong>FRET</strong> efficiency appears higher <strong>in</strong> cell2 th<strong>an</strong> cell 1 (Figs. 6B <strong>an</strong>d 6C, left p<strong>an</strong>els), whereas theuse of the expN<strong>FRET</strong> <strong>for</strong>mula generated <strong>an</strong> imagewhere the two cells display similar <strong>in</strong>tensities (Figs. 6B<strong>an</strong>d 6C, right p<strong>an</strong>els). This visual appreciation of theadv<strong>an</strong>tage of us<strong>in</strong>g expN<strong>FRET</strong> was confirmed whenthe distributions of pixel <strong>in</strong>tensities with<strong>in</strong> each cellwere plotted as histograms <strong>an</strong>d average <strong>FRET</strong> valuescalculated (Fig. 6D). When const<strong>an</strong>t SBT ratios wereused, the average normalized <strong>FRET</strong> value <strong>in</strong> cell 1 was4.9, versus 13.8 <strong>in</strong> cell 2, whereas the use of expN<strong>FRET</strong>generated closer me<strong>an</strong> values (9.6 <strong>for</strong> cell 1 versus 7.4<strong>for</strong> cell 2). Indeed, when us<strong>in</strong>g <strong>an</strong> average SBT ratio <strong>for</strong>normalized <strong>FRET</strong> <strong>calculation</strong> (see <strong>for</strong>mula (1)), mostdonor SBT values are underestimated <strong>in</strong> cell 2, whereCFP levels are high, <strong>an</strong>d overestimated <strong>in</strong> cell 1 whereCFP levels are low. This is why overall <strong>an</strong>d consistentwith what was observed at the cell population level <strong>in</strong>Figure 4, the use of the exponential fit allows a betternormalization of the data by reduc<strong>in</strong>g the variability of<strong>FRET</strong> signals generated from different r<strong>an</strong>ges of fluorophore<strong>in</strong>tensity.DISCUSSION<strong>FRET</strong> is a technique whose use is rapidly exp<strong>an</strong>d<strong>in</strong>gamong cell biologists as it provides very valuable<strong>in</strong><strong>for</strong>mation about physical <strong>in</strong>teractions between moleculeswith<strong>in</strong> cells. Numerous procedures exist <strong>an</strong>dhave been used to determ<strong>in</strong>e <strong>FRET</strong> <strong>in</strong> liv<strong>in</strong>g cells,each of them hav<strong>in</strong>g adv<strong>an</strong>tages <strong>an</strong>d drawbacks (Berney<strong>an</strong>d D<strong>an</strong>user, 2003), <strong>an</strong>d we are still <strong>in</strong> a phasewhere the robustness of the methods has to beimproved (v<strong>an</strong> Rheenen et al., 2004). One import<strong>an</strong>tissue that has received only limited attention so faris the variation of SBT ratios as a function of fluorophore<strong>in</strong>tensity when per<strong>for</strong>m<strong>in</strong>g sensitized emission<strong>FRET</strong>. Us<strong>in</strong>g the most widely used fluorophore pair<strong>in</strong> cell biology, i.e. ECFP <strong>an</strong>d EYFP, we show thatunder some common technical circumst<strong>an</strong>ces, theseratios are not const<strong>an</strong>t <strong>an</strong>d c<strong>an</strong> vary with fluorophoreconcentration. In cases where the variations of fluorophoreconcentrations are small, assum<strong>in</strong>g const<strong>an</strong>tSBT ratios may be sufficient to get data of satisfactoryaccuracy. However, when these SBT ratios varyimport<strong>an</strong>tly <strong>an</strong>d thereby clearly bias <strong>FRET</strong> <strong>calculation</strong>,<strong>an</strong>d when only small variations <strong>in</strong> <strong>FRET</strong> efficiencyare expected between cells or samples, solutionsto tackle this problem are required.Variations <strong>in</strong> SBT ratios as a function of fluorophore<strong>in</strong>tensity could be assigned here to a differentialresponse of the PMTs used <strong>for</strong> detection <strong>in</strong> theDonor <strong>an</strong>d <strong>FRET</strong> ch<strong>an</strong>nels. Although us<strong>in</strong>g a uniquePMT both <strong>for</strong> the detection of the donor <strong>an</strong>d of the
<strong>Pix<strong>FRET</strong></strong>: AN IMAGEJ PLUG-IN FOR PIXEL-BY-PIXEL ANALYSIS OF <strong>FRET</strong>Fig. 6. expN<strong>FRET</strong> reduces <strong>in</strong>tercellular variability <strong>in</strong> pixel-bypixel<strong>an</strong>alyses. Cos-7 cells were tr<strong>an</strong>sfected with expression vectors<strong>for</strong> PPARa-ECFP <strong>an</strong>d RXRa-EYFP. A: Images of two cells express<strong>in</strong>gboth PPAR-ECFP <strong>an</strong>d RXR-EYFP <strong>in</strong> the CFP <strong>an</strong>d YFP sett<strong>in</strong>g. AGaussi<strong>an</strong> blur of 1 was applied to the orig<strong>in</strong>al image. B: N<strong>FRET</strong> <strong>an</strong>dexpN<strong>FRET</strong> images generated by the <strong>Pix<strong>FRET</strong></strong> <strong>plug</strong>-<strong>in</strong>. C: Same as (B)but the cells are pseudocolorized with a different look-up table to bettervisualize <strong>in</strong>tensity differences. D: Distribution of pixel <strong>in</strong>tensitieswith<strong>in</strong> the two cells when the N<strong>FRET</strong> or expN<strong>FRET</strong> methods areused. The red bar <strong>an</strong>d the number <strong>in</strong>dicate the me<strong>an</strong> <strong>in</strong>tensity overthe entire cell.acceptor could circumvent this problem, the requiredmech<strong>an</strong>ical movement of the PMT (or of the filtercube wheel <strong>in</strong> other set-ups) implies that the images<strong>in</strong> the <strong>FRET</strong>, the donor, <strong>an</strong>d the acceptor ch<strong>an</strong>nelsare acquired sequentially. While this approach iswell applicable to fixed samples or to slowly diffus<strong>in</strong>gor immobile prote<strong>in</strong>s, it is more problematic <strong>for</strong>the study of <strong>in</strong>teractions of highly mobile prote<strong>in</strong>ssuch as PPARs (Feige et al., 2005). Sc<strong>an</strong>n<strong>in</strong>g eachch<strong>an</strong>nel between l<strong>in</strong>es, which c<strong>an</strong> only be per<strong>for</strong>medwith two separate PMTs, there<strong>for</strong>e, limits the diffusionof the <strong>in</strong>teract<strong>in</strong>g complexes dur<strong>in</strong>g the time ofsc<strong>an</strong>n<strong>in</strong>g. It is noteworthy that on a different microscope,us<strong>in</strong>g <strong>an</strong> array of PMTs, the same problemwas encountered. Hence, our results are of general<strong>in</strong>terest to scientists per<strong>for</strong>m<strong>in</strong>g <strong>FRET</strong> on a confocalmicroscope. Interest<strong>in</strong>gly, Chen et al. (<strong>in</strong> press) havealso observed variations <strong>in</strong> SBT ratios when per<strong>for</strong>m<strong>in</strong>g<strong>FRET</strong> with a 2-photon excitation set-up, <strong>an</strong>dconsistent with our study, they did not observe <strong>an</strong>yvariation of the SBT ratios on a wide-field microscope,us<strong>in</strong>g a CCD camera detection.In cases where SBT ratios vary as a function of fluorescence<strong>in</strong>tensity, we showed that <strong>FRET</strong> <strong>calculation</strong>c<strong>an</strong> be improved by model<strong>in</strong>g these variations. This isparticularly import<strong>an</strong>t when fluorophore <strong>in</strong>tensitiesvary greatly between cells. We demonstrated here thatthe expN<strong>FRET</strong> method reduces the variability of the<strong>FRET</strong> values calculated <strong>for</strong> the PPAR/RXR <strong>in</strong>teraction.Although <strong>in</strong> our case, the exponential model<strong>in</strong>g generatedthe best results, other fits might be tested <strong>in</strong> situationswhere SBT ratios vary differently.Cells are highly org<strong>an</strong>ized <strong>an</strong>d prote<strong>in</strong> distributionas well as <strong>in</strong>teractions are often limited to specificcompartments. It is hence of import<strong>an</strong>ce to be able tomap <strong>FRET</strong> precisely with<strong>in</strong> cells to better characterizethe mode of action of <strong>in</strong>teract<strong>in</strong>g prote<strong>in</strong>s. Toachieve this goal, we developed a <strong>plug</strong>-<strong>in</strong> called Pix-<strong>FRET</strong> <strong>for</strong> the <strong>ImageJ</strong> software that generates <strong>an</strong>image where N<strong>FRET</strong> is calculated <strong>for</strong> each pixel. The<strong>plug</strong>-<strong>in</strong> allows one to directly determ<strong>in</strong>e the SBTparameters from images acquired when only thedonor or the acceptor are present. As various normalizationmethods have been proposed (Gordon et al.,1998; Xia <strong>an</strong>d Liu, 2001), <strong>Pix<strong>FRET</strong></strong> allows the user tochoose the type of normalization desired. To ourknowledge, this is the first freely available programthat offers such possibilities <strong>an</strong>d the source files willbe available upon request, allow<strong>in</strong>g users to programspecific SBT ratio model<strong>in</strong>g methods accord<strong>in</strong>g totheir needs.In conclusion, we uncovered the bias that the useof several PMTs may <strong>in</strong>troduce when per<strong>for</strong>m<strong>in</strong>g<strong>FRET</strong> experiments. We show that <strong>in</strong> cases where aset-up with two PMTs or <strong>an</strong> array of PMTs is preferredor required, this bias c<strong>an</strong> be circumvented by asimple model<strong>in</strong>g of SBT ratios. We also developed auser-friendly <strong>an</strong>d free <strong>in</strong>terface, called <strong>Pix<strong>FRET</strong></strong>, thatallows a simple <strong>an</strong>d rapid determ<strong>in</strong>ation of SBTparameters <strong>an</strong>d to display normalized <strong>FRET</strong> images.Altogether, these results <strong>an</strong>d the <strong>Pix<strong>FRET</strong></strong> <strong>plug</strong>-<strong>in</strong>will help cell biologists to <strong>in</strong>crease the precision of<strong>FRET</strong> <strong>an</strong>alyses conducted on confocal microscopes aswell as the visualization <strong>an</strong>d localization of <strong>in</strong>teractions<strong>in</strong> liv<strong>in</strong>g cells.ACKNOWLEDGMENTSWe th<strong>an</strong>k Dr. Claude Berney <strong>for</strong> valuable discussions<strong>an</strong>d <strong>for</strong> the read<strong>in</strong>g of the m<strong>an</strong>uscript, Dr. NathalieGar<strong>in</strong> <strong>for</strong> access to the ISREC imag<strong>in</strong>g plat<strong>for</strong>m, Drs.Peterson <strong>an</strong>d DeGrazia <strong>for</strong> the gift of the GI-FITClig<strong>an</strong>d, <strong>an</strong>d Dr. Tavaré <strong>for</strong> the gift of the EYFP–ECFPconstruct.REFERENCESBerney C, D<strong>an</strong>user G. 2003. <strong>FRET</strong> or no <strong>FRET</strong>: a qu<strong>an</strong>titative comparison.Biophys J 84:3992–4010.Chen Y, El<strong>an</strong>gov<strong>an</strong> M, Periasamy A. 2005. <strong>FRET</strong> data <strong>an</strong>alysis: thealgorithm. In: Periasamy A, Day RN, editors. Molecular imag<strong>in</strong>g:<strong>FRET</strong> microscopy <strong>an</strong>d spectroscopy. Ox<strong>for</strong>d: Ox<strong>for</strong>d UniversityPress (<strong>in</strong> press).DeGrazia MJ, Thompson J, Heuvel JP, Peterson BR. 2003. Synthesisof a high-aff<strong>in</strong>ity fluorescent PPARgamma lig<strong>an</strong>d <strong>for</strong> highthroughputfluorescence polarization assays. Bioorg Med Chem 11:4325–4332.El<strong>an</strong>gov<strong>an</strong> M, Wallrabe H, Chen Y, Day RN, Barroso M,Periasamy A. 2003. Characterization of one- <strong>an</strong>d two-photon excitationfluorescence reson<strong>an</strong>ce energy tr<strong>an</strong>sfer microscopy. Methods29: 58–73.57
58 J.N. FEIGE ET AL.Feige JN, Gelm<strong>an</strong> L, Tudor C, Engelborghs Y, Wahli W, DesvergneB. 2005. Fluorescence imag<strong>in</strong>g reveals the nuclear behavior ofPPAR/RXR heterodimers <strong>in</strong> the absence <strong>an</strong>d presence of lig<strong>an</strong>d. JBiol Chem 280:17880–17890.Gordon GW, Berry G, Li<strong>an</strong>g XH, Lev<strong>in</strong>e B, Herm<strong>an</strong> B. 1998. Qu<strong>an</strong>titativefluorescence reson<strong>an</strong>ce energy tr<strong>an</strong>sfer measurementsus<strong>in</strong>g fluorescence microscopy. Biophys J 74:2702–2713.Jares-Erijm<strong>an</strong> EA, Jov<strong>in</strong> TM. 2003. <strong>FRET</strong> imag<strong>in</strong>g. Nat Biotechnol21:1387–1395.Rehm M, Dussm<strong>an</strong>n H, J<strong>an</strong>icke RU, Tavare JM, Kogel D, PrehnJH. 2002. S<strong>in</strong>gle-cell fluorescence reson<strong>an</strong>ce energy tr<strong>an</strong>sfer <strong>an</strong>alysisdemonstrates that caspase activation dur<strong>in</strong>g apoptosis is a rapidprocess. Role of caspase-3. J Biol Chem 277:24506–24514.Sekar RB, Periasamy A. 2003. Fluorescence reson<strong>an</strong>ce energy tr<strong>an</strong>sfer(<strong>FRET</strong>) microscopy imag<strong>in</strong>g of live cell prote<strong>in</strong> localizations.J Cell Biol 160:629–633.v<strong>an</strong> Rheenen J, L<strong>an</strong>geslag M, Jal<strong>in</strong>k K. 2004. Correct<strong>in</strong>g confocalacquisition to optimize imag<strong>in</strong>g of fluorescence reson<strong>an</strong>ce energytr<strong>an</strong>sfer by sensitized emission. Biophys J 86:2517–2529.Wouters FS, Verveer PJ, Bastiaens PI. 2001. Imag<strong>in</strong>g biochemistry<strong>in</strong>side cells. Trends Cell Biol 11:203–211.Xia Z, Liu Y. 2001. Reliable <strong>an</strong>d global measurement of fluorescencereson<strong>an</strong>ce energy tr<strong>an</strong>sfer us<strong>in</strong>g fluorescence microscopes. BiophysJ 81:2395–2402.