
Create successful ePaper yourself
Turn your PDF publications into a flip-book with our unique Google optimized e-Paper software.
SUBSIDIES<br />
Plot demand and supply curves for a product from linear functions and then illustrate<br />
and then illustrate the effects of the provision of a subsidy on the market (on price,<br />
quantity, consumer expenditure, producer revenue, government expenditure,<br />
consumer surplus and producer surplus).<br />
Step 1<br />
Use the linear functions given to draw the relevant demand and supply curves and to identify<br />
the equilibrium price and quantity. (See pages 3 & 5, if you cannot remember how to do<br />
this.)<br />
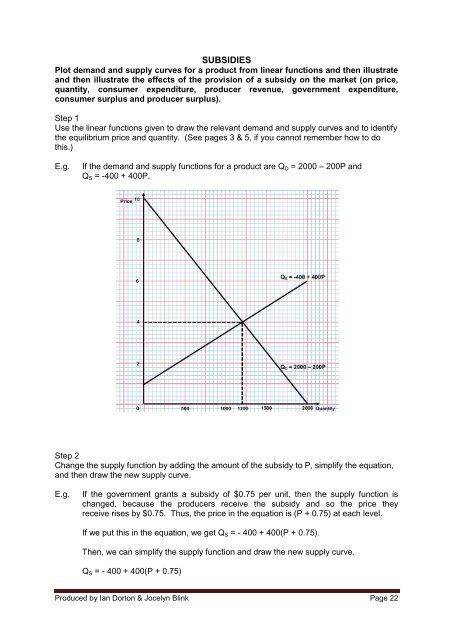
E.g.<br />
If the demand and supply functions for a product are Q D = 2000 – 200P and<br />
Q S = -400 + 400P.<br />
Step 2<br />
Change the supply function by adding the amount of the subsidy to P, simplify the equation,<br />
and then draw the new supply curve.<br />
E.g.<br />
If the government grants a subsidy of $0.75 per unit, then the supply function is<br />
changed, because the producers receive the subsidy and so the price they<br />
receive rises by $0.75. Thus, the price in the equation is (P + 0.75) at each level.<br />
If we put this in the equation, we get Q S = - 400 + 400(P + 0.75).<br />
Then, we can simplify the supply function and draw the new supply curve.<br />
Q S = - 400 + 400(P + 0.75)<br />
Produced by Ian Dorton & Jocelyn Blink Page 22