
Create successful ePaper yourself
Turn your PDF publications into a flip-book with our unique Google optimized e-Paper software.
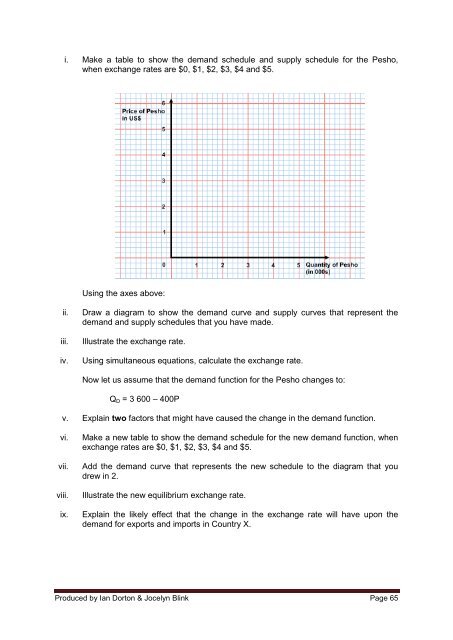
i. Make a table to show the demand schedule and supply schedule for the Pesho,<br />
when exchange rates are $0, $1, $2, $3, $4 and $5.<br />
Using the axes above:<br />
ii.<br />
iii.<br />
iv.<br />
Draw a diagram to show the demand curve and supply curves that represent the<br />
demand and supply schedules that you have made.<br />
Illustrate the exchange rate.<br />
Using simultaneous equations, calculate the exchange rate.<br />
Now let us assume that the demand function for the Pesho changes to:<br />
Q D = 3 600 – 400P<br />
v. Explain two factors that might have caused the change in the demand function.<br />
vi.<br />
vii.<br />
viii.<br />
ix.<br />
Make a new table to show the demand schedule for the new demand function, when<br />
exchange rates are $0, $1, $2, $3, $4 and $5.<br />
Add the demand curve that represents the new schedule to the diagram that you<br />
drew in 2.<br />
Illustrate the new equilibrium exchange rate.<br />
Explain the likely effect that the change in the exchange rate will have upon the<br />
demand for exports and imports in Country X.<br />
Produced by Ian Dorton & Jocelyn Blink Page 65