
Create successful ePaper yourself
Turn your PDF publications into a flip-book with our unique Google optimized e-Paper software.
7. Calculate the fall in consumer surplus resulting from the imposition of the tariff.<br />
The consumer surplus will fall by a total of the areas A+B+C+D+E.<br />
A+B+C+D = 2 million x 50c = $1 million. E = ½ x 500,000 x 50c = $125,000.<br />
So, the total loss of consumer surplus is $1,125,000.<br />
8. Calculate the dead-weight losses suffered as a result of imposing the tariff.<br />
The dead-weight losses are represented by areas B and E.<br />
Area B is the extra cost to “the world” of the output that is now produced by inefficient<br />
domestic producers, instead of efficient foreign producers = ½ x 500,000 x 50c =<br />
$125,000.<br />
Area E is the loss of consumer surplus from products that are no longer consumed<br />
and was calculated above to also be $125,000.<br />
Calculating from diagrams the effects of setting a quota on foreign producers on<br />
different stakeholders, including domestic producers, foreign producers, consumers<br />
and the government.<br />
Once a diagram has been given or drawn, you may be asked to include world supply curves<br />
and quotas and to calculate different effects of the quota.<br />
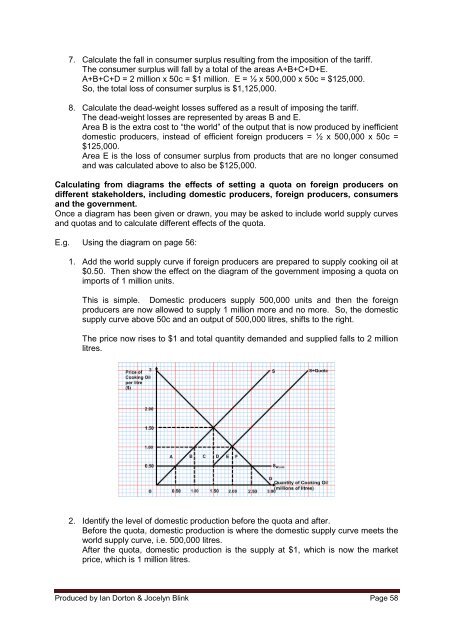
E.g. Using the diagram on page 56:<br />
1. Add the world supply curve if foreign producers are prepared to supply cooking oil at<br />
$0.50. Then show the effect on the diagram of the government imposing a quota on<br />
imports of 1 million units.<br />
This is simple. Domestic producers supply 500,000 units and then the foreign<br />
producers are now allowed to supply 1 million more and no more. So, the domestic<br />
supply curve above 50c and an output of 500,000 litres, shifts to the right.<br />
The price now rises to $1 and total quantity demanded and supplied falls to 2 million<br />
litres.<br />
2. Identify the level of domestic production before the quota and after.<br />
Before the quota, domestic production is where the domestic supply curve meets the<br />
world supply curve, i.e. 500,000 litres.<br />
After the quota, domestic production is the supply at $1, which is now the market<br />
price, which is 1 million litres.<br />
Produced by Ian Dorton & Jocelyn Blink Page 58