
You also want an ePaper? Increase the reach of your titles
YUMPU automatically turns print PDFs into web optimized ePapers that Google loves.
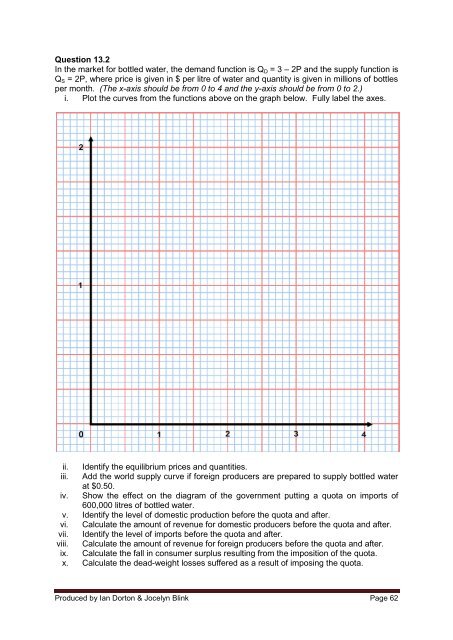
Question 13.2<br />
In the market for bottled water, the demand function is Q D = 3 – 2P and the supply function is<br />
Q S = 2P, where price is given in $ per litre of water and quantity is given in millions of bottles<br />
per month. (The x-axis should be from 0 to 4 and the y-axis should be from 0 to 2.)<br />
i. Plot the curves from the functions above on the graph below. Fully label the axes.<br />
ii. Identify the equilibrium prices and quantities.<br />
iii. Add the world supply curve if foreign producers are prepared to supply bottled water<br />
at $0.50.<br />
iv. Show the effect on the diagram of the government putting a quota on imports of<br />
600,000 litres of bottled water.<br />
v. Identify the level of domestic production before the quota and after.<br />
vi. Calculate the amount of revenue for domestic producers before the quota and after.<br />
vii. Identify the level of imports before the quota and after.<br />
viii. Calculate the amount of revenue for foreign producers before the quota and after.<br />
ix. Calculate the fall in consumer surplus resulting from the imposition of the quota.<br />
x. Calculate the dead-weight losses suffered as a result of imposing the quota.<br />
Produced by Ian Dorton & Jocelyn Blink Page 62