Strategic Partners Plus 3 - Prudential Annuities
Strategic Partners Plus 3 - Prudential Annuities
Strategic Partners Plus 3 - Prudential Annuities

You also want an ePaper? Increase the reach of your titles
YUMPU automatically turns print PDFs into web optimized ePapers that Google loves.
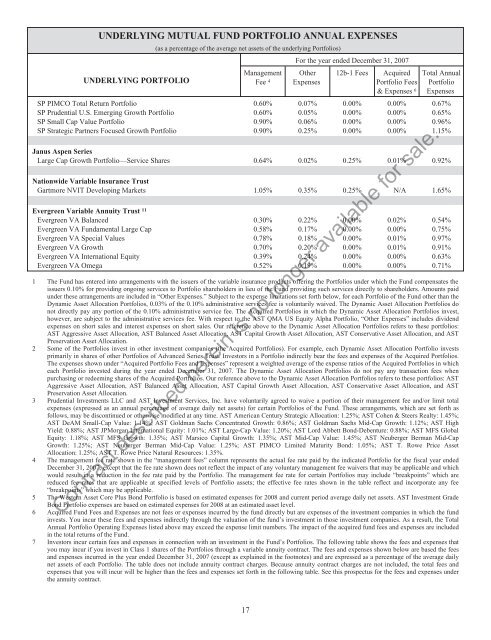
UNDERLYING MUTUAL FUND PORTFOLIO ANNUAL EXPENSES<br />
UNDERLYING PORTFOLIO<br />
(as a percentage of the average net assets of the underlying Portfolios)<br />
Management<br />
Fee 4<br />
For the year ended December 31, 2007<br />
Other<br />
Expenses<br />
12b-1 Fees Acquired<br />
Portfolio Fees<br />
& Expenses 6<br />
Total Annual<br />
Portfolio<br />
Expenses<br />
SP PIMCO Total Return Portfolio 0.60% 0.07% 0.00% 0.00% 0.67%<br />
SP <strong>Prudential</strong> U.S. Emerging Growth Portfolio 0.60% 0.05% 0.00% 0.00% 0.65%<br />
SP Small Cap Value Portfolio 0.90% 0.06% 0.00% 0.00% 0.96%<br />
SP <strong>Strategic</strong> <strong>Partners</strong> Focused Growth Portfolio 0.90% 0.25% 0.00% 0.00% 1.15%<br />
Janus Aspen Series<br />
Large Cap Growth Portfolio—Service Shares 0.64% 0.02% 0.25% 0.01% 0.92%<br />
Nationwide Variable Insurance Trust<br />
Gartmore NVIT Developing Markets 1.05% 0.35% 0.25% N/A 1.65%<br />
Evergreen Variable Annuity Trust 11<br />
Evergreen VA Balanced 0.30% 0.22% 0.00% 0.02% 0.54%<br />
Evergreen VA Fundamental Large Cap 0.58% 0.17% 0.00% 0.00% 0.75%<br />
Evergreen VA Special Values 0.78% 0.18% 0.00% 0.01% 0.97%<br />
Evergreen VA Growth 0.70% 0.20% 0.00% 0.01% 0.91%<br />
Evergreen VA International Equity 0.39% 0.24% 0.00% 0.00% 0.63%<br />
Evergreen VA Omega 0.52% 0.19% 0.00% 0.00% 0.71%<br />
1 The Fund has entered into arrangements with the issuers of the variable insurance products offering the Portfolios under which the Fund compensates the<br />
issuers 0.10% for providing ongoing services to Portfolio shareholders in lieu of the Fund providing such services directly to shareholders. Amounts paid<br />
under these arrangements are included in “Other Expenses.” Subject to the expense limitations set forth below, for each Portfolio of the Fund other than the<br />
Dynamic Asset Allocation Portfolios, 0.03% of the 0.10% administrative services fee is voluntarily waived. The Dynamic Asset Allocation Portfolios do<br />
not directly pay any portion of the 0.10% administrative service fee. The Acquired Portfolios in which the Dynamic Asset Allocation Portfolios invest,<br />
however, are subject to the administrative services fee. With respect to the AST QMA US Equity Alpha Portfolio, “Other Expenses” includes dividend<br />
expenses on short sales and interest expenses on short sales. Our reference above to the Dynamic Asset Allocation Portfolios refers to these portfolios:<br />
AST Aggressive Asset Allocation, AST Balanced Asset Allocation, AST Capital Growth Asset Allocation, AST Conservative Asset Allocation, and AST<br />
Preservation Asset Allocation.<br />
2 Some of the Portfolios invest in other investment companies (the Acquired Portfolios). For example, each Dynamic Asset Allocation Portfolio invests<br />
primarily in shares of other Portfolios of Advanced Series Trust. Investors in a Portfolio indirectly bear the fees and expenses of the Acquired Portfolios.<br />
The expenses shown under “Acquired Portfolio Fees and Expenses” represent a weighted average of the expense ratios of the Acquired Portfolios in which<br />
each Portfolio invested during the year ended December 31, 2007. The Dynamic Asset Allocation Portfolios do not pay any transaction fees when<br />
purchasing or redeeming shares of the Acquired Portfolios. Our reference above to the Dynamic Asset Allocation Portfolios refers to these portfolios: AST<br />
Aggressive Asset Allocation, AST Balanced Asset Allocation, AST Capital Growth Asset Allocation, AST Conservative Asset Allocation, and AST<br />
Preservation Asset Allocation.<br />
3 <strong>Prudential</strong> Investments LLC and AST Investment Services, Inc. have voluntarily agreed to waive a portion of their management fee and/or limit total<br />
expenses (expressed as an annual percentage of average daily net assets) for certain Portfolios of the Fund. These arrangements, which are set forth as<br />
follows, may be discontinued or otherwise modified at any time. AST American Century <strong>Strategic</strong> Allocation: 1.25%; AST Cohen & Steers Realty: 1.45%;<br />
AST DeAM Small-Cap Value: 1.14%; AST Goldman Sachs Concentrated Growth: 0.86%; AST Goldman Sachs Mid-Cap Growth: 1.12%; AST High<br />
Yield: 0.88%; AST JPMorgan International Equity: 1.01%; AST Large-Cap Value: 1.20%; AST Lord Abbett Bond-Debenture: 0.88%; AST MFS Global<br />
Equity: 1.18%; AST MFS Growth: 1.35%; AST Marsico Capital Growth: 1.35%; AST Mid-Cap Value: 1.45%; AST Neuberger Berman Mid-Cap<br />
Growth: 1.25%; AST Neuberger Berman Mid-Cap Value: 1.25%; AST PIMCO Limited Maturity Bond: 1.05%; AST T. Rowe Price Asset<br />
Allocation: 1.25%; AST T. Rowe Price Natural Resources: 1.35%.<br />
4 The management fee rate shown in the “management fees” column represents the actual fee rate paid by the indicated Portfolio for the fiscal year ended<br />
December 31, 2007, except that the fee rate shown does not reflect the impact of any voluntary management fee waivers that may be applicable and which<br />
would result in a reduction in the fee rate paid by the Portfolio. The management fee rate for certain Portfolios may include “breakpoints” which are<br />
reduced fee rates that are applicable at specified levels of Portfolio assets; the effective fee rates shown in the table reflect and incorporate any fee<br />
“breakpoints” which may be applicable.<br />
5 The Western Asset Core <strong>Plus</strong> Bond Portfolio is based on estimated expenses for 2008 and current period average daily net assets. AST Investment Grade<br />
Bond Portfolio expenses are based on estimated expenses for 2008 at an estimated asset level.<br />
6 Acquired Fund Fees and Expenses are not fees or expenses incurred by the fund directly but are expenses of the investment companies in which the fund<br />
invests. You incur these fees and expenses indirectly through the valuation of the fund’s investment in those investment companies. As a result, the Total<br />
Annual Portfolio Operating Expenses listed above may exceed the expense limit numbers. The impact of the acquired fund fees and expenses are included<br />
in the total returns of the Fund.<br />
7 Investors incur certain fees and expenses in connection with an investment in the Fund’s Portfolios. The following table shows the fees and expenses that<br />
you may incur if you invest in Class 1 shares of the Portfolios through a variable annuity contract. The fees and expenses shown below are based the fees<br />
and expenses incurred in the year ended December 31, 2007 (except as explained in the footnotes) and are expressed as a percentage of the average daily<br />
net assets of each Portfolio. The table does not include annuity contract charges. Because annuity contract charges are not included, the total fees and<br />
expenses that you will incur will be higher than the fees and expenses set forth in the following table. See this prospectus for the fees and expenses under<br />
the annuity contract.<br />
Contract described herein is no longer available for sale.<br />
17