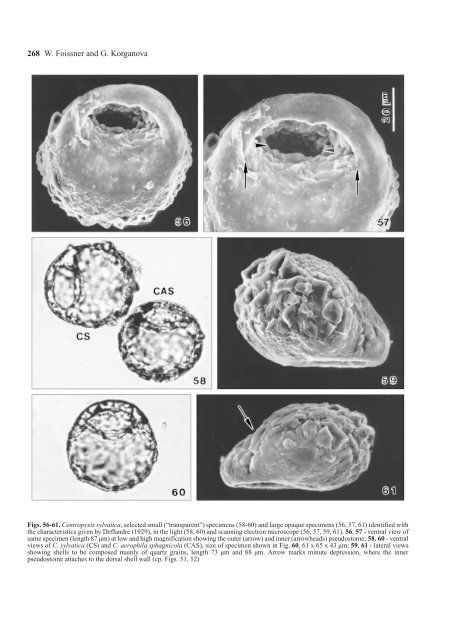
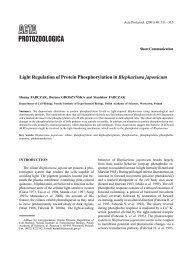
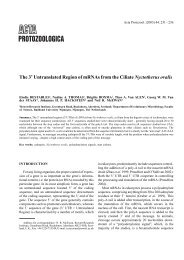
268 W. Foissner and G. Korganova Figs. 56-61. <strong>Centropyxis</strong> sylvatica, selected small (“transparent”) specimens (58-60) and large opaque specimens (56, 57, 61) identified with the characteristics given by Deflandre (1929), in the light (58, 60) and scanning electron microscope (56, 57, 59, 61). 56, 57 - ventral view of same specimen (length 87 µm) at low and high magnification showing the outer (arrow) and inner (arrowheads) pseudostome; 58, 60 - ventral views of C. sylvatica (CS) and C. <strong>aerophila</strong> sphagnicola (CAS), size of specimen shown in Fig. 60, 61 x 65 x 43 µm; 59, 61 - lateral views showing shells to be composed mainly of quartz grains, length 73 µm and 88 µm. Arrow marks minute depression, where the inner pseudostome attaches to the dorsal shell wall (cp. Figs. 51, 52)
<strong>The</strong> <strong>Centropyxis</strong> <strong>aerophila</strong> complex 269 is mainly brought about by accumulation of agglutinated material on the dorsal and lateral shell wall. Thus, the ventral lip is possibly not “perforated” in the strict sense of the word; this is also indicated by its general appearance, which is as in the other varieties (Figs. 32, 38). In the scanning electron microscope, a lip perforation was seen in several small (transparent; Figs. 41-47, 48-53) and large (“typical”) C. sylvatica specimens (Figs. 54, 55, 56, 57), showing that the species cannot be recognised by size. Lobose pseudopods and their movements, as well as two contractile vacuoles, were described by Bonnet (1961) in C. sylvatica var. minor. Rauenbusch (1987) and Lüftenegger et al. (1988) provided some helpful scanning electron micrographs showing that shell wall structure highly depends on the substrate the organisms live. Lüftenegger et al. (1988) provided also detailed morphometrics showing that pseudostome features are more variable than the length and width of the shell. Scattered measurements were given by other authors (Bonnet and Thomas 1955, Rosa 1971), broadening, however, Deflandre’s limits only slightly: 56-113 (length) x 47-100 (width) x 45-68 (height) µm; pseudostome 23-55 (long axis) x 20-32 (short axis) µm. Morphometry Basic statistics show that most variables have usual coefficients of variation and the number of specimens investigated is sufficient because mean and median hardly change if 127 or 217 specimens are analysed (Table 1). Of course, variation is distinctly lower in the selected specimens (Table 2). Only a few of the variables measured are normally distributed, viz. shell width, ratio shell length: abdomen length, and ratio shell width: abdomen length. All other features are slightly skewed to the left. Analysis of variance: If the 30 selected specimens of each are compared (all intermediate shells removed, see Method section!), all variables tested (length, width…) are significantly different (p ≤ 0.001), except the ratio shell length: abdomen length, that is, the three taxa can be clearly distinguished. If the 127 randomly chosen specimens are compared with the 30 selected specimens of either C. <strong>aerophila</strong> <strong>aerophila</strong> or C. <strong>aerophila</strong> sylvatica, highly significant differences (p ≤ 0.001 to p ≤ 0.05) still occur in most variables, except for the ratios; in contrast, only shell height, shell length, short pseudostome axis, and the length: width ratio are different (p ≤ 0.05) in C. <strong>aerophila</strong> sphagnicola, indicating that this variety is intermediate between the two others. Finally, when the 30 selected specimens of each are pooled (= 90 specimens) and compared with the 127 randomly chosen specimens, all variables become indistinguishable (p ≥ 0.05). Frequency distributions and relationships between variables (only some representative examples each are shown, Figs. 62a-f): Frequency distributions show curves with a single peak (Fig. 62d). Likewise, rather homogenous clusters are formed in the randomly chosen specimens, when variables are plotted against each other (Figs. 62a-c). In contrast, two distinct clusters are usually formed, if the selected specimens are plotted (Figs. 62e, f): one contains C. <strong>aerophila</strong> <strong>aerophila</strong> and C. <strong>aerophila</strong> sphagnicola, the other C. <strong>aerophila</strong> sylvatica. DISCUSSION Morphometry Although species cannot be proven mathematically, some basic statistics are often useful to distinguish them more properly. As concerns the present material, neither the coefficients of variation (Table 1) nor frequency distributions (Fig. 62d) and relationships between the variables tested (Figs. 62a - c) give any indication that the randomly chosen specimens consist of more than one species. Variation coefficients (Tables 1, 2) are of the same order of magnitude as in multicellular organisms (Mayr 1975) and other protozoans, e.g. ciliates (Foissner 1984, 1993), and as in testate amoebae in general (Lüftenegger et al. 1988, Wanner 1991, Foissner and Korganova 1995). Only the pseudostome variables have coefficients higher than 20%; however, this seems to be a general feature of testacean shells (Lüftenegger et al. 1988, Wanner 1991). However, the situation changes drastically in the selected material, that is, when all intermediate specimens, which could not unequivocally assigned to one of Deflandre’s varieties, are excluded (Table 2). <strong>The</strong>n, three taxa can be distinguished by analysis of variance and at least two in scatter diagrams (Figs. 62e, f), just as different species were compared (Lüftenegger et al. 1988). <strong>Centropyxis</strong> <strong>aerophila</strong> sylvatica is separated by its larger dimensions, while C. <strong>aerophila</strong> <strong>aerophila</strong> and C. <strong>aerophila</strong> sphagnicola are distinguished mainly by the shell proportions (Table 2): the former is broadly elliptical (66.6 x 56.4 µm), the latter almost circular (66.2 x 65.6 µm); furthermore, the long pseudostome axis is distinctly larger in C. <strong>aerophila</strong> sphagnicola