Fort Erie Creeks Watershed Plan - Niagara Peninsula Conservation ...
Fort Erie Creeks Watershed Plan - Niagara Peninsula Conservation ...
Fort Erie Creeks Watershed Plan - Niagara Peninsula Conservation ...

Create successful ePaper yourself
Turn your PDF publications into a flip-book with our unique Google optimized e-Paper software.
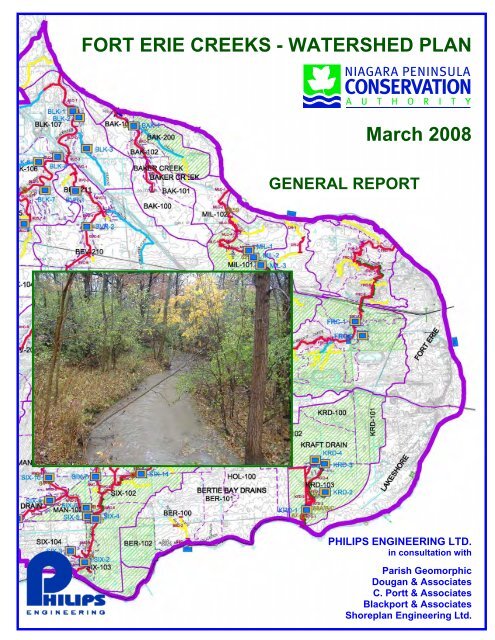
FORT ERIE CREEKS - WATERSHED PLAN<br />
March 2008<br />
GENERAL REPORT<br />
PHILIPS ENGINEERING LTD.<br />
in consultation with<br />
Parish Geomorphic<br />
Dougan & Associates<br />
C. Portt & Associates<br />
Blackport & Associates<br />
Shoreplan Engineering Ltd.
FORT ERIE CREEKS - WATERSHED PLAN<br />
GENERAL REPORT<br />
NIAGARA PENINSULA CONSERVATION AUTHORITY<br />
FORT ERIE<br />
March 2008<br />
PHILIPS ENGINEERING LTD.<br />
In consultation with<br />
Parish Geomorphic<br />
Dougan and Associates<br />
C. Portt and Associates<br />
Blackport and Associates<br />
Shoreplan Engineering Ltd.<br />
E-Mail Address: admin@philipseng.on.ca
TABLE OF CONTENTS<br />
Section<br />
Page No.<br />
1. INTRODUCTION .............................................................................................................. 1<br />
1.1 Process .................................................................................................................... 1<br />
1.2 Background and Study Area Overview .................................................................. 1<br />
1.3 Administration ........................................................................................................ 2<br />
1.4 Public/Stakeholder Process..................................................................................... 2<br />
1.5 Project Team ........................................................................................................... 3<br />
1.6 Reporting Structure................................................................................................. 3<br />
2. WATERSHED AREA CHARACTERIZATION............................................................... 4<br />
2.1 Hydrogeology ......................................................................................................... 4<br />
2.1.1 Background Information Collection ........................................................... 5<br />
2.1.2 Work Activities........................................................................................... 5<br />
2.1.3 Findings/Constraint Identification .............................................................. 6<br />
2.1.4 Summary of Significant Features/Constraints .......................................... 12<br />
2.2 Hydrology ............................................................................................................. 12<br />
2.2.1 Background Information Collection ......................................................... 12<br />
2.2.2 Work Activities......................................................................................... 14<br />
2.2.3 Findings/Constraint Identification ............................................................ 21<br />
2.2.4 Summary of Significant Features/Constraints .......................................... 25<br />
2.3 Hydraulics/Floodplain Mapping ........................................................................... 25<br />
2.3.1 Background Information Collection ......................................................... 25<br />
2.3.2 Work Activities......................................................................................... 25<br />
2.3.3 Findings/Constraint Identification ............................................................ 27<br />
2.3.4 Summary of Significant Features/Constraints .......................................... 31<br />
2.4 Stream Morphology .............................................................................................. 31<br />
2.4.1 Background Information........................................................................... 31<br />
2.4.2 Work Activities......................................................................................... 36<br />
2.4.3 Findings/Constraint Identification ............................................................ 38<br />
2.5 Fish and Aquatic Habitat ...................................................................................... 39<br />
2.5.1 Background Information........................................................................... 39<br />
2.5.2 Work Activities......................................................................................... 40<br />
2.5.3 Findings/Constraint Identification ............................................................ 40<br />
2.5.4 Summary of Significant Features/Constraints .......................................... 49<br />
2.6 Natural Heritage System....................................................................................... 49<br />
2.6.1 Background Information........................................................................... 50<br />
2.6.2 Work Activities......................................................................................... 52<br />
2.6.3 Findings/Constraint Identification ............................................................ 56<br />
2.6.4 Summary of Significant Features/Constraints .......................................... 73<br />
2.7 Water Quality........................................................................................................ 74<br />
2.7.1 Background Information Collection ......................................................... 75<br />
2.7.2 Work Activities......................................................................................... 75<br />
2.7.3 Findings..................................................................................................... 75<br />
2.8 Rural Point and Non-Point Source Pollution........................................................ 88<br />
2.8.1 Background Information Collection ......................................................... 88<br />
2.8.2 Work Activities......................................................................................... 88<br />
2.8.3 Findings..................................................................................................... 89<br />
March 2008 i <strong>Fort</strong> <strong>Erie</strong> <strong>Creeks</strong> <strong>Watershed</strong> <strong>Plan</strong><br />
General Report (105116)
TABLE OF CONTENTS<br />
Section<br />
Page No.<br />
2.9 Lake <strong>Erie</strong> Shoreline............................................................................................... 89<br />
2.9.1 Background Information Collection ......................................................... 89<br />
2.9.2 Work Activities......................................................................................... 90<br />
2.9.3 Findings/Constraint Identification ............................................................ 90<br />
2.10 Land Use ............................................................................................................... 93<br />
2.10.1 Background Information Collection ......................................................... 93<br />
2.10.2 Work Activities......................................................................................... 93<br />
2.10.3 Findings /Constraint Identification ........................................................... 93<br />
3. SUMMARY OF POLICIES, OBJECTIVES AND TARGETS....................................... 94<br />
3.1 Policy .................................................................................................................... 98<br />
3.1.1 Hydrogeology ........................................................................................... 99<br />
3.1.2 Flooding and Erosion.............................................................................. 100<br />
3.1.3 Stream Morphology ................................................................................ 102<br />
3.1.4 Aquatic Habitat and Fisheries................................................................. 102<br />
3.1.5 Water Quality.......................................................................................... 105<br />
3.1.6 Terrestrial Natural Heritage .................................................................... 106<br />
3.2 Objectives ........................................................................................................... 108<br />
3.2.1 Hydrogeology ......................................................................................... 110<br />
3.2.2 Flooding .................................................................................................. 111<br />
3.2.3 Erosion .................................................................................................... 111<br />
3.2.4 Stream Morphology ................................................................................ 111<br />
3.2.5 Aquatic Habitat and Fisheries................................................................. 111<br />
3.2.6 Surface Water Quality............................................................................. 112<br />
3.2.7 Terrestrial Natural Heritage .................................................................... 112<br />
3.3 Targets................................................................................................................. 112<br />
3.3.1 Storm Drainage System .......................................................................... 112<br />
3.3.2 Creek Erosion.......................................................................................... 113<br />
3.3.3 Water Quality.......................................................................................... 113<br />
3.3.4 Terrestrial Natural Heritage .................................................................... 113<br />
4. IMPACT ASSESSMENT............................................................................................... 115<br />
4.1 Water Quantity.................................................................................................... 115<br />
4.1.1 Groundwater and Baseflow..................................................................... 115<br />
4.1.2 Flooding .................................................................................................. 115<br />
4.1.3 Erosion .................................................................................................... 123<br />
4.2 Water Quality...................................................................................................... 126<br />
4.3 Terrestrial Natural Heritage System ................................................................... 128<br />
4.4 Aquatic Resources .............................................................................................. 136<br />
4.5 Watercourse Systems.......................................................................................... 137<br />
5. WATERSHED MANAGEMENT OPPORTUNITIES .................................................. 143<br />
5.1 General................................................................................................................ 143<br />
5.1.1 Definitions of Key Systems .................................................................... 143<br />
5.1.2 General <strong>Watershed</strong> Goals and Objectives............................................... 145<br />
5.2 <strong>Watershed</strong>-Wide Constraints and Opportunities ................................................ 145<br />
5.2.1 Watercourse System Opportunities......................................................... 147<br />
5.2.2 Natural Heritage System Opportunities.................................................. 149<br />
March 2008 ii <strong>Fort</strong> <strong>Erie</strong> <strong>Creeks</strong> <strong>Watershed</strong> <strong>Plan</strong><br />
General Report (105116)
TABLE OF CONTENTS<br />
Section<br />
Page No.<br />
5.2.3 Stormwater Management (Quality and Quantity) System Opportunities152<br />
5.3 Area-Specific Management Opportunities ......................................................... 153<br />
5.3.1 Integrated Rating of Watercourse Systems............................................. 153<br />
5.3.2 Integrated Rating of Terrestrial Natural Heritage Systems..................... 160<br />
5.4 Local Subwatershed Opportunities..................................................................... 172<br />
5.4.1 Summary of Local Subwatershed Opportunities .................................... 178<br />
6. IMPLEMENTATION..................................................................................................... 189<br />
6.1 Priority List of Recommendations...................................................................... 189<br />
6.2 Discussion on Monitoring and Adaptive Management <strong>Plan</strong> .............................. 198<br />
6.3 Future Studies ..................................................................................................... 199<br />
6.4 Implementation Committee ................................................................................ 200<br />
7. CONCLUSIONS............................................................................................................. 201<br />
REFERENCES ............................................................................................................................202<br />
GLOSSARY OF TERMS............................................................................................................206<br />
Figure 1:<br />
Figure 2:<br />
Figure 3:<br />
Figure 3A:<br />
Figure 4:<br />
Figure 4A:<br />
Figure 5:<br />
Figure 5A:<br />
Figure 6:<br />
Figure 7:<br />
Figure 7A:<br />
Figure 8:<br />
Figure 9<br />
Figure 10:<br />
Figure 11:<br />
Figure 12:<br />
Figure 13:<br />
Figure 14:<br />
FIGURES<br />
Study Area<br />
Surficial Geology<br />
Bedrock Geology & Topography<br />
Bedrock Topography<br />
Hydrogeologic Cross-Section<br />
WHI <strong>Fort</strong> <strong>Erie</strong> Cross Section<br />
Drift Thickness<br />
Water Well Locations<br />
Generalized Potentiometric Surface in Overburden<br />
Generalized Potentiometric Surface in Bedrock<br />
Shallow Intrinsic Susceptibility<br />
Municipal Drains<br />
<strong>Watershed</strong> Boundary<br />
Modeling Schematic<br />
Land Use Map<br />
Hydrologic Soil Groups<br />
<strong>Watershed</strong> Used for Calibration<br />
Subcatchments where Imperviousness Increased<br />
10% or More<br />
Figure 15: Lake <strong>Erie</strong> Shoreline Hazard Area 1<br />
Figure 16: Lake <strong>Erie</strong> Shoreline Hazard Area 2<br />
Figure 17: Lake <strong>Erie</strong> Shoreline Hazard Area 3<br />
Figure 18:<br />
Figure 19:<br />
Figure 20:<br />
Locations of Surveyed Cross-Section<br />
Surveyed Cross-Section<br />
NPCA Water Quality Monitoring Sites<br />
March 2008 iii <strong>Fort</strong> <strong>Erie</strong> <strong>Creeks</strong> <strong>Watershed</strong> <strong>Plan</strong><br />
General Report (105116)
TABLE OF CONTENTS<br />
Subwatershed Local Opportunities Figures<br />
LO 1.1, 1.2 Black Creek<br />
LO 2.1, 2.2 Beaver Creek<br />
LO 3.1, 3.2 Baker Creek<br />
LO 4.1, 4.2 Miller Creek<br />
LO 5.1, 5.2 <strong>Niagara</strong> River Shore<br />
LO 6.1, 6.2 Frenchman’s Creek<br />
LO 7.1, 7.2 <strong>Fort</strong> <strong>Erie</strong><br />
LO 8.1, 8.2 Lakeshore<br />
LO 9.1, 9.2 Kraft Drain<br />
LO 10.1, 10.2 Bertie Bay Drains and Lake <strong>Erie</strong> 1<br />
LO 11.1, 11.2 Six Mile Creek/Mann Drain<br />
Watercourse Systems Figures<br />
Figure WS1<br />
Figure WS2<br />
Figure WS3<br />
Figure WS4<br />
Figure WS5<br />
Study Area<br />
Stream Morphology Reaches<br />
Surveyed Culvert/Bridges Location <strong>Plan</strong><br />
Floodplain Mapping Area<br />
Floodplain Mapping (Sample)<br />
Natural Heritage System Figures<br />
Figure NH1:<br />
Figure NH2:<br />
Figure NH3a:<br />
Figure NH3b:<br />
Figure NH4:<br />
Figure NH5:<br />
Figure NH6:<br />
Figure NH7:<br />
Figure NH8:<br />
Figure AB1:<br />
Figure AB2:<br />
Wetlands<br />
Dominant Cover Type<br />
Original Landscapes<br />
Current Natural Landscapes<br />
Recent Forest Change<br />
Natural Areas Significance<br />
Interior Forest<br />
Estimate of Slough Mosaic Landscapes:<br />
Remaining and Levelled<br />
Proposed Natural Heritage Strategy<br />
Aquatic Biology – Fish Sampling Locations<br />
MNR Stream Type<br />
March 2008 iv <strong>Fort</strong> <strong>Erie</strong> <strong>Creeks</strong> <strong>Watershed</strong> <strong>Plan</strong><br />
General Report (105116)
TABLE OF CONTENTS<br />
GENERAL REPORT APPENDICES<br />
Consultation Appendices<br />
Appendix ‘A’<br />
Appendix ‘B’<br />
Appendix ‘C’<br />
Appendix ‘D’<br />
Appendix ‘E’<br />
Appendix ‘F’<br />
Appendix ‘G’<br />
Appendix ‘H’<br />
Appendix ‘I’<br />
Appendix ‘J’<br />
Public Record<br />
PIC Material<br />
Meeting Minutes<br />
Agency Comments & Responses<br />
(Under separate cover)<br />
Landowner Survey<br />
Study Terms of Reference<br />
Agency (NPCA, Town) Information<br />
NWQPS & Remedial Action <strong>Plan</strong> Excerpts<br />
DFO Drain Primer<br />
NPCA Draft 2007 Restoration Program Guidelines<br />
TECHNICAL APPENDICES (Separate Binder)<br />
Watercourse System Technical Appendices<br />
Appendix ‘WC-A’<br />
Appendix ‘WC-B’<br />
Appendix ‘WC-C’<br />
Appendix ‘WC-D’<br />
Appendix ‘WC-E’<br />
Appendix ‘WC-F’<br />
Appendix ‘WC-G’<br />
Appendix ‘WC-H’<br />
Erosion Monitoring<br />
Stream Morphology Inventory<br />
Stream Cross-sections<br />
Meander Belt Widths<br />
Structure Inventory<br />
HEC-RAS Results<br />
Assessment of Potential Flood Damage Locations<br />
<strong>Fort</strong> <strong>Erie</strong> <strong>Creeks</strong> Floodline Mapping<br />
Town of <strong>Fort</strong> <strong>Erie</strong> Council Presentation<br />
Stormwater Management, Hydrogeology, and Shoreline Management<br />
Technical Appendices<br />
Appendix ‘SW-A’<br />
Appendix ‘SW-B’<br />
Appendix ‘SW-C’<br />
Appendix ‘SW-D’<br />
Appendix ‘SW-E’<br />
Appendix ‘SW-F’<br />
Hydrologic Parameters – Existing Land Use<br />
SWMHYMO Input and Summary Files<br />
Water Quality<br />
Hydrogeologic Background Information<br />
Guidelines for Hydrogeologic Studies<br />
Shoreline Management<br />
Natural Heritage Technical Appendices<br />
Appendix ‘NH-A’ Ministry of Natural Resources, February 2000<br />
Fisheries Management Guidelines<br />
Appendix ‘NH-B’ Fish Collection Reports and Photos<br />
Appendix ‘NH-C’ Discussion on Implementation of the Natural<br />
Heritage Strategy<br />
March 2008 v <strong>Fort</strong> <strong>Erie</strong> <strong>Creeks</strong> <strong>Watershed</strong> <strong>Plan</strong><br />
General Report (105116)
FORT ERIE CREEKS - WATERSHED PLAN<br />
GENERAL REPORT<br />
NIAGARA PENINSULA CONSERVATION AUTHORITY<br />
FORT ERIE<br />
1. INTRODUCTION<br />
The <strong>Niagara</strong> <strong>Peninsula</strong> <strong>Conservation</strong> Authority (NPCA) has commissioned the preparation of a<br />
<strong>Watershed</strong> <strong>Plan</strong> for the <strong>Fort</strong> <strong>Erie</strong> <strong>Creeks</strong> <strong>Watershed</strong> <strong>Plan</strong>ning Area (WSPA). The <strong>Fort</strong> <strong>Erie</strong><br />
<strong>Creeks</strong> <strong>Watershed</strong> <strong>Plan</strong> provides strategies that will allow the community to care for water<br />
resources, natural heritage, settlement and agriculture in the context of land use planning<br />
documents (e.g., Official <strong>Plan</strong>s). It also provides strategies for implementing specific watershed<br />
initiatives and specifies who is responsible for remedial actions outside of the land use planning<br />
process (e.g. restoration opportunities on public and private lands).<br />
1.1 Process<br />
As part of the <strong>Niagara</strong> Water Quality Protection Strategy (NWQPS), completed in 2003, the <strong>Fort</strong><br />
<strong>Erie</strong> <strong>Creeks</strong> <strong>Watershed</strong> <strong>Plan</strong>ning Area was recommended for further study. The NWQPS<br />
identified three Local Management Areas (LMA’s) 2.13, 2.18, and 3.4 (ref. Appendix ‘H’),<br />
which cover almost all of the Town of <strong>Fort</strong> <strong>Erie</strong>, a portion of the easterly limits of the City of<br />
Port Colborne, and a small area in the southern part of the City of <strong>Niagara</strong> Falls. The<br />
subwatersheds, which are encompassed by this <strong>Watershed</strong> <strong>Plan</strong> include: Black Creek, Beaver<br />
Creek, Baker Creek, Miller Creek, <strong>Niagara</strong> River Shore (<strong>Niagara</strong> River #16, 19, 20, 21, & 22),<br />
Frenchman’s Creek, <strong>Fort</strong> <strong>Erie</strong>, Lakeshore, Kraft Drain, Bertie Bay Drains & Lake <strong>Erie</strong> 1, and Six<br />
Mile Creek.<br />
1.2 Background and Study Area Overview<br />
The <strong>Watershed</strong> <strong>Plan</strong> study was initiated in part due to the fact that the NWQPS recommended<br />
that additional technical and physical study would be required to address certain key issues and<br />
objectives within the local study areas.<br />
The large watersheds from the list above include: Black Creek, Beaver Creek, Frenchman’s<br />
Creek, Six Mile Creek, Miller Creek, Baker Creek and Kraft Drain. The study area of each<br />
LMA within the WSPA is large, with 106.7 km 2 (LMA 2.13), 35.8 km 2 (LMA 2.18) and<br />
37.6 km 2 (LMA 3.4). Urban areas as follows: 6.2 km 2 , 10.5 km 2 and 11.0 km 2 respectively.<br />
March 2008 1 <strong>Fort</strong> <strong>Erie</strong> <strong>Creeks</strong> <strong>Watershed</strong> <strong>Plan</strong><br />
General Report (105116)
1.3 Administration<br />
This study has been prepared under the direction of a Technical Steering Committee comprised<br />
of the following members:<br />
<strong>Niagara</strong> <strong>Peninsula</strong> <strong>Conservation</strong><br />
Authority<br />
Town of <strong>Fort</strong> <strong>Erie</strong><br />
Regional Municipality of <strong>Niagara</strong><br />
Ministry of Natural Resources<br />
<strong>Niagara</strong> Parks Commission<br />
Suzanne McInnes, Tony D’Amario, Steve Miller,<br />
Jennifer Durley, Geoff Verkade, Jayne Campbell,<br />
Jocelyn Baker, Ian Barrett, Annie Michaud<br />
David Heyworth, Brett Ruck, Ron Tripp<br />
Brian Dick<br />
Mike Stone<br />
Debbie Whitehouse<br />
The foregoing committee members have provided comments and technical direction throughout<br />
the study process (ref. Appendices ‘B’ and ‘C’ for comments and meeting minutes).<br />
1.4 Public/Stakeholder Process<br />
This watershed planning process has included several points of contact with the Public and<br />
stakeholders. Five points of formal Public contact were initiated as follows (ref. Appendix ‘A’).<br />
Date Type Description<br />
September, 2005 Notice of Study Notice of Commencement of the Study and<br />
Field Inventories<br />
April 6, 2006 Workshop #1 <strong>Watershed</strong> Characterization and Vision<br />
Statements<br />
October 10, 2006 Workshop #2 General <strong>Watershed</strong> Management<br />
Opportunities<br />
February 6, 2007 Workshop #3 Local Management Opportunities<br />
June 28, 2007 Open House Draft Final <strong>Watershed</strong> <strong>Plan</strong><br />
The public will be provided with a final opportunity to review the plan after the final Open<br />
House.<br />
In addition to the foregoing, the NPCA conducted a Rural Landowner Survey in late 2005/early<br />
2006. The Study Team distributed three newsletters, and the NPCA posted the newsletters on its<br />
website. Several meetings were held with the area residents, as well as the Friends of <strong>Fort</strong> <strong>Erie</strong><br />
<strong>Creeks</strong>, an active local interest group, whose objectives include the annual monitoring of the<br />
creeks for water quality, fisheries, and erosion, as well as managing local restoration programs.<br />
March 2008 2 <strong>Fort</strong> <strong>Erie</strong> <strong>Creeks</strong> <strong>Watershed</strong> <strong>Plan</strong><br />
General Report (105116)
1.5 Project Team<br />
The Project Team responsible for producing this <strong>Watershed</strong> <strong>Plan</strong> has been comprised of the<br />
following firms and key personnel:<br />
Firm Key Members Discipline<br />
Responsibilities<br />
Philips Engineering Ltd.<br />
Ron Scheckenberger, Project Manager<br />
Brian Bishop, Rizwan Ul-Haq<br />
Project Management –<br />
Water Resources<br />
Engineering, Water<br />
Quality<br />
Dougan and Associates Elizabeth Snell, Ken Ursic, Karl Konze Terrestrial Resources<br />
C. Portt and Associates Cam Portt, George Coker Fisheries, Benthic<br />
Resources, Water Quality<br />
Blackport and Associates Bill Blackport Hydrogeology<br />
Parish Geomorphic John Parish, Susi Kostyniuk Stream Morphology<br />
Shoreplan Engineering Inc. Milo Sturm Shoreline Engineering<br />
1.6 Reporting Structure<br />
This General Report provides detailed information related to the study process, analyses,<br />
assessment and recommendations. The General Report documents the following:<br />
• Subwatershed Characterization<br />
• Subwatershed Management Strategies<br />
• Implementation and Monitoring <strong>Plan</strong><br />
There are two appendices included with the General Report: a General Appendix, containing all<br />
of the consultation documents, followed by a Technical Appendix (bound under separate cover)<br />
containing the three following sub-appendices:<br />
• Natural Heritage System<br />
• Watercourse Systems<br />
• Stormwater Management<br />
A Summary Report has also been prepared, which provides an overview of the <strong>Watershed</strong> <strong>Plan</strong>,<br />
and focuses on the implementation procedure.<br />
March 2008 3 <strong>Fort</strong> <strong>Erie</strong> <strong>Creeks</strong> <strong>Watershed</strong> <strong>Plan</strong><br />
General Report (105116)
2. WATERSHED AREA CHARACTERIZATION<br />
A large number of reports, studies, field inventory records, and maps of varying vintage have<br />
been acquired for use in this study. A list of the information used in contained in the<br />
Bibliography.<br />
The information providers include:<br />
‣ <strong>Niagara</strong> <strong>Peninsula</strong> <strong>Conservation</strong> Authority (NPCA)<br />
‣ Town of <strong>Fort</strong> <strong>Erie</strong><br />
‣ Ministry of Natural Resources (MNR)<br />
‣ Regional Municipality of <strong>Niagara</strong><br />
‣ Ministry of the Environment (MOE)<br />
‣ Department of Fisheries and Oceans (DFO)<br />
‣ Friends of <strong>Fort</strong> <strong>Erie</strong> <strong>Creeks</strong><br />
‣ Atmosphere Environment Service, Environment Canada<br />
‣ Water Survey of Canada<br />
‣ Ontario Power Generation (OPG)<br />
The NPCA, through an agreement with the Region, provided 1:2000 digital base mapping (based<br />
on 2002 aerial photography) for the study area.<br />
The Study Team has examined the study area in greater detail, and has compiled a watershed<br />
characterization. Detailed field investigations were conducted from September 2005 through to<br />
November 2006, related to the physical environment. Specific areas of study included:<br />
− hydrogeology − aquatic resources<br />
− hydrology − terrestrial resources<br />
− hydraulics − water quality<br />
− floodplain mapping − shorelines<br />
− stream morphology<br />
Detailed information, including the field data and analytic procedures associated with the field<br />
investigations is documented in the three Sub-Technical Appendices (Watercourse Systems,<br />
Stormwater Management, and Natural Heritage System).<br />
Importance:<br />
2.1 Hydrogeology<br />
The groundwater flow system, through recharge and discharge, maintains storage and transmittal<br />
of groundwater for:<br />
• Domestic water supplies<br />
• Terrestrial and aquatic resources<br />
March 2008 4 <strong>Fort</strong> <strong>Erie</strong> <strong>Creeks</strong> <strong>Watershed</strong> <strong>Plan</strong><br />
General Report (105116)
2.1.1 Background Information Collection<br />
The main sources of information relevant to the hydrogeologic understanding of the study area<br />
have been reviewed from the following documents:<br />
• <strong>Niagara</strong> Water Quality Protection Strategy (2003)<br />
• <strong>Niagara</strong> <strong>Peninsula</strong> <strong>Conservation</strong> Authority Groundwater Study (Waterloo<br />
Hydrogeologic Inc., 2005).<br />
• Water Resources of the <strong>Niagara</strong> Frontier and the Welland River Drainage Basin<br />
(Gartner Lee Limited, 1987)<br />
• The Physiography of Southern Ontario (Chapman and Putnam, 1984)<br />
• Flint, J.J., and Lolcama, J., 1985. Buried ancestral drainage between Lake <strong>Erie</strong><br />
and Ontario. Geological Society of America Bulletin, 97, 75-84.<br />
These studies utilize regional and subwatershed-scale geologic and hydrogeologic data with<br />
accompanying maps and discussion, including but not limited to:<br />
• Quaternary geology<br />
• Bedrock geology<br />
• Bedrock topography<br />
• Overburden thickness<br />
• Water table surface<br />
• Potentiometric surface<br />
• Specific capacities of wells<br />
• Shallow intrinsic susceptibility<br />
2.1.2 Work Activities<br />
The following was proposed for potential field work activities:<br />
“It is not anticipated that field studies are within the current scope of this study. It is expected<br />
that this study will direct the need for, and the types of more localized field work. If specific<br />
issues do arise during the course of this study potentially related to groundwater discharge and<br />
baseflow then field techniques involving spot baseflow measurements, the installation of<br />
streambed piezometers and water quality sampling may be warranted.”<br />
The groundwater assessment relating to groundwater discharge was to rely to a greater extent on<br />
information from the aquatic and terrestrial components for potential zones of groundwater<br />
discharge.<br />
Various stream reaches were inspected for groundwater discharge. Site reconnaissance was<br />
carried out on four occasions in 2005 and 2006 approximately a week subsequent to snow melt<br />
or precipitation runoff events. Areas inspected by the hydrogeologist included the upper reaches<br />
of Black Creek, the upper and middle reaches of Beaver Creek, Frenchman’s Creek and Miller<br />
Creek; various reaches of Six Mile Creek, Bertie Bay Drain and Kraft Creek. Reaches were<br />
generally inspected at road crossings with a greater focus on areas of more permeable surficial<br />
March 2008 5 <strong>Fort</strong> <strong>Erie</strong> <strong>Creeks</strong> <strong>Watershed</strong> <strong>Plan</strong><br />
General Report (105116)
sediment and topographic breaks. In addition, the field reconnaissance of the fisheries<br />
component was to note any potential areas for groundwater discharge.<br />
Physiography<br />
2.1.3 Findings/Constraint Identification<br />
Chapman and Putnam, 1984 went so far as to say ‘..that the south eastern part of the <strong>Niagara</strong><br />
<strong>Peninsula</strong>, might almost be considered as a separate sub-region, characterized by levelness and<br />
poor drainage.’ This includes the <strong>Fort</strong> <strong>Erie</strong> study area and gives rise to the very subtle<br />
groundwater flow features which will be described later.<br />
One of the major features of note within the study area is the Onondaga Escarpment which is<br />
shown on the Surficial Geology map (Figure 2). The Paleozoic bedrock dips in a north to south<br />
direction from the <strong>Niagara</strong> Escarpment towards and underneath Lake <strong>Erie</strong>. A portion of the<br />
conceptual hydrogeologic cross-section prepared by Gartner Lee, 1987 is presented in Figure 4.<br />
This north-south trending cross-section extends from St Catharines to the north to Port Colborne<br />
to the south approximately 5 km west of the western portion of the study area. The conceptual<br />
cross section shows the bedrock formations and the dipping trends. The hard limestone caprock<br />
of the Onondaga Escarpment is more resistant then the underlying shale units to the north and, as<br />
such, a bedrock trough has been eroded between the Onondaga Escarpment and the <strong>Niagara</strong><br />
Escarpment. This trough has been filled to varying depths with alternating units of silt and clay<br />
resulting from previous episodes of glaciation and deglaciation and is designated in the more<br />
regional extent as the Haldimand Clay Plain. The southern extent of this clay plain consists of<br />
the thicker deposits of fined grained material in the north part of the study area and a thin veneer<br />
of sediment over a large portion of the bedrock plain of the Onondaga Escarpment to the south.<br />
Beach deposits associated with glacial Lake Warren can be found in the vicinity of Ridgeway<br />
and Ridgemount. Additional features include the subtle ridges associated with the <strong>Fort</strong> <strong>Erie</strong><br />
Moraine and the Crystal Beach Moraine. The relief associated with the Onondaga Escarpment<br />
ranges from a high of approximately 200 metres above sea level (masl) at Ridgemount to<br />
175 masl at the Lake <strong>Erie</strong> shoreline. The Onondaga Escarpment provides enough relief to affect<br />
the south eastern surface water divide for Beaver Creek. These characteristics are also evident in<br />
the NPCA Groundwater Study <strong>Fort</strong> <strong>Erie</strong> cross-section (Figure 4a).<br />
Bedrock Geology<br />
The lower-most or oldest bedrock unit in the study area is the Salina Formation which can be<br />
found in the northern part of the study area (Figure 3 Unit 5) this unit consists of dolostone and<br />
shale with significant amounts of evaporites (i.e. gypsum, salt). This unit is up to 90 m thick.<br />
Moving southward the resistant shaley dolostone of the Bertie Formation (Unit 6) overlies the<br />
Salina and provides the erosion contrast to form the Onondaga Escarpment. This unit is on the<br />
order of 10 m thick.<br />
Along the brow of the escarpment the Bois Blanc Formation (Unit 7) is approximately 4 m thick<br />
and is composed of fossiliferous cherty limestone with some shale and sandstone layers.<br />
March 2008 6 <strong>Fort</strong> <strong>Erie</strong> <strong>Creeks</strong> <strong>Watershed</strong> <strong>Plan</strong><br />
General Report (105116)
The southern-most unit to the Lake <strong>Erie</strong> shoreline is the Onondaga Formation (Unit 8) consisting<br />
of fossiliferous cherty limestone. This unit can be on the order of 15 m thick.<br />
The bedrock topography is presented on Figure 3, as well as in the NPCA Groundwater Study.<br />
Figure 3a, was enlarged from a more regional bedrock surface that was presented in Flint and<br />
Lolcama, 1985. This shows the bedrock surface in the study area and was chosen because it<br />
utilizes more data points and was field verified and interpreted to an extent by the authors. The<br />
Onondaga Escarpment is readily seen within the bedrock surface with the bedrock dipping south<br />
towards Lake <strong>Erie</strong>. The Crystal Beach paleo-drainage channel is outlined on the bedrock surface.<br />
This represents paleo-drainage from Lake <strong>Erie</strong> to Lake Ontario. The authors interpret the closed<br />
bedrock depression below the escarpment as the possible remains of a plunge pool. This<br />
depression also correlates with the thickest deposit of overburden within the study area. The<br />
bedrock topography also shows the lower elevations of the erosional trough, as described in the<br />
physiography discussion, within the northern part of the study area. Figure 4 demonstrates the<br />
general north south bedrock trend and the erosional bedrock trough previously described.<br />
The drift thickness varies from slightly greater than 30 m at the depressional bedrock low to zero<br />
at the various bedrock outcrops (Figure 2). The drift thickness is presented in Figure 5.<br />
Quaternary Geology<br />
An excellent summary of the Quaternary stratigraphy is provided by Gartner Lee 1987 and is<br />
edited from the report and presented below.<br />
A major ice advance covered the <strong>Niagara</strong> <strong>Peninsula</strong> approximately 22,000 to 14,000 years ago,<br />
during Late Wisconsinan time. This advance laid down the ground moraine characterized by the<br />
lower (Wentworth) till and associated sediments. As the ice retreated from the <strong>Peninsula</strong> into the<br />
Lake Ontario basin meltwater formed a large proglacial lake. The lower glaciolacustrine unit was<br />
deposited in this lake, covering the Wentworth Till.<br />
The ice re-advanced out of the Lake Ontario basin approximately 13,000 years ago. It moved<br />
south-westward into the proglacial lake, covered most of the <strong>Niagara</strong> <strong>Peninsula</strong>, and deposited<br />
the Halton Till as ground and end moraines (<strong>Fort</strong> <strong>Erie</strong> Moraine and Crystal Beach Moraine). The<br />
ice then retreated northward and a series of proglacial lakes were re-established from the<br />
meltwater in the area resulting in the upper glaciolacustrine unit and various small shoreline<br />
features includes glaciolacustrine beach nearshore sand and gravel, and glaciolacustrine<br />
nearshore and deltaic sand and silt (ref. Figure 2).<br />
Subsequent to the drainage of proglacial Lake Warren modern coastal dune sand and beach sand<br />
and gravel have been deposited along the Lake <strong>Erie</strong> shoreline. Bog deposits can be found<br />
particularly around Point Abino and modern alluvium can be found within a variety of the creek<br />
corridors particularly Beaver Creek.<br />
The lower Wentworth Till is a dense silt to sand silt till with some sand inclusions. Locally there<br />
may be a significant component of gravel which was likely derived from the bedrock. Locally<br />
and definitely more regionally the bedrock/till contact can contain a discrete layer of granular<br />
sand and gravel. The extent of this deposit is usually limited.<br />
March 2008 7 <strong>Fort</strong> <strong>Erie</strong> <strong>Creeks</strong> <strong>Watershed</strong> <strong>Plan</strong><br />
General Report (105116)
The make up of the Halton Till and lower and upper glaciolacustrine units is a relatively<br />
consistent mixture of clayey silt to silty clay.<br />
Conceptual Groundwater Flow System<br />
Hydrogeology is the study of the movement of water through the ground and the interaction of<br />
this groundwater with surface water. It is important to understand the inter-relationship between<br />
the hydrogeologic conditions and the subwatershed ecosystem in order to assess and develop<br />
targets and controls for potential land use changes.<br />
It is important to understand how hydrogeologic conditions influence the water movement and<br />
the hydrologic cycle. Water from precipitation percolates or infiltrates into the ground until it<br />
reaches the water table. Areas where water moves downward from the water table are known as<br />
recharge areas. These areas are generally in areas of topographically high relief. Areas where<br />
groundwater moves upward to the water table are known as discharge areas. These generally<br />
occur in areas of topographically low relief, such as stream valleys. Groundwater that discharges<br />
to streams is the water that maintains the baseflow of the stream. Wetlands are often fed by<br />
groundwater discharge.<br />
There are different types and rates of recharge and discharge. Water percolating into the ground<br />
at a specific location may discharge to a small stream a short distance away. This is local<br />
recharge and local discharge. Some water may recharge a certain area and discharge to a larger<br />
river basin a long way from the source of recharge. This is known as regional recharge and<br />
regional discharge.<br />
Permeable geologic materials through which groundwater moves are known as aquifers.<br />
Aquifers are "water bearing" formations meaning that water can be easily extracted from these<br />
units. Within the study area the major aquifer(s) occur within the bedrock units. Water is<br />
transmitted by bedding planes, joints, fractures and dissolution channels. The weathered<br />
component of the surficial bedrock is much more fractured and generally quite permeable. The<br />
permeability within the bedrock units can be quite variable over relatively small distances. Areas<br />
of sand and gravel act as more local aquifers and these occur primarily along the Lake <strong>Erie</strong><br />
shoreline and to a limited extent within some of the glaciolacustrine sand and gravel deposits.<br />
How these aquifers are connected within a hydrogeologic setting is what controls much of the<br />
movement of groundwater. The less permeable units are known as aquitards, and although water<br />
can move through these units, it moves slowly and it is difficult to extract water from these units.<br />
The clayey silt and silty clay composition of the till units and glaciolacustrine lake bottom layers<br />
will act as aquitards.<br />
Within the study area much of the surficial overburden consists of clay material, which typically<br />
is of a low permeability, that is, it does not transmit water readily. The horizontal component of<br />
groundwater flow, particularly within the overburden, will be weak due to low permeability of the<br />
silt/clay sediments. Fracturing within these types of clay deposits is known to occur to depths of<br />
8-10 metres and likely allows for more infiltration and movement of groundwater vertically. The<br />
horizontal hydraulic connection of the clay fractures is variable with a more hydraulically active<br />
zone in the top 2-3 metres.<br />
March 2008 8 <strong>Fort</strong> <strong>Erie</strong> <strong>Creeks</strong> <strong>Watershed</strong> <strong>Plan</strong><br />
General Report (105116)
Groundwater flow is expected to be greater in the upper fracture bedrock and where there is contact<br />
to overlying permeable sand and gravel lenses due to the contrast between the higher permeability<br />
of this unit and the lower permeability of the overlying silt/clay unit and the underlying more<br />
competent bedrock units. Groundwater is usually directed more locally to the stream reaches that<br />
are in contact with the bedrock and more permeable alluvial sediments.<br />
It cannot always be assumed that groundwater discharges to all wetlands. A large percentage of<br />
the wetlands are perennial or intermittent recharge areas and as such provide a significant linkage<br />
to groundwater particularly in the form of filtering out contaminants in the surface water entering<br />
them prior to the water infiltrating into the groundwater flow system. It cannot also be assumed<br />
that because of the predominance of clay that minor groundwater flow in the upper fractured clay<br />
does not provide local linkages. It is noted that there is an intricate pattern of countless small,<br />
shallow sloughs or seasonal pools connected by swales, resulting in complexes of swamp forest<br />
sloughs within a network of slightly drier forest. Minor horizontal groundwater flow through the<br />
shallow fractures in the clay may provide some level of local functional linkage.<br />
The overburden and bedrock potentiometric (water level) maps presented in both the NPCA<br />
Groundwater Study and the Water Resources of the <strong>Niagara</strong> Frontier and the Welland River<br />
Drainage Basin study demonstrate only slight hydraulic gradients to the north and south and are<br />
a more subtle reflection of the surficial and bedrock topography. This lack of gradient also<br />
reflects the relatively lower permeability of the majority of surficial sediments. The Overburden<br />
Potentiometric Surface and Bedrock Potentiometric Surface can be found in Figures 6 and 7 as<br />
revised maps from Gartner Lee Limited, 1987.<br />
The water level data utilized to construct overburden and bedrock potentiometric surfaces is<br />
primarily derived from the MOE water well database. Bedrock and overburden wells in and around<br />
the study area are shown in Figure 5a. The predominance of bedrock wells reflects the low potential<br />
to develop water supplies in the low permeability overburden. It is important to note the relative<br />
spatial and temporal limitations of the water well data. Spatially there a relatively small number of<br />
wells particularly in the northwest portion of the study area. Interpolation of water levels from point<br />
to point can be rather misleading and any subsequent use of the water level maps (i.e. Groundwater<br />
Discharge, Upward Gradients) can be limited. In a temporal sense the water level data reflects static<br />
levels at the time of the well installation and is not therefore a snap shop of water levels. Generally<br />
these data are useful within an averaging context but given the lack of hydraulic gradient and in<br />
some cases the lack of spatial data determination of specific groundwater flow directions,<br />
particularly within the intermediate and local scale flow systems, cannot be quantified. A<br />
dedicated groundwater monitoring well has been installed in the study area by the NPCA for the<br />
Provincial Groundwater Monitoring Network. This shallow bedrock well was installed by Jagger<br />
Hims Limited in 2003 within the upper Onondaga Formation at the corner of Hollow Bay Road<br />
North and Old Garrison Road. Details of the well installation, a local hydrogeologic cross-section,<br />
water level and water quality data are provided in Appendix ‘SW-D’. The water level hydrograph<br />
shows seasonal variations of up to two metres. It can be seen that the lowest water levels occur later<br />
on in the summer with recovery through the fall and early winter. The two metre seasonal variation<br />
would be greater than the majority of hydraulic gradients within the local to intermediate flow<br />
system setting.<br />
March 2008 9 <strong>Fort</strong> <strong>Erie</strong> <strong>Creeks</strong> <strong>Watershed</strong> <strong>Plan</strong><br />
General Report (105116)
Any modest level of additional groundwater level data at a regional scale will not greatly add to the<br />
potentiometric surfaces but this does not preclude utilizing data from future site specific studies<br />
(Appendix ‘SW-E’) in refining the larger picture.<br />
The general direction of horizontal groundwater flow within the shallow overburden/bedrock<br />
system will be north from the Onondaga Escarpment and then generally to the east and northeast.<br />
There may be more local components following the bedrock topography to the west and along the<br />
Crystal Beach paleo-drainage channel. Groundwater flow will also move to the south from the<br />
Onondaga Escarpment to the Lake <strong>Erie</strong> shoreline (Figure 7).<br />
One can generally provide additional detail on potential groundwater flow systems by noting where<br />
significant groundwater discharge occurs. Field investigations for both the hydrogeologic<br />
component and the aquatic component were extensive and only turned up areas of more diffuse<br />
groundwater discharge in which flow could not be quantified. These areas coincided with the lower<br />
parts of the Onondaga Escarpment and the contact between the surficial sand units and the clays or<br />
at topographic breaks within the surficial sand units. Anecdotal reports of “quick conditions” at a<br />
building site at Thunder Bay Road and Prospect Point Road suggest strong upward hydraulic<br />
gradients within the surficial sands, possibly driven by the local bedrock topography. Groundwater<br />
discharge was also noted at Dominion Road in the Buffalo Heights area. This area corresponds to<br />
local bedrock outcrops and the water is likely locally derived recharge in the surficial bedrock. The<br />
NPCA Groundwater Study presented areas of Potential Groundwater Discharge (Appendix<br />
‘SW-D’) by comparing water table elevations to the ground surface. Areas where the water table<br />
intersects a surficial geology unit that is more permeable, such as sand, bedrock outcrops or very<br />
thin clay overburden (2-3 metres), are more likely to result in potential discharge.<br />
Infiltration rates, which have a direct relation to recharge to the water table, are governed to a<br />
large extent by the surficial geology and associated permeability. Other factors include<br />
vegetative cover, topography, spatial and temporal distribution of precipitation events and<br />
temperature. Another factor, which can influence the infiltration potential, is the extent of<br />
fracturing within the overburden. When the overburden has significant clay content fracturing<br />
may occur particularly in the zone where the media has been exposed to unsaturated conditions.<br />
The extent of fracturing can be dependent on the thickness of the surficial clay layer and the<br />
permeability of the underlying layer. In the study area the underlying bedrocks is generally more<br />
permeable in the upper zone as a result of more extensive fracturing. This can lead to a<br />
preferential under-draining of the overburden and the potential for enhanced fracturing in the<br />
Halton Till/glaciolacustrine clay. Areas of sand and gravel, exposed bedrock (Figure 2) and thin<br />
overburden will also provide for the more significant local recharge zones within the study area.<br />
These areas coincide quite well the Potential Groundwater Recharge Map in the NPCA<br />
Groundwater Study.<br />
Ranges of hydraulic conductivities of the various hydrostratigraphic units were summarized by<br />
Gartner Lee Limited, 1987 and are provided in Appendix ‘SW-D’.<br />
Groundwater Quantity and Quality<br />
Groundwater is utilized for domestic consumption through private wells within the more rural parts<br />
of the study area. The majority of the private domestic wells are drilled into the bedrock units<br />
(Figure 5a). Private drilled wells are also installed in the more permeable sand and gravel<br />
March 2008 10 <strong>Fort</strong> <strong>Erie</strong> <strong>Creeks</strong> <strong>Watershed</strong> <strong>Plan</strong><br />
General Report (105116)
overburden and a small number of large diameter dug wells are constructed within the fracture clay<br />
overburden. A survey of the water well database to investigate individual water well depths was no<br />
within the scope of this study. The greatest well capacities are in the bedrock wells but most wells<br />
provide sufficient water for domestic purposes. The capacities of the domestic wells are noted in the<br />
NPCA Groundwater Study to be less than 25m 3 /day/m.<br />
The natural quality of water is dependent on chemical make up of the geologic unit and the<br />
residence time of the water within that unit. The water quality within the shallow overburden is<br />
typically high in major ions due to the dissolution minerals available to infiltrating groundwater<br />
within the weathered clay. As water moves deeper into the overburden there is a significant<br />
reduction in dissolved minerals due to diffusion processes and mixing with better quality water.<br />
Natural groundwater quality within the surficial permeable sand and gravel units is expected to be<br />
relatively fresh as there is less material available for mineral dissolution. The bedrock water quality<br />
is quite variable and can be highly mineralized in the bedrock formations that contain evaporites.<br />
High levels of sulphate are quite common in the bedrock wells within the study area. Bedrock water<br />
quality in the upper Onondaga Unit is presented in Appendix ‘SW-D’. The chemical results indicate<br />
slightly mineralized water.<br />
Contaminant Susceptibility<br />
With a delineation of the groundwater flow system which identifies where groundwater<br />
originates, where it discharges and the most prominent paths it travels one can assess the relative<br />
sensitivity of the aquifer(s) and the subsequent linkage from the groundwater system to the<br />
aquatic or terrestrial systems. Knowing the level of sensitivity of the receptor one can determine<br />
the impacts of particular types and scales of land uses or land use changes on the groundwater<br />
flow system and other linked ecosystem components.<br />
By considering the permeability and thickness of hydrogeologic layers which may contact streams,<br />
wetlands or be the source of water for local domestic wells, one can provide a qualitative<br />
assessment of the groundwater flow system sensitivity. Within the study area these more sensitive<br />
localized areas are a result of local sand and gravel deposits, outcrops of bedrock, thin fractured<br />
surficial overburden clay (less than 10 metres) and the more recently deposited surficial sands and<br />
gravels associated with the Lake <strong>Erie</strong> shoreline. Both the NPCA Groundwater Study and the Water<br />
Resources of the <strong>Niagara</strong> Frontier and the Welland River Drainage Basin study provide<br />
contaminant susceptibility maps. Within the current mapping the Surficial Geology Map,<br />
Figure 2 and Overburden Thickness Figure 5 provides characteristics for the areas of greatest<br />
susceptibility. Permeability and overburden thickness are major criteria in the development of<br />
the NPCA Groundwater Study Shallow Intrinsic Susceptibility map (Figure 7a). A substantial<br />
portion of the southern part of the study area is considered more susceptible due to sand, exposed<br />
bedrock and thinner overburden. Alternatively underlying aquifers can be protected from<br />
surficial contaminants by thick sequences of less permeable clay and silt or upwards hydraulic<br />
gradients. The NPCA Groundwater Study Upward Gradient map can be found in<br />
Appendix ‘SW-D’.<br />
Discussions with the Region of <strong>Niagara</strong> and data requests from the Technical Steering Committee<br />
did not provide for any studies or available data indicating local water quality problems relating to<br />
private septic systems and shallow wells or any other significant water quality problems but the<br />
March 2008 11 <strong>Fort</strong> <strong>Erie</strong> <strong>Creeks</strong> <strong>Watershed</strong> <strong>Plan</strong><br />
General Report (105116)
NPCA Groundwater Study did delineate an area in the southern part of Six Mile Creek and Bertie<br />
Bay Drains that are considered septic system problem areas.<br />
2.1.4 Summary of Significant Features/Constraints<br />
The majority of the study area is covered by relatively low permeability silt/clay overburden<br />
which will reduce infiltration but offer protection for contaminant migration to the lower bedrock<br />
aquifer.<br />
Areas of thin fractured overburden, bedrock outcrops and surficial sand and gravel provide for<br />
greater infiltration but are more susceptible to contamination<br />
The shallow fractured overburden provides recharge, although limited, which can be locally<br />
significant for baseflow or wetlands. Reworking the silt clay or till may reduce recharge. Efforts<br />
should be made to emulate or enhance the quality and quantity of recharge on local or sitespecific<br />
basis.<br />
Infiltration facilities for storm water management will not be effective through a majority of the<br />
study area.<br />
The main aquifer(s) for private domestic wells are the limestone and dolostone bedrock units,<br />
which generally provide good quantity but poor quality of water. The limited surficial sand and<br />
gravel deposits are utilized for local domestic wells. Large diameter wells do exist within the<br />
clay silt till units.<br />
The Onondaga Escarpment provides the relief for a subtle groundwater divide which directs<br />
groundwater flow in both the overburden and bedrock to the north and south.<br />
Bringing water from outside subcatchment areas or the subwatershed can increase local recharge<br />
and potential baseflow (i.e. lake based domestic water supply).<br />
Locations of services can short-circuit groundwater flow through the permeable underfill and<br />
may modify local groundwater flow systems. Opportunities exist to potentially enhance<br />
baseflow, however care must be taken not to intercept existing springs or local discharge.<br />
Importance:<br />
2.2 Hydrology<br />
Hydrologic processes are integral to many of the natural functions and features within the<br />
subwatershed. Significant alterations to the hydrologic response within a subwatershed may<br />
increase flood potential, reduce baseflows, and alter channel-forming processes. It is therefore<br />
imperative that hydrologic processes be maintained in order to preserve existing resources.<br />
2.2.1 Background Information Collection<br />
The following is a list of the background reports reviewed for the <strong>Watershed</strong> <strong>Plan</strong>. A brief<br />
review of each report has been included in the Stormwater Management Technical Appendix.<br />
March 2008 12 <strong>Fort</strong> <strong>Erie</strong> <strong>Creeks</strong> <strong>Watershed</strong> <strong>Plan</strong><br />
General Report (105116)
• Floodplain Mapping Frenchman’s Creek, <strong>Fort</strong> <strong>Erie</strong>, <strong>Niagara</strong> <strong>Peninsula</strong> <strong>Conservation</strong><br />
Authority, May 2004.<br />
• <strong>Niagara</strong> Water Quality Protection Strategy, Philips Engineering Ltd, CH2MHILL,<br />
MacViro Consultants, October 2003.<br />
• Spears and High Pointe Neighbourhoods Master Servicing <strong>Plan</strong>, Earth Tech Canada Inc.<br />
December 2002<br />
• Pollution Prevention and Control Program: Progress Report, Town of <strong>Fort</strong> <strong>Erie</strong>,<br />
September 2002<br />
• Shoreline Management <strong>Plan</strong>, Lake <strong>Erie</strong> Shoreline, Philpott Associates Coastal Engineers<br />
Ltd. June 1992<br />
• Town of <strong>Fort</strong> <strong>Erie</strong>, Sanitary Sewer System Master <strong>Plan</strong> Update, Totten Sims Hubicki<br />
Associates, June 1999<br />
• Joint Evaluation of Upstream/Downstream, <strong>Niagara</strong> River Data 1996-97, March 1999<br />
• Town of <strong>Fort</strong> <strong>Erie</strong> Storm Drainage Master <strong>Plan</strong> Update, Kerry T. Howe Engineering<br />
Limited, 1999<br />
• Willoughby Marsh Project - Phase 1: background Report DRAFT. Contributors: Great<br />
Lakes Clean up Fund, NPCA, OMNR, Friends of <strong>Fort</strong> <strong>Erie</strong> <strong>Creeks</strong>, Ontario Hydro,<br />
Regional Municipality of <strong>Niagara</strong>, MOEE, 1996<br />
• Town of <strong>Fort</strong> <strong>Erie</strong> Storm Drainage Master <strong>Plan</strong>, Kerry T. Howe Engineering Limited,<br />
1994<br />
• Town of <strong>Fort</strong> <strong>Erie</strong> Technical Appendix. Master Storm Drainage <strong>Plan</strong> Guidelines, Kerry<br />
T. Howe Engineering Limited, 1993<br />
• <strong>Watershed</strong> Hydrology Study, Volumes 1-4, Marshall Macklin Monaghan Limited,<br />
December 1989.<br />
In addition to the above reports, a large amount of mapping data has been supplied by the NPCA.<br />
The mapping has been checked against the other sources, e.g. the Regional Municipality of<br />
<strong>Niagara</strong>’s NWQPS mapping that was produced in 2003. A comparison of the watershed<br />
boundary layers has been undertaken, and the differences have been resolved through this study,<br />
with the use of the 1 m contour DEM and through field verification.<br />
The Town of <strong>Fort</strong> <strong>Erie</strong> has provided mapping of the Municipal Drains, as well as storm and<br />
sanitary sewer mapping.<br />
A combination of digital and paper copies of the drainage areas has been received by the Town.<br />
It is noted that the Town records remain the standard for each of the various drains and<br />
watercourses. One example is the Kraft Drain, which has an officially delineated drainage<br />
March 2008 13 <strong>Fort</strong> <strong>Erie</strong> <strong>Creeks</strong> <strong>Watershed</strong> <strong>Plan</strong><br />
General Report (105116)
oundary under the Drainage Act. There are however, potential spills during extreme events that<br />
have been documented in separate drainage studies.<br />
Digital Data<br />
• OBM mapping (MNR)<br />
• NPCA <strong>Watershed</strong> boundary mapping, and subcatchment boundaries<br />
• Local Management Area mapping (NWQPS 2003)<br />
• Stormwater management facilities and flooding and erosion sites (NWQPS, 2003)<br />
• Aerial Photography (Region 2002)<br />
• Land use (Town of <strong>Fort</strong> <strong>Erie</strong> Official <strong>Plan</strong>)<br />
• Municipal Drains and tile drain mapping (Town of <strong>Fort</strong> <strong>Erie</strong>)<br />
• Black, Beaver, and Frenchman’s <strong>Creeks</strong> 100 year Regulatory Floodlines (NPCA)<br />
Soils Mapping<br />
The Soils of The Regional Municipality of <strong>Niagara</strong> (1:25,000 mapping), Ministry of Agriculture<br />
and Food, 1989.<br />
Flow Data<br />
Limited flow data is available for the flow gauge in Black Creek at Stevensville. Monthly flow<br />
record files show hourly data for the period between 1991 and 1994, for some of the months.<br />
Rainfall Data<br />
Two meteorological stations have been identified by the Region for their proximity to<br />
Stevensville: one in <strong>Fort</strong> <strong>Erie</strong> (industrial park) and one in Welland (Sewage Treatment <strong>Plan</strong>t). A<br />
comparison of this rainfall data was made with the Environment Canada gauge data<br />
(EC6132470). The Region’s data covered a comparable length of time, and offered greater<br />
spatial coverage of the study area.<br />
2.2.2 Work Activities<br />
Compilation of background information and review of available historical streamflow and<br />
rainfall data has been conducted. Three meetings were held with the Town of <strong>Fort</strong> <strong>Erie</strong> drainage<br />
superintendent and engineering staff. A full field survey of all of the watercourse crossings has<br />
been completed, with the culvert information documented in Appendices ‘WS-E’ and ‘WS-F’.<br />
The majority of the work has focused on the creation the subwatershed hydrologic models, and<br />
the subsequent calibration of the Black Creek model for use in verifying flow response in the<br />
other systems.<br />
Hydrologic Model Development<br />
The hydrologic model SWMHYMO has been selected for use in this study due to its wide-spread<br />
application for both urban and rural land uses. SWMHYMO is an event-based model for which<br />
both historical and design storms can be used to generate runoff response (peaks and volumes) to<br />
rainfall. Additionally, observed rainfall events can be used for model calibration.<br />
March 2008 14 <strong>Fort</strong> <strong>Erie</strong> <strong>Creeks</strong> <strong>Watershed</strong> <strong>Plan</strong><br />
General Report (105116)
Two hydrograph algorithms have been used in the watershed model: CALIB NASHYD has been<br />
used for the rural subcatchments and CALIB STANDHYD has been used for the urban<br />
subcatchments. Any subcatchment with an impervious coverage of less than 10 % has been<br />
considered to be rural, and a subcatchment with an impervious coverage of greater than 10 % has<br />
been assumed to be urban. The existing land use model parameters are listed in Table 2.2.4.<br />
The hydrologic routing, (i.e. routing of flows through creeks and reaches), has been modeled<br />
using the ROUTE CHANNEL algorithm. This algorithm requires a typical cross-section, which<br />
represents the channel and floodplain of each reach. A total of 17 typical sections have been<br />
determined based on the digital topographic mapping and applied over similar reaches<br />
throughout the study area.<br />
Subwatershed Delineation and Parameterization<br />
Previous studies that defined the watershed boundaries and municipal drains have been used as<br />
the starting point for the delineation of the subwatersheds (e.g. the Marshall Macklin Monaghan<br />
NPCA <strong>Watershed</strong> Study in 1986, which used the MNR 1:10,000 OBM for base mapping).<br />
All watershed boundaries provided by the Town were developed by Drainage Engineers and<br />
adopted by Town By-law, and therefore can only be changed using the process stipulated under<br />
the Drainage Act.<br />
For this study, the updated digital base mapping (Region, 2002), with 0.5 m contours, has been<br />
used to delineate the subwatersheds. Sixteen subwatersheds have been identified within the<br />
study area (ref. Table 2.2.1). The total drainage area of the <strong>Fort</strong> <strong>Erie</strong> <strong>Creeks</strong> varies from 7 ha to<br />
10656 ha. Within each watershed there are subwatersheds of smaller size. The subwatershed<br />
boundaries have been shown in Figure 8 and the schematics of subwatersheds are shown in<br />
Figure 9.<br />
TABLE 2.2.1:<br />
STUDY AREA SUBWATERSHEDS<br />
<strong>Watershed</strong> Name Drainage Area (ha) <strong>Watershed</strong> Name Drainage Area (ha)<br />
Black Creek<br />
(Confluence with Beaver Creek)<br />
6374 <strong>Fort</strong> <strong>Erie</strong> (urban Area) 397<br />
Beaver Creek<br />
(Confluence with Black Creek)<br />
3777 Lakeshore (urban Area) 364<br />
(Black Creek at Outlet) 10656 <strong>Niagara</strong> River # 16 87<br />
Six Mile Creek 1805 <strong>Niagara</strong> River # 19 159<br />
Frenchman’s Creek 1640 <strong>Niagara</strong> River # 20 7<br />
Miller Creek 901 <strong>Niagara</strong> River # 21 36<br />
Baker Creek 431 <strong>Niagara</strong> River # 22 60<br />
Bertie Bay Drains 826 Lake <strong>Erie</strong> #1 41<br />
Kraft Drain 555<br />
The Frenchman’s Creek hydrologic model has not been updated as part of this study since the<br />
NPCA developed the hydrology and updated the floodplain mapping of the creek in May 2004.<br />
The previously defined Frenchman’s Creek watershed boundary has been used as part of the<br />
watershed delineation results of this study.<br />
March 2008 15 <strong>Fort</strong> <strong>Erie</strong> <strong>Creeks</strong> <strong>Watershed</strong> <strong>Plan</strong><br />
General Report (105116)
The majority of the urban areas of the Town of <strong>Fort</strong> <strong>Erie</strong> drain to Lake <strong>Erie</strong> and the <strong>Niagara</strong><br />
River via numerous outlets. For the purpose of this study, the urban area has been “lumped” into<br />
subwatersheds according to their location. The urban area draining to the Lake <strong>Erie</strong> has been<br />
delineated with two subwatersheds: namely <strong>Fort</strong> <strong>Erie</strong> and Lakeshore, divided by the QEW.<br />
Similarly, the <strong>Niagara</strong> River subwatersheds #16, 19, 20, 21, and 22 are small urban<br />
subwatersheds along the <strong>Niagara</strong> River, which drain directly or indirectly to the river.<br />
Of the sixteen study subwatersheds, five subwatersheds drain to Lake <strong>Erie</strong>, namely: Six Mile<br />
Creek, Bertie Bay Drains, Kraft Drain, Lakeshore and Lake <strong>Erie</strong>-1; while the rest of the<br />
subwatersheds drain to the <strong>Niagara</strong> River.<br />
Physiographic Data and Land Use<br />
Overall, the topography of the land is relatively flat with average overland slopes of less than<br />
1%. The floodplains slope towards the creeks are generally relatively steep, that is greater than<br />
3%, towards the creeks, along major creek tributaries.<br />
The hydrologic parameter “length of flow” has been estimated between the most remote areas of<br />
a subwatershed to the outlet of each watershed. Accordingly, the overland slope has been<br />
estimated. A database of all watersheds and subwatersheds has been prepared (ref.<br />
Appendix ‘SW-A’).<br />
The parameter ‘time to peak’ has been estimated for all rural subwatersheds based on<br />
subwatershed data using the following relationship (ref: HYMO User’s Manual, USDA,<br />
May 1973, calculations are included in Appendix ‘SW-A’):<br />
T p<br />
=<br />
0.133<br />
0.422 −0.46<br />
⎛ L ⎞<br />
0.0086<br />
⎟<br />
⎠<br />
Tp = Time to Peak (hr)<br />
A = Total Basin Area, (ha)<br />
S = Slope, (m/m)<br />
L = Overland Flow Length, (m)<br />
W = A / L, (m)<br />
A<br />
⎜<br />
⎝W<br />
Where,<br />
The STANDHYD command requires the parameter “directly connected imperviousness” for<br />
each urban subcatchment, which is the measure of the impervious area that is directly connected<br />
to the outlet, (e.g. the storm sewer network). Considering the nature of the urban area, with<br />
roadside swales and areas where the overall imperviousness is 30%, only 10 % of the impervious<br />
area would be assumed to be directly connected.<br />
Initial abstraction (I a ) has been estimated using following relation:<br />
S<br />
I a = 0.2 [25.4 ((1000/CN) – 10)] (mm)<br />
March 2008 16 <strong>Fort</strong> <strong>Erie</strong> <strong>Creeks</strong> <strong>Watershed</strong> <strong>Plan</strong><br />
General Report (105116)
The dominant land use in the area is agricultural in nature. There are 14 urban centres within the<br />
study area (Table 2.2.2). The urban centres are concentrated along Lake <strong>Erie</strong> and the <strong>Niagara</strong><br />
River with the exception of Stevensville which is located on the Black Creek.<br />
Urban Centres<br />
Stevensville<br />
Douglastown<br />
Gilmore<br />
Garrison<br />
Walden<br />
<strong>Fort</strong> <strong>Erie</strong><br />
Lakeshore<br />
Bridgeburg<br />
Spears<br />
Kraft<br />
High Pointe<br />
Crescent Park<br />
Thunder Bay<br />
Ridgeway<br />
TABLE 2.2.2:<br />
LOCATION OF URBAN CENTERS<br />
<strong>Watershed</strong><br />
Black Creek<br />
Black Creek<br />
Frenchman’s Creek<br />
Lakeshore<br />
Lakeshore and Kraft Drain<br />
<strong>Fort</strong> <strong>Erie</strong> and Frenchman’s Creek<br />
Lakeshore<br />
<strong>Fort</strong> <strong>Erie</strong><br />
Kraft Drain, Bertie Bay Drains, and Frenchman’s Creek<br />
Kraft Drain<br />
Bertie Bay Drains<br />
Bertie Bay Drains<br />
Six Mile Creek<br />
Beaver Creek and Mann Drain<br />
Portions of the headwaters of the Black Creek are in the City of Port Colborne and City of<br />
<strong>Niagara</strong> Falls (ref. Figure 1). The existing land use data has been compiled from the three<br />
Official <strong>Plan</strong>s from: Town of <strong>Fort</strong> <strong>Erie</strong>, City of <strong>Niagara</strong> Falls and the City of Port Colborne. The<br />
land use mapping, representing existing land use, has been overlaid to the subwatershed plan in<br />
order to derive the land use data for the hydrologic model (ref Figure 2).<br />
Imperviousness for various land uses has been estimated based on municipal drainage criteria<br />
(Storm Drainage Master <strong>Plan</strong>, Town of <strong>Fort</strong> <strong>Erie</strong>, 1999) as shown in Table 2.2.3. The total<br />
imperviousness in each subcatchment has been calculated using the land use mapping.<br />
TABLE 2.2.3:<br />
LAND USE AND RELATED IMPERVIOUSNESS<br />
Land Use Imperviousness % Remarks<br />
Rural Residential 20% 15 m land over frontage<br />
Urban Residential 50% Assumed maximum Imperviousness assigned to Apartments<br />
Commercial & Institutional 70% As defined for Downtown Commercial<br />
Industrial 70% Heavy Industry<br />
Agriculture 0% -<br />
Open (natural, forest, range, wood) 0% -<br />
Rural 10%<br />
That is agricultural activities, agriculture related<br />
commercial / industry, livestock, aggregate extraction,<br />
park, conservation area<br />
Source Table 4.2 Storm Drainage Master <strong>Plan</strong>, Town of <strong>Fort</strong> <strong>Erie</strong>, 1999<br />
Soil Data<br />
The soil data has been provided by the <strong>Niagara</strong> <strong>Peninsula</strong> <strong>Conservation</strong> Authority (NPCA), in a<br />
GIS format. The data is based on the Ministry of Agriculture and Food data from 1989. The data<br />
contains detailed information, including the soil type name, soil texture and related hydrological<br />
March 2008 17 <strong>Fort</strong> <strong>Erie</strong> <strong>Creeks</strong> <strong>Watershed</strong> <strong>Plan</strong><br />
General Report (105116)
groups. A soil map based on the hydrologic group has been prepared (ref. Figure 11). The SCS<br />
Curve Number (CN) values for various land uses are provided in Table 2.2.4. An areallyweighted<br />
CN number has been used to calculate the representative CN in each subcatchment<br />
(ref. Appendix ‘SW-B’):<br />
CN composite =(ΣA i x CN) /ΣA i<br />
TABLE 2.2.4:<br />
CURVE NUMBER (CN) FOR PERVIOUS AREA ACCORDING TO LAND USES TYPE 1.<br />
Land Use<br />
Hydrological Groups<br />
A B C D<br />
Agriculture: Cult. Land with out Contours 62 71 78 81<br />
Forested (Good) 25 55 70 77<br />
Rural 49 69 79 84<br />
Rural Residential 49 69 79 84<br />
Urban Residential 49 69 79 84<br />
Commercial 49 69 79 84<br />
Industrial 49 69 79 84<br />
1. Reflects Antecedent Moisture Condition II<br />
The summary of input data, prepared for the hydrologic simulation (SWMHYMO), has been<br />
summarized in Table 2.2.5.<br />
TABLE 2.2.5:<br />
SUBWATERSHED PHYSICAL PARAMETERS<br />
EXISTING LAND USE<br />
Length of<br />
Area Slope CN II TIMP<br />
<strong>Watershed</strong> / Subcatchment<br />
Flow<br />
Tp Ia<br />
(km 2 ) (%) (%) (m) Hr (mm)<br />
Black Creek<br />
BLK 100 1.86 0.07% 80
<strong>Watershed</strong> / Subcatchment<br />
Schihl Drain<br />
TABLE 2.2.5: Con’t<br />
SUBWATERSHED PHYSICAL PARAMETERS<br />
EXISTING LAND USE<br />
Area Slope CN II TIMP<br />
Length of<br />
Flow<br />
(km 2 ) (%) (%) (m) Hr (mm)<br />
SCH 100 2.20 0.10% 80
Baker Creek<br />
TABLE 2.2.5: Con’t<br />
SUBWATERSHED PHYSICAL PARAMETERS<br />
EXISTING LAND USE<br />
Area Slope CN II TIMP<br />
Length of<br />
Flow<br />
BAK 100 1.57 0.13% 77
Meteorological Data<br />
The design criteria for the Town of <strong>Fort</strong> <strong>Erie</strong> provides the distribution for the 2 year, 5 year, and<br />
100 year events based on the Chicago Storm for the urban watersheds. The criteria for the rural<br />
watersheds require using the SCS type storm distribution from the City of Port Colborne. Since<br />
most of the watersheds are agricultural and rural nature, the 2 year to 100 year SCS type storm<br />
distribution for the City of Port Colborne has been used in this study.<br />
Hydrologic Simulation<br />
2.2.3 Findings/Constraint Identification<br />
The SWMHYMO input file and the 100 year summary output files have been included in<br />
Appendix ‘SW-B’. The 100 year peak flows have been compared with the previous studies<br />
(ref. Table 2.2.6).<br />
TABLE 2.2.6:<br />
100 YEAR PEAK FLOW COMPARISON AT SUBWATERSHED OUTLET<br />
EXISTING LAND USE<br />
2006 1989 (1)<br />
Subwatershed Area (ha) Peak Flow (m 3 /s) Area (ha) Peak Flow (m 3 /s)<br />
Black Creek<br />
(At Confluence with Beaver Creek)<br />
6374 66.91 - 51.00<br />
Beaver Creek<br />
(At Confluence with Black Creek)<br />
3777 40.66 - 29.10<br />
Black Creek at Outlet 10656 110.53 10465 72.70<br />
Six Mile Creek E.F 1805 47.40 1766 37.70<br />
Miller Creek 901 14.71 724 7.94<br />
Baker Creek 431 7.07 464 3.50<br />
Kraft Drain 555 15.51 506 7.65<br />
Frenchman’s Creek 1640 24.65 (2) 1528 17.70<br />
1. <strong>Watershed</strong> Hydrology Study, Marshal Macklin Monaghan Ltd, 1989<br />
2. Frenchman’s Creek, Floodplain mapping, NPCA, May 2004<br />
For comparison purposes the unit area peak flows have been compared from previous studies<br />
(ref. Table 2.2.7).<br />
TABLE 2.2.7:<br />
100 YEAR PEAK FLOW COMPARISON UNIT RESPONSE (m 3 /s/ha)<br />
EXISTING LAND USE<br />
<strong>Watershed</strong>s PEL, 2006 MMM, 1986 NPCA 2004<br />
Black Creek at Outlet 0.010 0.007 n/a<br />
Six Mile Creek 0.026 0.021 n/a<br />
Frenchman’s Creek n/a 0.012 0.015<br />
Baker Creek 0.016 0.008 n/a<br />
PEL - Philips Engineering Ltd<br />
MMM – Marshall Macklin Monaghan Limited<br />
NPCA – <strong>Niagara</strong> <strong>Peninsula</strong> <strong>Conservation</strong> Authority<br />
The SWMHYMO results of this study are comparable with the previous studies. Overall, the<br />
1986 study has estimated relatively low flows, while a recent study (Floodplain Mapping -<br />
Frenchman’s Creek, NPCA, 2004) has estimated comparatively higher flows. The Six Mile<br />
March 2008 21 <strong>Fort</strong> <strong>Erie</strong> <strong>Creeks</strong> <strong>Watershed</strong> <strong>Plan</strong><br />
General Report (105116)
Creek and Baker Creek have higher unit area peak flows than the Black Creek flows due to the<br />
urban nature of the Baker and Six Mile Creek watersheds.<br />
For comparison purposes, the Regional Frequency Analysis (MTO) has been performed for the<br />
entire Black Creek and Beaver Creek (ref. Appendix ‘SW-B’). The RFA results show the 25 year<br />
peak flow is 62.67 m 3 /s at the outlet, while SWMHYMO simulated the 25 year peak flow of<br />
70.68 m 3 /s.<br />
The above comparisons of peak flows suggest the reasonableness of the SWMHYMO results.<br />
Model Calibration<br />
For calibration purposes a node has been included in the SWMHYMO model at the Wingers<br />
Road Bridge, where a flow gauge was installed. The calibration watershed has a sizeable<br />
drainage area of 5161 ha with 20 subcatchments (ref. Figure 12).<br />
A complete discussion on the calibration and sensitivity analysis exercise has been included in<br />
the Stormwater Management Technical Appendix.<br />
Calibration Results<br />
For three of the five selected events, the observed peak flows are higher than the simulated peak<br />
flows and the two events of July 17 th , 1992 and September 21 st , 1992 are lower, which is likely<br />
due to the initial wet conditions during the previous day’s rainfall events. The observed<br />
hydrograph of September 3 rd , 1992 event did not produce a reliable response, as was observed<br />
during July 17 th event, with a similar depth of rainfall. The simulated ‘time to peak’ has been<br />
reasonable for all the events.<br />
Although there is a significant difference between the observed and simulated runoff volumes,<br />
the simulated runoff coefficient consistently reflects the agricultural and rural nature of the<br />
subwatershed (i.e. C = 0.2 +/-).<br />
The observed hydrographs have slow recession limbs compared with the simulated hydrographs.<br />
This is presumably due to the storage of runoff volumes within the natural areas, along with the<br />
wide and flat creeks with backwater conditions. These systems hold the runoff and release it at<br />
slower rates. This situation could not be accurately simulated to replicate the observed<br />
hydrograph. This significantly contributes to the underestimate of runoff volumes. Another<br />
limitation relates to the assumption of rainfall at one gauge station being uniform over the entire<br />
study area.<br />
Based on the results and findings of the calibration exercise, it has been recommended that the<br />
subwatershed model be considered adequately calibrated, and the adjustment to the parameters<br />
has been applied to the other subwatersheds.<br />
A complete listing of the calibrated modeled frequency flows for each of the watersheds has<br />
been included in Table 2.2.8.<br />
March 2008 22 <strong>Fort</strong> <strong>Erie</strong> <strong>Creeks</strong> <strong>Watershed</strong> <strong>Plan</strong><br />
General Report (105116)
Black Creek<br />
Location<br />
Node<br />
TABLE 2.2.8:<br />
FREQUENCY FLOWS (m 3 /s)<br />
EXISTING LAND USE<br />
HEC-RAS Sec. Culvert Area Frequency Flow Rates (m 3 /s)<br />
(No.) (No.) (ha) 2 5 10 25 50 100<br />
Tributary 1 At outlet to <strong>Niagara</strong> River 1750 1 10656 9.62 29.31 46.11 70.20 89.88 110.53<br />
Tributary 1 At QEW - Conf of Black and Beaver BLK-19 2751 2 10151 9.04 28.03 44.31 67.70 86.88 106.93<br />
Tributary 1 After Snyder Drain BLK-18 3500 6374 6.74 19.12 29.11 43.28 54.93 66.91<br />
Tributary 1 Before Snyder Drain BLK-16 4000 22 5965 5.93 17.15 26.16 39.02 49.56 60.38<br />
Tributary 1 After Conf. With Tr. 2 BLK14 6750 24 5758 5.67 16.46 25.10 37.48 47.58 57.96<br />
Tributary 1 Before Conf. With Tr. 2 BLK13 7000 27 874 1.38 3.60 5.37 7.84 9.84 11.90<br />
Tributary 1 After Blk101 BLK11 8750 28 443 0.69 1.79 2.65 3.85 4.82 5.83<br />
Tributary 1 Headwater BLK100 10632 186 0.38 0.92 1.35 1.94 2.40 2.87<br />
Tributary 2 Before Conf. With Tr. 1 (Flow Gauge) BLK25 20250 25 4884 4.29 12.87 19.75 29.65 37.75 46.08<br />
Tributary 2 Add BLK301 BLK31 23500 31 4585 4.18 12.42 19.26 29.15 37.16 45.47<br />
Tributary 2 Before Conf. With March Dr (Tr3) BLK-24 24000 47 1493 1.85 5.85 9.20 14.05 17.99 22.03<br />
Tributary 2 Headwater BLK-23 25250 48 1241 1.39 4.65 7.38 11.93 14.63 17.96<br />
Tributary 2 Headwater Blk-22 29379 52 821 0.79 2.79 4.55 7.16 9.29 11.48<br />
Tributary 3 Conf of Tr.4, Tr.5 with Tr.3 MAD-11 33552 39 1396 1.24 3.46 5.31 7.95 10.08 12.31<br />
Tributary 3 Tr.6 in Tr. 3 MAD-13 31500 33 2747 2.21 6.27 9.71 14.62 18.55 22.70<br />
Tributary 4 Tr.4 MAD-10 41750 43 815 0.89 2.58 4.01 6.08 7.76 9.52<br />
Tributary 5 Tr.5 RTD-10 51500 44 581 0.44 1.16 1.74 2.55 3.19 3.86<br />
Tributary 6 Conf. With Schihl Drain STJ-11 61000 35 1126 1.21 3.30 4.97 7.33 9.19 11.14<br />
Tributary 6 Headwater STJ-10+STJ102 63000 830 0.73 1.99 3.02 4.49 5.63 6.85<br />
Tributary 7 Headwater SCH100+SCH101 72500 296 0.53 1.39 2.09 3.07 3.85 4.65<br />
Beaver Creek<br />
Tributary 1 before conf. With Black Cr BEV 29.1 + BEV 211 11750 3777 2.44 8.92 15.26 24.64 32.48 40.66<br />
Tributary 1 BEV-29 14000 3080 1.90 6.80 11.87 19.32 25.54 32.31<br />
Tributary 1 After Conf. With Tr. 2 BEV-27 17000 8 2544 1.87 6.02 9.90 16.16 21.03 26.53<br />
Tributary 1 BEV-17 18966 17 1278 1.55 4.95 8.05 12.38 16.09 19.88<br />
Tributary 1 BEV-16 19750 18 1023 1.33 4.01 6.30 9.62 12.38 15.21<br />
Tributary 1 BEV-14 122048 19 907 1.25 3.66 5.69 8.63 11.07 13.55<br />
Tributary 1 Tr.1 Headwater BEV-13 124000 20 601 0.89 2.29 3.44 5.12 6.50 7.93<br />
March 2008 23 <strong>Fort</strong> <strong>Erie</strong> <strong>Creeks</strong> <strong>Watershed</strong> <strong>Plan</strong><br />
General Report (105116)
Location<br />
Node<br />
TABLE 2.2.8:<br />
FREQUENCY FLOWS (m 3 /s)<br />
EXISTING LAND USE<br />
HEC-RAS Sec. Culvert Area Frequency Flow Rates (m 3 /s)<br />
(No.) (No.) (ha) 2 5 10 25 50 100<br />
Tributary 2 Before Conf with Tr. 1 BEV-26 201500 9 986 1.65 5.22 8.71 13.72 17.87 22.29<br />
Tributary 2 BEV-23 203750 14 468 1.41 3.83 6.09 8.90 11.33 13.90<br />
Tributary 2 BEV-21 204004 412 1.34 3.70 5.81 8.58 10.89 13.40<br />
Tributary 2 Tr.2 Headwater BEV-20 205500 303 0.71 1.85 2.77 4.05 5.07 6.12<br />
Six Mile Creek<br />
Mann Drain Mann Drain Tr. 3 MAN 101 303500 86 187 1.06 2.28 2.58 4.46 6.04 8.13<br />
Mann Drain Mann Drain Tr. 4 MAN 100 401250 85 185 0.77 2.15 3.29 4.89 6.17 7.5<br />
Mann Drain Mann Drain Tr. 3 MAN-10 301000 78 372 1.52 4.36 5.82 9.32 12.14 15.31<br />
Six Mile Creek Six Mile Cr. Tr. 1 SIX-40 105250 80 340 0.96 2.38 3.52 5.11 6.38 7.68<br />
Six Mile Creek Six Mile Cr. Tr. 2 SIX-11 202750 82 294 0.77 2.45 3.89 5.96 7.65 9.40<br />
Six Mile Creek Conf. Of Tr.1 and Tr. 2 SIX-22 102500 77 982 2.50 7.07 10.91 16.36 20.77 25.36<br />
Six Mile Creek Six Mile Cr. Tr. 1 and Mann Drain SIX-14 101865 75 1805 4.82 13.15 20.10 30.46 38.81 47.40<br />
Miller Creek<br />
Miller Creek Headwaters MIL 100 107250 445 0.92 2.49 3.76 5.54 6.98 8.46<br />
Miller Creek MIL-11 103028 60 651 1.18 3.35 5.12 7.63 9.68 11.80<br />
Miller Creek At outlet MIL-12 100250 58 901 1.69 4.42 6.61 9.69 12.17 14.71<br />
Kraft Drain<br />
Tributary 1 Headwater KRD 100 101250 67 0.19 0.53 0.90 1.56 2.29 3.05<br />
Tributary 1 Headwater KRD 102 101500 164 0.58 1.64 3.03 5.30 7.33 9.67<br />
Tributary 2 Headwater KRD 103 201006 69 209 0.37 1.02 1.57 2.34 2.96 3.60<br />
Tributary 3 Headwater KRD-12 300755 70 182 0.71 1.92 3.24 5.31 7.10 9.23<br />
At Outlet Confluence of all Tributaries KRD-13 100750 68 555 1.25 3.49 5.73 9.10 12.10 15.51<br />
Baker Creek<br />
Baker Creek Headwaters Bak-10 102500 57 255 0.49 1.34 2.03 3.01 3.79 4.60<br />
Baker Creek Conf. With Dr. Cobb Drain Outlet 100655 56 431 0.83 2.12 3.14 4.62 5.81 7.07<br />
March 2008 24 <strong>Fort</strong> <strong>Erie</strong> <strong>Creeks</strong> <strong>Watershed</strong> <strong>Plan</strong><br />
General Report (105116)
2.2.4 Summary of Significant Features/Constraints<br />
Sufficient existing rainfall data and flow data has been collected to provide enough significant<br />
events for hydrologic model calibration. The Black Creek is a low-gradient system, affected by<br />
backwater from the <strong>Niagara</strong> River, and also has large amounts of marsh in the subwatershed.<br />
Consequently, the effectiveness of the calibration is limited, however the peak flow estimates are<br />
considered to be satisfactory for floodplain management purposes.<br />
The topography and soils did not have any significant features from a hydrologic perspective.<br />
There are no large impoundments of water, such as lakes or dams, to restrict the flows and affect<br />
the hydrologic routing in the watersheds.<br />
The models have been calibrated using the Black Creek watershed, and flows have been<br />
developed to enable the completion of the floodplain mapping.<br />
2.3 Hydraulics/Floodplain Mapping<br />
Importance:<br />
Hydraulic characteristics of watercourse systems are important to the function of the watercourse<br />
network and the features they support, including:<br />
• Natural fluvial processes<br />
• Conveyance of flood flows<br />
• Terrestrial and fish habitat functions<br />
• Conveyance/interception of baseflow/seepage to receiving watercourse<br />
2.3.1 Background Information Collection<br />
• Frenchman’s Creek Floodplain Mapping, NPCA, 2004<br />
• Town of <strong>Fort</strong> <strong>Erie</strong> culvert assessment database and photos, 2003<br />
• Town of <strong>Fort</strong> <strong>Erie</strong> Municipal Drain reports and mapping<br />
• <strong>Watershed</strong> Flood Damage Assessment Study, Cumming Cockburn Ltd. 1988<br />
• Floodplain Mapping Town of <strong>Fort</strong> <strong>Erie</strong>, Black Creek and Beaver Creek, General Report<br />
and Technical Report, DeLeuw-Cather (DeLCan), Canada Ltd, December 1985<br />
2.3.2 Work Activities<br />
All creek bridges and culvert structures, within the study area, have been field surveyed by the<br />
field staff of Philips Engineering Ltd. during February and March 2006 (ref. Appendix ‘SW-C’).<br />
The US Army Corp of Engineering River Analysis System (HEC-RAS) has been used for the<br />
hydraulic analysis and floodplain determination (ref. Appendix ‘WC-F’).<br />
March 2008 25 <strong>Fort</strong> <strong>Erie</strong> <strong>Creeks</strong> <strong>Watershed</strong> <strong>Plan</strong><br />
General Report (105116)
RiverCAD TM has been used to develop the basic HEC-RAS model input from the digital<br />
topographic mapping. Additional structure data has been included based on field survey as<br />
noted.<br />
The Town of <strong>Fort</strong> <strong>Erie</strong> assisted in the refinement of the drainage area delineation for all of the<br />
Municipal Drains. Numerous background reports that have been prepared were made available<br />
for review. Several drains are currently undergoing a reassessment. The most current digital<br />
mapping from the Town has been used for the study area delineation.<br />
Channel roughness and floodplain roughness in each reach have been estimated based on field<br />
reconnaissance survey, aerial photographs, and site photographs. The boundary conditions in<br />
HEC-RAS, which includes the water surface elevations in the receiving water body (lake or<br />
river), have been obtained from the historic record. The boundary condition becomes a<br />
significant parameter since the backwater conditions in most of the creeks within the study area<br />
is significant.<br />
The Ontario Power Generation flow gauge in the <strong>Niagara</strong> River recorded an average water<br />
surface elevation of 172.165 m between 1966 and 1983 and has been used for Black Creek, and<br />
the 100 year water surface elevation of 173.32 m, as recommended by the Ministry of Natural<br />
Resources (DelCan, 1985). The Frenchman’s Creek model used the100 year boundary condition<br />
of 173.98 m (NPCA. 2003), therefore, the 100 year outlet boundary condition for the Miller<br />
Creek has been determined as 173.65 m, using linear interpolation.<br />
The Canadian Hydrographic Service, a section of the Department of Fisheries and Oceans, has<br />
compiled the historic water surface elevations in Lake <strong>Erie</strong>. The, mean monthly water surface<br />
elevation is 174.4 m and the maximum monthly mean in any year is 174.86 (reported in 1987).<br />
<strong>Niagara</strong> <strong>Peninsula</strong> <strong>Conservation</strong> Authority has recommended the 100 year WSEL in Lake <strong>Erie</strong> to<br />
be 177.11 m, as noted in the Flood and Erosion Risk Maps (Marshal, Macklin, Monaghan,<br />
Canada-Ontario Flood Damage Reduction Study, 1991).<br />
In order to determine the 100 year floodlines on the <strong>Fort</strong> <strong>Erie</strong> <strong>Creeks</strong> watersheds, two different<br />
downstream boundary conditions have been modeled:<br />
• The 100 year hydrologic rainfall-runoff event peak flows run with the mean annual water<br />
surface elevation at the outlet (i.e. <strong>Niagara</strong> River or Lake <strong>Erie</strong>)<br />
• The 100 year downstream boundary condition superimposed on the surrounding lands at<br />
the creek mouths<br />
The greater of the two water surface elevations has been selected by the NPCA as the regulatory<br />
elevation.<br />
March 2008 26 <strong>Fort</strong> <strong>Erie</strong> <strong>Creeks</strong> <strong>Watershed</strong> <strong>Plan</strong><br />
General Report (105116)
2.3.3 Findings/Constraint Identification<br />
Historic floodplain mapping is available for the Black Creek, Beaver Creek and Frenchman’s<br />
Creek. The Black and Beaver Creek floodplain mapping is considered outdated since more<br />
detailed aerial photography has been converted to more accurate mapping. Some of the previous<br />
hydraulic section information was based on the MNR OBM product (1983), which has a 5 m<br />
contour interval. The NPCA has recently updated the floodplain mapping for Frenchman’s<br />
Creek, using the most current topographic mapping (2002) which has a 1 m contour interval.<br />
A total of 83 culverts and bridges have been field surveyed, including upstream and downstream<br />
cross-sections, road profile and a photographic inventory (ref. Appendix ‘WC-E’). A list of<br />
structures have been included in Table 2.3.1.<br />
Updated floodplain mapping has been prepared for Black Creek, Beaver Creek, Baker Creek,<br />
Miller Creek, Kraft Drain and Six Mile Creek and is available at the NPCA, under separate cover<br />
(ref. Figure 14).<br />
March 2008 27 <strong>Fort</strong> <strong>Erie</strong> <strong>Creeks</strong> <strong>Watershed</strong> <strong>Plan</strong><br />
General Report (105116)
Culvert<br />
ID<br />
<strong>Watershed</strong>s<br />
TABLE 2.3.1:<br />
FORT ERIE CREEKS STRUCTURE SUMMARY OF CULVERT DATA FROM FIELD AND BACKGROUND DATA<br />
Crossing<br />
Size (m)<br />
Span (m) Rise (m)<br />
Number of<br />
Culverts<br />
Footing Type<br />
Material<br />
Length<br />
(m)<br />
Slope<br />
(m/m)<br />
U/S Creek<br />
Invert (m)<br />
U/S Creek<br />
Obvert (m)<br />
1 Black Creek <strong>Niagara</strong> Parkway 22.50 4.73 1.00 Arch Stone 13.80 -0.02 169.66 173.69 174.46<br />
1A Black Creek Netherby Road 17.80 1.77 1.00 Bridge Abutment Stone / Steel 7.40 0.01 170.35 174.12 174.12<br />
2 Black Creek QEW 18.70 2.00 1.00 Arch Concrete 35.00 0.01 171.25 174.36 175.50<br />
3 Beaver Creek College Road 7.60 1.64 1.00 Arch Concrete 7.00 0.02 170.89 172.53 173.30<br />
4 Beaver Creek Eagle St. 6.10 2.15 1.00 Open Box Corrugated Steel 18.00 0.01 171.33 174.5 174.89<br />
5 Beaver Creek Penn Central Railway 14.80 2.60 1.00 Bridge Abutment Concrete/Steel 8.50 0.03 172.46 175.16 176.49<br />
6 Beaver Creek CNR 10.70 5.30 1.00 Bridge Abutment Stone / Steel 8.40 - 173.28 177.38 178.80<br />
7 Beaver Creek Bowen Road 6.10 1.92 1.00 Open Box Concrete 9.50 0.01 173.22 175.06 175.82<br />
8 Beaver Creek Winger Road 4.60 1.80 2.00 Bridge Abutment Concrete 5.40 0.01 174.53 176.35 176.57<br />
9 Beaver Creek Bertie Road 4.10 1.60 1.00 Open Box Concrete 11.00 0.01 176.54 177.10 177.83<br />
10 Beaver Creek Bertie Road 1.83 0.70 1.00 Open Box Concrete 11.00 0.00 175.25 176.84 177.64<br />
10A Beaver Creek Bertie Road 1.80 0.83 1.00 Open Box Concrete 11.00 0.00 176.32 177.20 177.64<br />
11 Beaver Creek HWY 3 4.88 1.60 1.00 Open Box Concrete 32.00 0.01 176.50 177.99 178.89<br />
12 Beaver Creek Gorham Road 4.88 1.54 1.00 Open Box Concrete 24.20 0.00 176.62 179.10 178.89<br />
13 Beaver Creek Gorham Road 4.87 1.54 1.00 Open Box Concrete 17.50 0.01 179.48 181.27 182.26<br />
14 Beaver Creek Nigh Road 3.60 1.26 1.00<br />
U/s Open Box d/s<br />
Arch<br />
Top of<br />
Road (m)<br />
Concrete 6.90 0.01 179.48 180.80 181.45<br />
15 Beaver Creek Gorham Road 3.67 1.60 1.00 Open Box Concrete 21.80 0.01 180.67 182.16 183.58<br />
16 Beaver Creek Stevensville Road 6.10 1.60 1.00 Open Box Concrete 21.90 0.01 173.09 174.64 176.86<br />
17 Beaver Creek Ott Road 2.40 1.52 2.00 Box Concrete 12.50 0.00 176.06/175.9 177.58/177.42 177.77<br />
17A Beaver Creek Ott Rd., N. of Culv. 17 2.40 1.20 1.00 Box Concrete 12.50 0.00 176.01 177.21 177.77<br />
18 Beaver Creek House Road 4.30 1.90 1.00 Open Box Concrete 18.00 0.04 180.63 182.74 183.76<br />
19 Beaver Creek HWY 3 3.66 2.14 1.00 Open Box Concrete 42.60 0.00 182.54 184.60 186.86<br />
20 Beaver Creek Nigh Road 3.66 1.83 1.00 Open Box Concrete 16.00 0.00 183.09 184.71 185.56<br />
21 Beaver Creek Point Abino Road 3.66 1.65 1.00 Open Box Concrete 12.50 - 0.002 183.52 185.11 185.95<br />
22 Black Creek College Road 12.21 3.07 1.00 Bridge Abutment Concrete / Steel 8.00 0.00 170.40 173.47 174.10<br />
23 Black Creek Eagle Road 21.20 2.49 1.00 Bridge Abutment Concrete 6.70 0.01 170.70 173.19 174.41<br />
24 Black Creek Penn Central Railway 9.00 3.06 1.00 Bridge Abutment Concrete / Steel 9.00 0.01 171.93 174.99 177.25<br />
25 Black Creek Winger Road 11.60 2.44 1.00 Bridge Abutment Concrete / Steel 11.80 - 0.027 171.37 173.47 174.61<br />
26 Black Creek Winger Road 12.20 1.70 1.00 Bridge Abutment Concrete / Steel 5.60 - 0.063 171.61 173.31 174.04<br />
March 2008 28 <strong>Fort</strong> <strong>Erie</strong> <strong>Creeks</strong> <strong>Watershed</strong> <strong>Plan</strong><br />
General Report (105116)
Culvert<br />
ID<br />
<strong>Watershed</strong>s<br />
TABLE 2.3.1:<br />
FORT ERIE CREEKS STRUCTURE SUMMARY OF CULVERT DATA FROM FIELD AND BACKGROUND DATA<br />
Crossing<br />
Size (m)<br />
Span (m) Rise (m)<br />
Number of<br />
Culverts<br />
Footing Type<br />
Material<br />
Length<br />
(m)<br />
Slope<br />
(m/m)<br />
U/S Creek<br />
Invert (m)<br />
U/S Creek<br />
Obvert (m)<br />
27 Black Creek CNR 10.70 4.50 1.00 Bridge Abutment Stone / Steel 18.00 - 172.87 177.37 178.79<br />
28 Black Creek Bowen Road 1.20 - 2.00 Bridge Abutment Corrugated Steel 19.60 - 0.011 173.71 174.56 175.57<br />
29 Black Creek Stevensville Road 2.44 1.00 1.00 Open Box Concrete 21.80 0.00 175.99 177.16 178.80<br />
30 Black Creek Stevensville Road 14.70 2.71 1.00 Bridge Abutment Concrete 18.00 0.01 171.65 176.89 175.06<br />
31 Black Creek Ott Road 13.00 3.20 1.00 Bridge Abutment Concrete / Steel 11.00 0.01 172.64 175.84 176.63<br />
32 Black Creek House Road 6.10 3.35 1.00 Box Concrete 18.00 0.00 173.00 176.35 177.32<br />
33 Black Creek Fox Road 4.27 2.77 1.00 Open Box Concrete 16.90 0.01 175.36 177.68 178.21<br />
34 Black Creek Penn Central Railway 7.00 2.30 2.00 Bridge Abutment Stone / Steel 8.50 0.01 174.95 177.27 178.55<br />
35 Black Creek College Road 3.66 0.62 1.00 Open Box Concrete 5.00 0.00 174.83 175.35 175.58<br />
36 Black Creek Point Abino Road 3.85 - 1.00 Circle Corrugated Steel 24.00 0.01 173.95 176.11 177.37<br />
38 Black Creek Church Road 5.50 1.58 1.00 Open Box Concrete 7.60 0.00 174.83 177.08 177.77<br />
39 Black Creek Burger Road 5.62 1.82 1.00 Open Box Concrete 13.50 - 0.017 175.31 177.19 177.88<br />
46 Black Creek CNR 10.53 5.29 1.00 Bridge Abutment Stone / Steel 8.30 0.08 174.35 179.57 180.36<br />
47 Black Creek Church Road 6.10 2.80 1.00 Open Box Concrete 20.00 0.01 173.97 177.01 177.70<br />
48 Black Creek House Road 6.10 1.68 1.00 Bridge Abutment Concrete / Steel 5.60 - 0.018 175.39 177.07 177.85<br />
Top of<br />
Road (m)<br />
49 Black Creek Point Abino Road 7.50 2.18 1.00 Con Span Concrete 12.50 0.01 173.95 176.11 176.70<br />
50 Black Creek Burger Road 6.10 1.53 1.00 Open Box Concrete 14.00 0.00 177.60 179.13 180.14<br />
51 Black Creek Holloway Road 2.75 1.35 2.00 Arch Concrete 6.00 0.01 178.41 179.75 179.68<br />
52 Black Creek Zavitz Road 6.10 1.72 1.00 Open Box Concrete 14.00 0.01 178.67 179.92 180.16<br />
53 Black Creek Leam Road 5.50 1.70 1.00 Open Box Concrete 15.00 0.01 179.46 181.16 182.30<br />
54 Black Creek 2nd Concession 5.50 1.56 1.00 Open Box Concrete 14.00 0.01 179.93 181.49 181.96<br />
55 Baker Creek <strong>Niagara</strong> Parkway 12.00 2.10 1.00 Arch Concrete / Stone 16.00 -0.02 171.28 173.44 174.53<br />
56 Baker Creek Schueigler Road 2.46 1.00 1.00 Open Box Concrete 5.00 -0.05 171.35 172.65 173.28<br />
57 Baker Creek Townline Road 3.00 1.20 1.00 Box Concrete 12.50 0.00 172.59 173.79 174.81<br />
58 Miller Creek <strong>Niagara</strong> Parkway 9.00 1.00 Arch Concrete 11.50 0.00 171.53 174.59 175.26<br />
59 Miller Creek Miller Ave 4.20 2.10 1.00 Open Box Concrete 12.50 0.02 171.69 173.82 174.40<br />
60 Miller Creek Abandond CNR<br />
61 Miller Creek Sutherland 3.00 1.20 2.00 Open Box Concrete 7.50 0.00 175.23 176.39 176.85<br />
62 Miller Creek Arcadia Road 4.20 1.20 1.00 Box Concrete 17.50 -0.02 174.82 176.27 177.03<br />
63 Miller Creek Petit Road 3.50 1.35 1.00 Box Concrete 14.50 0.00 175.68 177.04 177.61<br />
March 2008 29 <strong>Fort</strong> <strong>Erie</strong> <strong>Creeks</strong> <strong>Watershed</strong> <strong>Plan</strong><br />
General Report (105116)
Culvert<br />
ID<br />
<strong>Watershed</strong>s<br />
TABLE 2.3.1:<br />
FORT ERIE CREEKS STRUCTURE SUMMARY OF CULVERT DATA FROM FIELD AND BACKGROUND DATA<br />
Crossing<br />
Size (m)<br />
Span (m) Rise (m)<br />
Number of<br />
Culverts<br />
Footing Type<br />
Material<br />
Length<br />
(m)<br />
Slope<br />
(m/m)<br />
U/S Creek<br />
Invert (m)<br />
U/S Creek<br />
Obvert (m)<br />
64A Miller Creek Abundand Rail Track 2.50 2.10 1.00 Box Concrete 7.00 0.00 178.01 180.26 182.25<br />
64B Miller Creek CNR 1.00 Arch Stone 12.00 0.01 178.19 180.33 182.54<br />
64C Miller Creek Penn Central Railway 1.00 Open Stone 12.00 -0.01 177.57 180.33 182.00<br />
65 Miller Creek Bowen Road 3.00 1.50 1.00 Open Box Concrete 20.00 0.01 178.22 179.72 181.08<br />
66 Miller Creek Pettit Road - 0.90 2.00 Pipe Corrugated Steel 13.00 -0.01 179.80 180.67 182.18<br />
67 Kraft Drain Ashphalt Trail 3.00 2.00 1.00 CSPA Corrugated Steel 5.00 0.00 175.11 177.14 179.08<br />
68 A Kraft Drain Dominion Road 3.04 1.85 1.00 Box Concrete 15.00 0.02 175.79 177.4 178.18<br />
68 C Kraft Drain Edgemere Road 2.40 2.55 1.00 Open Box Concrete 6.50 -0.01 174.94 177.47 177.86<br />
68 B Kraft Drain Private Driveway 4.00 2.00 1.00 CSPA Corrugated Steel 1.50 0.01 175.11 177.14 179.08<br />
69 Kraft Drain Kraft Road - 0.85 1.00 CSP Corrugated Steel 9.50 0.01 178.58 179.38 179.83<br />
70 Kraft Drain Kraft Road 1.25 0.60 1.00 Box Concrete 9.00 0.01 180.02 181.23 181.80<br />
71 Bertie Bay Drain Macdonald Drive 1.00 1.00 1.00 Box Concrete 17.00 0.01 175.55 176.54 177.00<br />
72 Bertie Bay Drain Walking Trail 1.08 0.90 1.00 Box Stone 7.00 0.01 178.03 178.7 179.90<br />
73 Six Mile Creek Colony Road 14.40 2.60 1.00 Open Span Steel / Wood 4.00 0.00 173.08 175.69 176.35<br />
74 Six Mile Creek Colony Road 31.00 2.20 1.00 Open Span Steel / Wood 4.00 0.06 173.58 175.81 176.75<br />
75 Six Mile Creek Thunder Bay Road 9.00 2.50 1.00 Open Span Concrete 9.00 0.01 173.23 175.73 176.27<br />
76 Six Mile Creek Walking Trail 7.60 2.90 1.00 Bridge Abutment Steel / Stone 7.00 0.00 175.06 178.13 179.27<br />
77 Six Mile Creek Dominion Road 10.00 1.40 1.00 Bridge Abutment Concrete 12.50 0.00 175.02 176.78 177.43<br />
78 Six Mile Creek Centralia Ave. N. 2.40 1.40 1.00 Open Box Concrete 14.00 0.02 175.78 176.37 177.52<br />
79 Six Mile Creek Nigh Road 1.85 1.10 1.00 CSPA Corrugated Steel 10.00 0.00 177.30 178.53 179.06<br />
80 Six Mile Creek Stone Mill Road 2.10 1.20 1.00 Open Box Stone / Concrete 9.00 0.00 178.53 179.9 180.37<br />
81 Six Mile Creek Nigh Road 3.10 1.49 1.00 Open Box Concrete 13.50 -0.01 177.29 178.77 179.35<br />
82 Six Mile Creek Centralia Ave. N. 2.00 1.00 1.00 Open Box Concrete 8.40 -0.01 180.73 181.69 182.55<br />
83 Six Mile Creek Bernard Ave. 1.80 1.00 1.00 Open Box Concrete 7.50 -0.01 177.97 178.93 179.68<br />
84 Six Mile Creek Bernard Ave. 1.20 0.60 1.00 Open Box Concrete 7.80 -0.10 179.69 180.29 180.82<br />
85 Six Mile Creek Nigh Road 1.20 0.60 1.00 Open Box Concrete 7.00 0.03 180.58 181.22 181.81<br />
86A Six Mile Creek Nigh Road 1.50 1.00 1.00 Open Box Concrete 23.40 0.00 180.12 181.3 181.85<br />
86B Six Mile Creek Nigh Road 2.20 1.00 1.00 Open Box Concrete 12.60 -0.06 180.24 181.1 181.46<br />
Top of<br />
Road (m)<br />
March 2008 30 <strong>Fort</strong> <strong>Erie</strong> <strong>Creeks</strong> <strong>Watershed</strong> <strong>Plan</strong><br />
General Report (105116)
2.3.4 Summary of Significant Features/Constraints<br />
The hydraulic modeling and floodplain mapping has been prepared for the seven largest of the<br />
<strong>Fort</strong> <strong>Erie</strong> <strong>Creeks</strong> in the study area (Black, Beaver, Baker, Miller, Frenchman’s, Kraft, Six Mile).<br />
The Black Creek outlet was shown to be the only reach where the downstream boundary<br />
condition was impacted by the 100 year water surface elevations in the receiving water body.<br />
This was not unexpected, given the gentle gradient of the Black Creek.<br />
There are a number of building structures that have been identified within the 100 year<br />
Regulatory floodplains. The mapping and documentation of the floodlines are kept under<br />
separate cover by the NPCA, however the findings form part of the recommendations for<br />
management that are developed in the <strong>Watershed</strong> <strong>Plan</strong>.<br />
2.4 Stream Morphology<br />
This section covers the morphology and condition of the watercourses within the study area<br />
which includes a characterization of individual reaches, a historic analysis of the channel<br />
network and associated land use patterns, quantification of channel stability and overall health,<br />
and the evaluation of geomorphic conditions.<br />
2.4.1 Background Information<br />
This component of the watershed study provides an historical assessment of the <strong>Fort</strong> <strong>Erie</strong> <strong>Creeks</strong><br />
<strong>Watershed</strong> using a series of aerial photographs, as well as a reach description summarizing<br />
present conditions observed during the November/December 2005 field reconnaissance.<br />
Historical analyses have provided insight into the degree of natural fluvial activity and human<br />
impacts within the study area, such as channel straightening or changes in land use and channel<br />
planform. Investigation of stream morphology initially involved collecting and reviewing<br />
background and historical information to identify channel characteristics (e.g. stream length and<br />
gradient) and historical changes (e.g. planform change).<br />
Historical land use and channel changes have been evaluated over a 50-year time period for the<br />
entire study area. An examination of historical aerial photographs allows the natural tendencies<br />
of a river through time to be determined. Moreover, changes in land use and the subsequent<br />
response of the channel can be identified. Included in the historical analyses were aerial<br />
photographs taken in: 1955, 1978 and 2005 (Google Earth Digital aerial). Due to the scale of the<br />
aerial photographs, the size of some of the channels’ patterns could not always be observed.<br />
Historical Assessment<br />
Six Mile Creek<br />
In general, the land uses surrounding Six Mile Creek have not been altered since 1955. The<br />
majority of the lands remain enveloped in agricultural and scrubland designations, with minor<br />
residential parcels present around the main road intersections and the shoreline of Lake <strong>Erie</strong>.<br />
Reaches SMC-1 through to SMC-5, SMC-9 and SMC-10 appear to have retained their natural<br />
meander form, with little alteration observed between the years studied. Reaches SMC-6 to<br />
SMC-8 however, appeared to have been modified/straightened into functioning drains for<br />
March 2008 31 <strong>Fort</strong> <strong>Erie</strong> <strong>Creeks</strong> <strong>Watershed</strong> <strong>Plan</strong><br />
General Report (105116)
agricultural purposes prior to 1955. The sparse scrubland vegetation and agricultural crops<br />
present in the 1995 aerial photographs have been replaced with denser woodlot and scrubland<br />
parcels throughout most of the southern section of this watercourse. More specifically, the land<br />
uses surrounding Reaches SMC-2, SMC-3 and SMC-4 have progressed from agricultural fields<br />
in 1955 to dense woodlot areas in 2005. In 1955, two race tracks can be seen on a parcel of land<br />
lying between Reaches SMC-6 and SMC-9, north of the confluence of these reaches. These race<br />
tracks appeared to have been abandoned in 1978 where scrubland and meadow vegetation had<br />
begun to take over the area. No trace of these race tracks can be seen in the 2005 digital<br />
photographs. Therefore, this progression to a more naturally vegetated area would have<br />
decreased the amount of sediment entering Reaches SMC-6 and SMC-9.<br />
There has not been any significant increase in residential development or road infrastructure<br />
observed for any reach within this watershed. Aside from the straightening of some of the upper<br />
reaches, there does not appear to be any significant change in the channel planform observed<br />
from 1955 to 2005. However, because of the scale and clarity of the 1955 and 1978 aerial<br />
photographs, determining changes in specific meander form and migration on a reach by reach<br />
basis could not be accurately assessed.<br />
Frenchman’s Creek<br />
The main branch of Frenchman’s Creek has a variety of surrounding land uses that progress from<br />
lakeshore residential, to scrubland/wetlands, followed by golf course property and then<br />
agricultural fields. Very little residential development was observed beyond the shoreline.<br />
There are a number of road crossings and associated infrastructure that separate the reaches and<br />
land use designations observed.<br />
Aerial photographic coverage for Reaches FRC-1 through FRC-6 was not available for 1955;<br />
therefore, descriptions of these reaches were only based on the 1978 and 2005 photographs. The<br />
remaining reaches have been assessed over a full 50-year coverage.<br />
The large channel widths of Reaches FRC-1and FRC-2 made it possible to analyze the channel<br />
planform and land use changes observed between 1978 and 2005. The mouth of FRC-1 was<br />
surrounded by agricultural fields in 1978. This agricultural land use appeared to be abandoned<br />
sometime before the 2005 aerial photograph was taken; presently, this portion of the watercourse<br />
is surrounded by scrubland and woodlot parcels. The remainder of this reach was surrounded by<br />
a low lying wetland area present in both 1978 and 2005. The upstream portion of this reach had<br />
formed lateral and point bars along the meander bends prior to 2005, however these bar<br />
formations were not observed in the 1978 aerial photographs.<br />
The channel planform of Reach FRC-2 does not appear to have changed between 1978 and 2005,<br />
however the upstream portion of the reach in both photographs is obscured by vegetation.<br />
Therefore, an accurate determination of channel planform changes could not be determined. The<br />
land use surrounding this reach was consistent between the years with apparent changes<br />
observed.<br />
Reaches FRC-3, FRC-4 and FRC-6 were completely obscured by vegetation in both the 1978<br />
and 2005 aerial photographs. Therefore, characterization of channel planform changes could not<br />
be assessed. In 2005 the land use did not vary from the scrub and wetland features observed<br />
in 1978.<br />
March 2008 32 <strong>Fort</strong> <strong>Erie</strong> <strong>Creeks</strong> <strong>Watershed</strong> <strong>Plan</strong><br />
General Report (105116)
Reach FRC-5 was surrounded by the Rio Vista Golf and Country Club, established sometime<br />
before 1978. The vegetation surrounding most of the creek consisted of manicured fairway<br />
grasses and some dense plots of forest species. The channel planform appears to have changed<br />
between 1978 and 2005, with an increase in meander formation observed in the 2005<br />
photographs. There was also an addition of one extra cart bridge that was constructed over the<br />
middle portion of the reach in 2005 that was not present in 1978. Otherwise, there did not appear<br />
to be any other observable differences to characterize this reach between the two years studied.<br />
Observations for Reach FRC-8 suggest a slight change in the surrounding land use observed for<br />
all three years of photography. The downstream portion of the western bank has been used as a<br />
large cemetery since sometime before 1955, and only the amount of land used for burial sites has<br />
progressively increased from 1955. A large parcel of land was used as an automobile wreckage<br />
yard sometime prior to 2005 but was not present in 1955 and 1978. There did not appear to be<br />
any other changes in land use observed between 1955, 1978 and 2005. The vegetation<br />
immediately adjacent to the channel in this reach made it difficult to determine if changes in<br />
planform were present between the three years. For this reason, no conclusions regarding<br />
channel planform have been described for Reach FRC-7.<br />
The majority of Reaches FRC-8, FRC-9 and the downstream portion of FRC-10 were surrounded<br />
by the Bridgewater Golf and Country Club, established sometime before 1955. The trees and<br />
shrubs growing within the golf course boundaries have aged and become denser, otherwise no<br />
other significant changes in surrounding land use were observed between the years studied. A<br />
few additional outbuildings and maintenance sheds were constructed along the southern bank of<br />
the downstream portion of FRC-8 prior to 2005, but this construction did not appear to require<br />
any alterations to the channel. A weir structure was built across the southern portion of the golf<br />
course property and Reach FRC-8 prior to 2005. This weir created a backwater affect upstream<br />
and a ponding area downstream of the weir that was observed in the 2005 aerial photographs.<br />
However, the quality and scale of the 1955 and 1978 has made it impossible to determine when<br />
this weir was built. Additional cart and maintenance bridges have been built across portions of<br />
both Reaches FRC-8 and FRC-9, but no other changes in channel planform were observed within<br />
these reaches.<br />
The remaining section of Reach FRC-10, as well as Reach FRC-11 display a progression from<br />
agricultural land uses to somewhat more scrubland and wetland features. There was also an<br />
increase in the amount of road infrastructure present in 1978 and 2005 that required the altering<br />
of the channel planform for its construction. In 1955, the downstream portion of Reach FRC-11,<br />
and the upstream portion of FRC-12 consisted of a natural meander pattern. Between 1955 and<br />
1978, Reach FRC-11 was completely modified and straightened so that it fit into the plans for<br />
the Q.E.W-Gilmore Road-Spears Road North intersections.<br />
A steady progression in the transition from agricultural crops lands to scrubland and woodlots<br />
blocks was observed for the remaining four reaches located on the main branch of Frenchmen’s<br />
Creek. In 1955 the majority of the surrounding parcels of land surrounding FRC-12, FRC-13,<br />
FRC-14 and FRC-15 consisted of agricultural fields with only small parcels of dense woodlot<br />
parcels. In 1978, all but a small portion of Reach FRC-14 and Reach FRC-15 were over taken<br />
by scrubland vegetation. By 2005, only the upper half of Reach FRC-14 remained agricultural<br />
March 2008 33 <strong>Fort</strong> <strong>Erie</strong> <strong>Creeks</strong> <strong>Watershed</strong> <strong>Plan</strong><br />
General Report (105116)
fields. Due to the scale and quality of the 1978 aerial photograph, detailed accounts of channel<br />
planform changes could not be described for these reaches.<br />
Millers Creek<br />
This watercourse is surrounded by a mixture of agricultural fields, scrubland, and forest land<br />
uses with a small number of residential parcels intermixed within the vegetated areas. These<br />
land uses did not appear to have changed much from 1955 to 2005. Some agricultural fields in<br />
1955 have become vegetated scrubland while other regions have become dense forested areas.<br />
Additional residential buildings were constructed prior to 1978 along both Cairns Crescent and<br />
Sutherland Drive that were not observed in 1955. A detailed review of aerial photographs of<br />
Reach MLC-1 and MLC-2 confirm significant changes in channel planform through the<br />
straightening of Millers Creek for road construction and residential development. As one travels<br />
upstream, the creek’s natural meander-riffle cycle resumes and no further changes in land use or<br />
channel planform are observed.<br />
Beaver Creek<br />
This watercourse flows as a tributary to Black Creek that confluence immediately south of the<br />
Q.E.W. and Townline Road intersection. There is no aerial photographic coverage for Reaches<br />
BVC-12 to BVC-16, and BVC-20 to BVC-25 for either 1955 or 1978. Therefore, only the<br />
remaining reaches could be characterized and their historical information described.<br />
There does not appear to be any significant changes in surrounding land uses that would account<br />
for any changes in channel planform observed for Beaver Creek. Scrubland and scrub forest<br />
remain the dominant surrounding land uses, with a few agricultural fields and residential parcels<br />
intermixed throughout the extent of the watercourse. Of the 26 reaches delineated for Beaver<br />
Creek, there only appeared to be three that actually had significant land use changes prior to<br />
1978 that were observable in the aerial photographs. Reaches BVC-3 and BVC-4 were<br />
originally surrounded by agricultural fields and small parcels of scrubland in 1955. By 1978, the<br />
fields along the western bank were taken over by fairways and greens for the International Golf<br />
and Country Club. Only Reach BVC-17 of the remaining Beaver Creek Reaches shows any sign<br />
of change in surrounding land use. In 1955 and 1978, this reach was immediately surrounded by<br />
a thin strip of scrub forest and a large agricultural field along its eastern bank. Prior to the taking<br />
of the 2005 aerial photograph, a horse racing track was constructed within the agricultural fields<br />
of the eastern bank.<br />
According to the detailed assessment of the reaches for all three years studied, there did not<br />
appear to be any significant change in the channel planform observed. That being said, the scale<br />
and thick vegetative cover present in the upstream reaches makes it difficult to determine the<br />
accurate location of the channel. Therefore, definitive changes in channel planform could not be<br />
assessed for those areas where scrublands and forest rendered channel banks challenging to see.<br />
In cases such as this, we can only rely on those areas that can be seen in the aerial photographs,<br />
as well as the areas where the watercourse is crossed by a bridge or road. There did not appear<br />
to any changes in the location of these road and bridge crossings either. Therefore, it can be<br />
stated that observable changes in the planform of the channel is unlikely for Beaver Creek.<br />
March 2008 34 <strong>Fort</strong> <strong>Erie</strong> <strong>Creeks</strong> <strong>Watershed</strong> <strong>Plan</strong><br />
General Report (105116)
Black Creek<br />
This watercourse confluences with the <strong>Niagara</strong> River in the north-eastern portion of the study<br />
area. Black Creek feeds into this watercourse at Reach BLC-3, immediately south of the<br />
intersection of Townline Road and the Q.E.W. At its mouth, this watercourse is immediately<br />
surrounded by residential parcels fringing on agricultural fields. To reach this point the<br />
watercourse must flow down through an interchanging mixture of agricultural, scrubland and<br />
residential land uses surrounded by road infrastructure. An increase in the amount of road<br />
infrastructure from 1955 to 2005 has resulted in some changes to the land uses and channel<br />
planform observed between the years.<br />
The upstream end of Reach BLC-1, the majority of Reach BLC-2 and the northern bank of<br />
Reach BLC-4 were all originally surrounded by agricultural fields in 1955, however by this time,<br />
a new subdivision was being built along the western bank in this area. By 1978, the subdivision<br />
appears to be 50% constructed, and by 2005, the subdivision appears to be completely finished.<br />
This increase in the amount of residential development would be accompanied by an increase in<br />
the impermeability and stormwater runoff of the lands along these banks. There did not appear<br />
to be any change in the channel planform associated with these land use changes. No meanders<br />
bends were lost or created, and no formation or destruction of bars and islands were observed<br />
throughout the 50 years of aerial photography.<br />
In 1955, Reaches BLC-5 and BLC-6 were surrounded by agricultural fields on both the eastern<br />
and western banks. By 1978 the eastern bank was overtaken by fairways and greens constructed<br />
for the International Golf and Country Club. The construction of the golf course continued and<br />
as of the taking of the 2005 aerial photographs, the golf course surrounded Black Creek on both<br />
banks of Reaches BLC-5 and BLC-6. There did not appear to be any change in the planform of<br />
the channel associates with the land use changes and the construction of the golf course.<br />
However, it can be assumed that there was an increase in the amount of stormwater runoff<br />
affecting the channel in these reaches as a result of the land use change prior to 1978.<br />
Except for a slight increase in the amount of residential development near the small hamlet of<br />
Stevensville located in the upstream portion of Reach BLC-9, there did not appear to be any<br />
change in the surrounding land uses or channel planform observed over the 50 years for reaches<br />
BLC7, BLC-8 and BLC-9. The dominant surrounding land use for all three reaches was<br />
agricultural fields observed in 1955 and has continued past 2005, with only a slight increase in<br />
the density of vegetation immediately surrounding the banks of the channel. No bar formations<br />
or islands were observed to have formed or been destroyed between the 50 years of aerial<br />
photography.<br />
There did not appear to be a significant change between 1955 and 2005 that affected Reaches<br />
BLC-11 through BLC-15. The majority of these reaches were surrounded by agricultural fields<br />
in 1955, some of which had been abandoned to scrubland and scrub forest areas as of 1978, with<br />
no observable change in the channel planform reported between the years for most reaches. The<br />
confluence of Reach BLC-14 with Marsh Drain was re-aligned sometime after 1955 however.<br />
The channel was straightened slightly from it original meander form and a large reservoir/duck<br />
pond was created prior to 1978 at this confluence, although the area appears to be off-line. This<br />
area is now known as the Stevensville <strong>Conservation</strong> Area, and a circular drive and parking area<br />
March 2008 35 <strong>Fort</strong> <strong>Erie</strong> <strong>Creeks</strong> <strong>Watershed</strong> <strong>Plan</strong><br />
General Report (105116)
were constructed between 1978 and 2005 to accompany this newer land use. This change in<br />
channel planform resulted in a shorter, straighter section of the watercourse through the<br />
conservation lands.<br />
Reaches BLC-16 and BLC-17 were poorly vegetated scrubland areas in 1955 that were left to<br />
grow and vegetate. By 2005 the land uses had become densely vegetated, forested woodlot areas<br />
that, because of their density made it impossible to characterize any potential channel planform<br />
changes that may have occurred over the 50 year period. Therefore, all that can be stated is that<br />
there was no significant change in surrounding land use that would account for any planform<br />
changes observed in the field.<br />
Reaches BLC-18 and BLC-19 were completely surrounded by agricultural fields in the 1955<br />
aerial photograph. By 1978, some trees had begun to grow and cover the banks of the reaches,<br />
but the dominant land use remained agricultural fields. This still remains true as of the 2005<br />
aerial photographs as well. Although the natural meander planform of the watercourse for<br />
Reaches BLC-18 and BLC- 19 could not be seen in the 1978 aerial photographs, a comparison of<br />
the channel formation present in both 1955 and 2005 suggest that there have been no<br />
modifications made to the planform.<br />
There was no 1955 and 1978 aerial coverage of Reaches BLC-20 through to BLC-32, therefore,<br />
a historical characterization of these reaches could not be completed for this portion of the report.<br />
2.4.2 Work Activities<br />
The desktop mapping and geomorphic assessment, completed at the study outset, provided<br />
insight into the controls, modifying influences and general characteristics of the channels. In<br />
order to secure insight into the condition (e.g. stable, stressed) of the channel, a Rapid<br />
Geomorphic Assessment (RGA) and Rapid Stream Assessment Technique (RSAT) have been<br />
conducted on 23 reaches within the study area (ref. Table 2.4.1).<br />
Rapid Field Assessment<br />
As part of the field evaluation protocol, the purpose of the rapid geomorphic assessment is to<br />
provide a synoptic survey meant to quickly and qualitatively assess channel reaches in order to<br />
identify any specific problems as well as assess overall stability and sensitivity. By walking<br />
each reach in its entirety, areas of active erosion can be documented, basic channel dimensions<br />
can be collected and an understanding of the active channel processes affecting a reach can be<br />
gained. The rapid assessment portion of a <strong>Watershed</strong> study evaluates each reach through the<br />
application of two different channel assessment techniques, the Rapid Geomorphic Assessment<br />
(RGA) and the Rapid Stream Assessment Technique (RSAT). This assessment is generally<br />
completed for all third order and higher reaches within the study area. Depending on the size of<br />
the study area and the goals of the project, however, lower order tributaries may also be included<br />
in the survey.<br />
The stability of each reach has been quantified with an RGA, which documents observed<br />
indicators of channel erosion and deposition (MOE, 1999). Observations are quantified using an<br />
index that identifies channel sensitivity to aggradation, degradation, channel widening and<br />
March 2008 36 <strong>Fort</strong> <strong>Erie</strong> <strong>Creeks</strong> <strong>Watershed</strong> <strong>Plan</strong><br />
General Report (105116)
planimetric adjustment. The index produces values that indicate whether the channel is “in<br />
regime” or stable (0.41).<br />
The RSAT provides a broader view of the system by also considering the ecological functioning<br />
of the stream (Galli, 1996). This includes observations of channel stability, scour/deposition,<br />
instream habitat, water quality, riparian conditions and biological indicators such as the<br />
abundance of benthic invertebrates. Each indicator was ranked numerically, a lower value<br />
indicates poorer stream health and a higher value represents a rich, healthy stream. The RSAT<br />
score ranks the channel as maintaining a low (35) degree of<br />
stream health. Also included in the RSAT are general observations of channel dimensions, such<br />
as bankfull widths and depths, substrate size, bank heights, vegetation cover, channel hardening<br />
and other disturbances.<br />
It should be noted that not all reaches have been walked in entirety due to accessibility and time<br />
constraints, and as a result, Table 2.4.1 represents conditions which partially characterize reaches<br />
which were observed during field reconnaissance in November and December 2005.<br />
Due to the fact that channel processes were inferred in the mapping and aerial photograph<br />
analysis, field conditions were confirmed through a detailed field investigation. As such, the<br />
following sections summarize results obtained from the detailed geomorphic assessment.<br />
Detailed Site Assessment<br />
Utilizing the combined RGA and RSAT scores, four reaches were chosen for more extensive<br />
characterization. Initially, five detailed sites were chosen (one on each creek) however, due to<br />
the marsh/backwater state of Beaver Creek; only one monitoring site was established in Reach<br />
BVC-2.<br />
The location of the detailed sites was determined based on the objective to provide representative<br />
coverage of the watershed, both from a spatial and morphologic perspective. Reach BLC-9 was<br />
chosen to provide conditions representative of Black Creek, while Reach SMC-2 was meant to<br />
provide representative data for Six Mile Creek (downstream end). Reaches FRC-9 and MLC-3<br />
provided insight into conditions along a particularly sensitive and geomorphologically active<br />
section of the Local Management Area of 2.18. Finally, BVC-2 was chosen to represent<br />
conditions at the downstream extent of the Beaver Creek where only 1 monitoring site was<br />
established.<br />
At each of the detailed sites, cross-sections were measured at ten locations, including pools,<br />
riffles and transitional areas. At each cross-section, bankfull widths and depths, entrenchment,<br />
as well as low flow dimensions were recorded. Substrate was sampled using a modified Wolman<br />
pebble count. Sub-pavement was also characterized at each cross-section. Bank assessment<br />
included measurements of heights, angle, bank composition, in-situ shear strength, vegetation<br />
and rooting depths. These 10 cross-sections were placed over a minimum of two meander<br />
wavelengths and included one control cross section located at top of bank. This control cross<br />
section involved the installation of permanent pins in order to allow for future monitoring.<br />
Erosion pins were also installed at each site to monitor rates of migration within the reach. A<br />
March 2008 37 <strong>Fort</strong> <strong>Erie</strong> <strong>Creeks</strong> <strong>Watershed</strong> <strong>Plan</strong><br />
General Report (105116)
level survey of the site extending upstream and downstream of the 10 cross-section locations was<br />
also conducted. The survey included bankfull elevations, maximum pool depths, top and bottom<br />
of riffles and any obstruction to flow and provided measures of energy gradient, inter-pool<br />
gradient and riffle gradient. Results of the detailed field investigation are summarized in the site<br />
descriptions for each reach which was assessed over the course of field reconnaissance<br />
completed in between November and December 2005.<br />
2.4.3 Findings/Constraint Identification<br />
Rapid Field Assessment<br />
Based on the results obtained from the rapid field assessment, channel stability and health of a<br />
variety of reaches contained in the study area were summarized in Table 2.4.1 (ref. Figure WS-2<br />
and Appendix ‘WC-B’ for reach locations). The rapid assessment method of evaluating<br />
geomorphic conditions on a watershed-scale through the scoring of individual reaches supports<br />
the selection of representative detailed field sites from both a spatial and morphologic standpoint.<br />
As such, the Reach Names which were bolded in Table 2.4.1 indicate the reaches where detailed<br />
field work was conducted. It should be noted that the site selection for the detailed work was<br />
impart attributed to the health and stability of the reach, in addition to the accessibility of the site.<br />
TABLE 2.4.1:<br />
RAPID FIELD ASSESSMENT SUMMARY FOR FORT ERIE WATRSHED<br />
RSAT<br />
Creek Reach Name RSAT SCORE<br />
RGA SCORE<br />
RGA<br />
CONDITION<br />
CONDITION<br />
BLACK CREEK BLC-1 21 MODERATE 0.20 IN REGIME<br />
BLC-2 21 MODERATE 0.21 IN REGIME<br />
BLC-5 23 MODERATE 0.21 IN REGIME<br />
BLC-6 23 MODERATE 0.21 IN REGIME<br />
BLC-7 22 MODERATE 0.18 IN REGIME<br />
BLC-8 22 MODERATE 0.18 IN REGIME<br />
BLC-9 19.5 LOW 0.37 TRANSITIONAL<br />
BLC-10 16 LOW 0.19 IN REGIME<br />
BEAVER CREEK BVC-2 24.00 MODERATE 0.30 TRANSITIONAL<br />
BVC-3 24.50 MODERATE 0.22 TRANSITIONAL<br />
SIX MILE CREEK F.E. SMC-1 23 MODERATE 0.25 TRANSITIONAL<br />
SMC-2 22.5 MODERATE 0.24 TRANSITIONAL<br />
SMC-3 23 MODERATE 0.18 IN REGIME<br />
FRENCHMAN’S CREEK FRC-1 20 MODERATE 0.27 TRANSITIONAL<br />
FRC-2 22.5 MODERATE 0.29 TRANSITIONAL<br />
FRC-3 22.5 MODERATE 0.2 IN REGIME<br />
FRC-5 14 LOW 0.21 TRANSITIONAL<br />
FRC-8 22 MODERATE 0.30 TRANSITIONAL<br />
FRC-9 14 LOW 0.39 TRANSITIONAL<br />
FRC-10 26.5 MODERATE 0.32 TRANSITIONAL<br />
MILLER CREEK MLC-1 20.5 MODERATE 0.15 IN REGIME<br />
MLC-2 23.5 MODERATE 0.11 IN REGIME<br />
MLC-3 26 MODERATE 0.34 TRANSITIONAL<br />
March 2008 38 <strong>Fort</strong> <strong>Erie</strong> <strong>Creeks</strong> <strong>Watershed</strong> <strong>Plan</strong><br />
General Report (105116)
Detailed Site Assessment<br />
The results from the Detailed Site Assessment are documented in Appendices ‘WC-B’, ‘WC-C’,<br />
and ‘WC-D’, where cross-sectional, bank, planform and substrate characteristics are provided.<br />
This field assessment has enabled the quantification of channel processes and functions such as<br />
linkages to floodplains which occur at the cross-section and reach scale. The collected data will<br />
also be suitable for detailed analyses of sediment transport, channel thresholds and stability.<br />
In addition to the Detailed Site Assessment, the Appendices ‘WC-B’, ‘WC-C’, and ‘WC-D’<br />
include detailed reach descriptions, as well as a summary of the site conditions which were either<br />
observed during the “road-side” assessment or through the completion of detailed field work.<br />
These descriptions provide a synopsis of the present geomorphic conditions which were recorded<br />
during field reconnaissance completed in November and December 2005, as well as in the<br />
Summer of 2006. As such, the reach descriptions only present a snap-shot of the present field<br />
conditions, and may not typify the exact watercourse conditions for the entire reach.<br />
The aforementioned significant features are some of the factors imposing a risk to the channel<br />
and its stability. Although results documented in Table 2.4.1 illustrate additional reaches having<br />
low channel stability, there were no significant features within the proximity of these systems<br />
which would have resulted in the present condition of the channel.<br />
Importance:<br />
2.5 Fish and Aquatic Habitat<br />
Aquatic resources include aquatic habitats and the communities of organisms which they<br />
support. Investigations are focused on fish and fish habitat. Fish populations and communities<br />
are indicators of ecosystem health, and angling is a popular form of outdoor recreation. Fish<br />
habitat is protected under the Fisheries Act.<br />
2.5.1 Background Information<br />
• “<strong>Niagara</strong> Regional Municipality, Fish Habitat Types with Management Rationale”<br />
(MNR, February 25, 2000)<br />
• 2003, 2004 and 2005 fish collection data from the MNR, Vineland Office.<br />
• Royal Ontario Museum historical fish collection data.<br />
• Colour digital aerial photography.<br />
• Map showing potential barriers to fish migration (NPCA).<br />
• Known spawning locations for musky (NPCA).<br />
• Known spawning locations for smallmouth bass in Lake <strong>Erie</strong> from MNR (Brunet et al,<br />
1987).<br />
• Proposed Environmental Policies Natural Heritage Map that includes fish habitat<br />
mapping (Regional Municipality of <strong>Niagara</strong> website).<br />
• Fisheries and habitat information for drains (NPCA)<br />
• Friends of <strong>Fort</strong> <strong>Erie</strong> <strong>Creeks</strong> 2004 Summer Work Report.<br />
March 2008 39 <strong>Fort</strong> <strong>Erie</strong> <strong>Creeks</strong> <strong>Watershed</strong> <strong>Plan</strong><br />
General Report (105116)
Field Investigations<br />
2.5.2 Work Activities<br />
The large study area, with many hundreds of kilometres of watercourses, necessitated a scoped,<br />
efficient and effective approach to field investigations. This focused on the information required<br />
to characterize the watershed’s aquatic resources at a relatively coarse scale. Generally, effort<br />
was directed toward fish community characterization in areas where the fish community was<br />
largely unknown, the investigation of barriers to fish migration, and in gathering additional<br />
habitat detail to refine the watercourse descriptions, the characterization of constraints, and the<br />
identification of rehabilitation opportunities. It was not possible to inventory specific habitats<br />
(i.e. pike spawning habitats) at the level of this subwatershed study.<br />
An initial field reconnaissance was undertaken during the fall of 2005, but the primary field<br />
investigations occurred in the spring and summer of 2006, when spawning, general habitat, fish<br />
migrations, and fish communities were investigated. Twenty-two locations were electrofished on<br />
April 25 and 26, 2006, to generally characterize spring fish communities, and provide basic fish<br />
community information over the portions of the study area not sampled by the regular MNR<br />
sampling program. An iterative process between aerial photographic interpretation and field<br />
investigation/ground truthing was undertaken to characterize stream habitat over the entire study<br />
area. During all these investigations many hundreds of digital photographs were taken at<br />
associated coordinates determined with a hand-held GPS unit, to facilitate habitat<br />
characterization and the determination of constraints and opportunities.<br />
The information gathered throughout the winters of 2005/2006 and 2006/2007, as well as the<br />
results of the field investigations, have been compiled and analyzed. The general results are<br />
provided in Section 2.5.3. A copy of the data collection sheets, waypoint chart, and a CD<br />
containing all of the photos are included in Appendix ‘NH-B’.<br />
Overview<br />
2.5.3 Findings/Constraint Identification<br />
The clay soils and relatively flat topography of the study area has resulted in generally low<br />
gradient watercourses and swamp habitats. This has resulted in few barriers to fish movement,<br />
either at natural topographic breaks or at infrastructure crossings such as roads, railways,<br />
pipelines, etc. Black, Beaver, and Baker <strong>Creeks</strong> are the lowest gradient watercourses, while the<br />
remainder have slightly higher gradients that are reflected in their fish communities.<br />
Instream habitat diversity within the study area can generally be characterized as below average.<br />
Rather than being a mix of low gradient (flatwater and sluggish), medium gradient (runs and<br />
short riffle sections) and high gradient (long sections of riffles and rapids), watercourses in the<br />
study area are mostly low-gradient, and many sections have been dredged and/or straightened to<br />
facilitate the drainage of agricultural and residential land. While there are many areas of good<br />
quality flatwater habitat, and occasionally sections of watercourse with coarse substrates and<br />
higher gradient riffle or run habitats, the study area watercourses are usually variations of<br />
flatwater habitats as illustrated in the map of instream habitats (ref. Figure AB-1).<br />
March 2008 40 <strong>Fort</strong> <strong>Erie</strong> <strong>Creeks</strong> <strong>Watershed</strong> <strong>Plan</strong><br />
General Report (105116)
The close proximity of the diverse aquatic habitats and communities found in the <strong>Niagara</strong> River<br />
and Lake <strong>Erie</strong> habitats, and the presence of a number of fish species that are at the northern limit<br />
of their range in southern Ontario, but are more widely distributed in the United States, result in<br />
study area watercourses having diverse low-gradient, warm- and cool-water fish communities.<br />
Typical of most watercourses, fish community diversity in the study area generally decreases as<br />
one moves farther upstream, however, some fish species that are typical residents of larger lakes<br />
or rivers and would not normally be found in streams, are also found significant distances from<br />
the <strong>Niagara</strong> River and Lake <strong>Erie</strong> in the low-gradient watercourses of the study area. Some of the<br />
common fish species found here only occur in the extreme southern part of Ontario. At least two<br />
fish species-at-risk (river redhorse and grass pickerel), and potentially others, are known to occur<br />
within the study area. The common and scientific names of fishes discussed in this report are<br />
listed in Tables 2.5.1 and 2.5.2.<br />
The Ministry of Natural Resources (Vineland Office) has classified fish habitat in all the main<br />
watercourse channels in the <strong>Niagara</strong> Region (ref. “Fish Habitat Types with Management<br />
Rationale, <strong>Niagara</strong> Regional Municipality”, MNR, February 25, 2000). The fish<br />
communities/habitat definitions in this document are as follows (ref. Appendix ‘NH-A’ for full<br />
definitions).<br />
Type 1: areas that limit the overall productive capacity (i.e. if these areas are harmfully altered<br />
the productive capacity of the area would be reduced). Sensitive fish species (part or all of their<br />
life cycle) and/or habitats are present (including springs, seeps, upwelling areas, seasonally<br />
inundated spawning habitats, refugia, nursery areas, over-wintering areas, and ephemeral pools).<br />
These areas require a high degree of protection, however may also be enhanced with care, and<br />
can achieve a high potential for habitat compensation.<br />
Type 2: this habitat is important but below its productive capacity and is ideal for enhancement<br />
or restoration projects. Sensitive species may or may not be present part or all of the time. Fish<br />
community is below potential due to habitat related issues, however may be increased if the<br />
limiting factors are reversed.<br />
Type 3: areas with low productive capacity, where common species may or may not be present,<br />
and no sensitive species and/or specialized habitat are present (incidental exceptions of fish<br />
presence may occur in some locations, e.g. the Welland Shipping Canal). Areas can negatively<br />
affect downstream, down-drift or connected fish habitats, and should not be considered for<br />
compensation opportunities.<br />
The standard DFO system, supported by MNR, groups fish habitat into three classes (DFO 1998,<br />
MNR 1999). These are:<br />
Critical Habitat: those fisheries habitats which have high productive capacity, are rare, highly<br />
sensitive to development, or have a critical role in sustaining fisheries (e.g., spawning and<br />
nursery areas for some species, and ground water discharge areas).<br />
Important Habitat: those fisheries habitats which are moderately sensitive to development and,<br />
although important to the fish population, are not considered critical (e.g. feeding areas, and open<br />
water habitats of lakes).<br />
March 2008 41 <strong>Fort</strong> <strong>Erie</strong> <strong>Creeks</strong> <strong>Watershed</strong> <strong>Plan</strong><br />
General Report (105116)
Marginal Habitat: those fisheries habitats which have low productive capacity or are highly<br />
degraded, and do not currently contribute directly to fish productivity. They often have the<br />
potential to be improved significantly (e.g., a portion of a waterbody, such as a channelized<br />
stream, that has been highly altered physically).<br />
Figure AB2 presents the MNR assigned classes for watercourses within the study area and<br />
Figure AB-1 presents the findings of the field inventory and observed characteristics of the<br />
watercourses.<br />
Black Creek<br />
Black Creek is the largest watercourse within the study area. It is approximately 21 km long, and<br />
drains approximately 50% of the study area. The difference in elevation from the source of Black<br />
Creek to its mouth is only about 8.5 m. Black Creek is approximately 30 m wide just upstream<br />
from its mouth at the <strong>Niagara</strong> River. The lower 6.2 km of Black Creek is essentially flat water,<br />
with the next 5 km upstream having a somewhat higher gradient as indicated by shallower water<br />
with runs, a few pools, and a few gentle riffles (ref. Figure AB-1). The upper 10 km of Black<br />
Creek has a very low gradient, with portions of the watercourse apparently artificially deepened<br />
to facilitate drainage of the large headwater swamp, known as Humberstone Marsh. The Black<br />
Creek channels within Humberstone Marsh are straight, and may be largely artificial.<br />
All of the main Black Creek channels are classed by the MNR as Critical Habitat, with the<br />
exception of a few small tributaries in the lower watershed, and the headwater areas within and<br />
upstream of Humberstone Marsh, which are classed by the MNR as Important Habitat (ref.<br />
Figure AB-2). Muskellunge spawning habitat has been identified in the <strong>Niagara</strong> River adjacent to<br />
the mouth of Black Creek (ref. Figure AB-2).<br />
The fish community within Black Creek is typical of a low-gradient, warmwater stream, of<br />
moderate size in this part of Ontario, dominated by Centrarchids (largemouth bass, rock bass,<br />
sunfishes, crappies), bullheads, common white sucker, certain minnow species, and Esocids<br />
(northern pike, grass pickerel, and muskellunge in Tables 2.5.1 and 2.5.2.). The northern pike<br />
and grass pickerel spawn in shallow or flooded areas over vegetation in early spring (Becker,<br />
1983; Scott and Crossman, 1973), and would likely find numerous locations to spawn along the<br />
margins and in the headwaters of this low-gradient stream. Gizzard shad, which inhabit the open<br />
waters of larger rivers and lakes, are known to ascend smaller streams or ditches to spawn and<br />
the young are later abundant in such places if the gradient is sufficiently low (Becker, 1983).<br />
Young-of-the-year (YOY) gizzard shad were found on several occasions during summer as far as<br />
10 km upstream in Black Creek (ref. Figure AB-1). Emerald shiners, typically a fish of large<br />
water such as the <strong>Niagara</strong> River or Lake <strong>Erie</strong>, but often migrate short distances up watercourses<br />
(Becker, 1983) with low gradients until being blocked by some barrier, were collected in the<br />
headwaters of Black Creek in Humberstone Marsh in April 2006, attests to the low gradient of<br />
this stream and the lack of barriers to fish movement (Table 2.5.1 CPA 2006 collections).<br />
Beaver Creek<br />
Beaver Creek is the largest tributary of Black Creek, and is approximately 14 km long. The first<br />
kilometre from the outlet of Beaver Creek, is a broad flatwater channel with an almost<br />
continuous marsh along each side. Upstream from there, Beaver Creek flows through a broad<br />
March 2008 42 <strong>Fort</strong> <strong>Erie</strong> <strong>Creeks</strong> <strong>Watershed</strong> <strong>Plan</strong><br />
General Report (105116)
iparian swamp for approximately 11 km (ref. Figure AB-1). Only the upper 2 km is not in<br />
swamp, and that is where about half of the elevation difference of approximately 12 m between<br />
the headwaters and the mouth occurs. As a result of the bordering wetlands, Beaver Creek has<br />
less encroachment by agriculture and residential land uses, with very few sections of straightened<br />
or otherwise altered channel.<br />
All the Beaver Creek channels that are classified by the MNR, are classed as Type 1 Critical<br />
Habitat (ref. Figure AB-2).<br />
The fish community within Beaver Creek is typical of a low-gradient, warmwater stream in this<br />
part of Ontario, dominated by Centrarchids (largemouth bass, rock bass, sunfishes), bullheads,<br />
common white sucker, certain minnow species, and Esocids (northern pike, grass pickerel)<br />
(Table 2.5.1 CPA 2006 collections, Tables 2.5.2 and 2.5.3). Suitable spawning habitat for<br />
Esocids is likely to be present along the swampy margins of this low-gradient stream.<br />
Baker Creek<br />
Baker Creek has one of the smallest watersheds in the study area, and is approximately 4 km<br />
long from mouth to headwater. The lower 0.5 km or so is a flatwater stream at the level of the<br />
<strong>Niagara</strong> River. Upstream of here most of Baker Creek is bordered by a swamp. Judging by the<br />
forest growth and the sections of straightened channel throughout, the swamp appears to be<br />
regenerating from past attempts at agriculture. It appears that most of the channels in the upper<br />
swamp portions of the watershed are either constructed or straightened natural channels<br />
(ref. Figure AB-1).<br />
All the Baker Creek channels that are classified by the MNR are classed as Type 1/Critical<br />
Habitat (ref. Figure AB-2).<br />
The fish community within Baker Creek has been adequately sampled by the MNR at its mouth<br />
at the <strong>Niagara</strong> River, and sampled approximately 1.7 km upstream from the mouth by the ROM<br />
in 1974 and as part of this study in April 2006 (Table 2.5.1 CPA 2006 collections, Tables 2.5.2<br />
and 2.5.3). It appears that the fish community of Baker Creek is typical of a small, low-gradient,<br />
warmwater stream in this part of Ontario, and is similar to the fish communities in Black and<br />
Beaver <strong>Creeks</strong>. Suitable spawning habitat for Esocids is likely to be present along the swampy<br />
margins of this low-gradient stream. Emerald shiners were collected 1.7 km upstream of the<br />
mouth in April 2006, attesting to the low gradient and barrier-free condition of the downstream<br />
sections of watercourse.<br />
Miller Creek<br />
Miller Creek is approximately 7.5 km long from its headwaters to its mouth at the <strong>Niagara</strong> River.<br />
The elevation difference over this length is approximately 23 m, and consequently Miller Creek<br />
has a higher gradient than the other watercourses (ref. Figure AB-1). The surrounding land is<br />
also better drained. The watercourse generally flows through woodlands except for a few<br />
portions in the lower 1 km where residential properties line the bank, and about another 1.5 km<br />
of watercourse that is bordered by agricultural lands. Much of Miller Creek appears to have a<br />
March 2008 43 <strong>Fort</strong> <strong>Erie</strong> <strong>Creeks</strong> <strong>Watershed</strong> <strong>Plan</strong><br />
General Report (105116)
natural channel, except for a 1.3 km straightened portion immediately upstream of the QEW, and<br />
a 1.5 km straightened portion downstream of Bowen Road.<br />
All the Miller Creek channels that are classified by the MNR are classed as Type 1/Critical<br />
Habitat, except for one small tributary and a small portion of headwater that are classed as<br />
Important Habitat (ref. Figure AB-2). Muskellunge spawning habitat has also been identified in<br />
the <strong>Niagara</strong> River adjacent to the mouth of Miller Creek (ref. Figure 2.5.16).<br />
The fish community within Miller Creek is typical of a small, low-gradient, warmwater stream in<br />
this part of Ontario, dominated by Centrarchids (largemouth bass, rock bass, sunfishes),<br />
bullheads, common white sucker, certain minnow species, and Esocids (northern pike, grass<br />
pickerel) (Table 2.5.1 CPA 2006 collections, Tables 2.5.2 and 2.5.3). The northern pike and<br />
grass pickerel spawn in shallow or flooded areas over vegetation in early spring (Becker, 1983;<br />
Scott and Crossman, 1973), and would likely find locations to spawn in flooded areas along the<br />
stream margins or in attached wetlands. The presence of creek chub (Table 2.5.2: MI-3; and<br />
Table 2.5.3: ROM-6) may reflect the higher gradient with some granular substrate in portions of<br />
this watercourse.<br />
Frenchman’s Creek<br />
Frenchman’s Creek is approximately 13.2 km long from its headwaters to its mouth at the<br />
<strong>Niagara</strong> River. The elevation difference over this length is approximately 25 m. Approximately<br />
half of Frenchman’s Creek is situated in woodlands, with most of the rest in golf courses,<br />
agricultural fields, and within transportation corridors. The creek flows for approximately 650 m<br />
through a swamp located about 1.2 km upstream from the <strong>Niagara</strong> River. There are some small<br />
areas of swamp along the creek, but the next sizeable swamp is approximately 8.8 km upstream,<br />
west of the QEW. There is also a swamp in the extreme headwaters. This is referred to as the<br />
“Upper Frenchman’s Creek Wetland Complex”, and was documented most recently by the MNR<br />
on October 28, 2004. The channel appears to be mostly natural downstream of the QEW, which<br />
comprises about 70% of the watercourse length, with the remainder upstream of the QEW a<br />
mixture of natural and straightened channels (ref. Figure AB-1 ). A range of substrates were<br />
observed, including silt or mud, sand, cobble/gravel and bedrock.<br />
All the Frenchman’s Creek channels that are classified are classed by the MNR as<br />
Type 1/Critical Habitat, except for five small tributaries downstream of the QEW that are<br />
classed as Type 2/Important Habitat (ref. Figure AB-2). Muskellunge spawning habitat has also<br />
been identified in the <strong>Niagara</strong> River adjacent to the mouth of Frenchman’s Creek (ref.<br />
Figure AB-2).<br />
The fish community within the downstream kilometre of Frenchman’s Creek is typical of a lowgradient,<br />
warmwater stream in this part of Ontario, with community diversity enhanced due to<br />
the close proximity of the <strong>Niagara</strong> River (Table 2.5.2: FR-1 and FR-2). Upstream of this the fish<br />
community reflects the variety of habitats present, with fishes that prefer slower, deeper waters,<br />
such as brown bullhead, largemouth bass, and sunfishes, and others that prefer or require faster<br />
waters with coarse substrates, such as longnose dace and creek chub.<br />
March 2008 44 <strong>Fort</strong> <strong>Erie</strong> <strong>Creeks</strong> <strong>Watershed</strong> <strong>Plan</strong><br />
General Report (105116)
Kraft Drain<br />
Kraft Drain has one of the smallest watersheds in the study area, and is approximately 3 km long<br />
from its headwater to its mouth at Lake <strong>Erie</strong>. The headwaters are approximately 15 m in<br />
elevation above Lake <strong>Erie</strong>. The first 0.5 km upstream from the mouth is a meandering<br />
watercourse through a lakeside residential area and a small strip of woodland. Upstream of here<br />
the watercourse has been straightened and ditched (ref. Figure AB-1). The lower half of this<br />
straightened portion is surrounded by a swamp, which appears to be regenerating from past<br />
attempts at agriculture, judging by the growth of tree cover and the appearance of the land in the<br />
aerial photography. The meandering channel of the original watercourse can be discerned in the<br />
aerial photographs to the east of the straightened channel. The upstream half of the straightened<br />
portion of watercourse is situated in a mainly open, though currently inactive, agricultural area.<br />
All the Kraft Drain channels that are classified by the MNR, are classed as Type 3/Marginal<br />
Habitat (ref. Figure AB-2).<br />
The downstream portion of Kraft Drain has a relatively diverse community of fishes, with 15<br />
species captured in April 2006 (Table 2.5.1: CPA-18 and CPA-19, CPA 2006 collections). Two<br />
of these species (spottail shiner and emerald shiner) are typically lake or large river fishes, but<br />
also typically enter smaller tributary streams during the spring. Evidence of groundwater inputs<br />
to Kraft Drain in the straightened channel just downstream of CPA-19 suggests that this<br />
relatively diverse fish community, compared to the generally lower diversity of fish communities<br />
in other study area watercourses or tributaries of the same size, may be due in part to cooler<br />
water temperatures and the presence of flow during the dry part of summer. The presence of<br />
adult white suckers in April, 2006, and suitable white sucker spawning substrate in the vicinity<br />
and downstream of Dominion Road, indicates that this watercourse is a spawning area for white<br />
sucker.<br />
Six Mile Creek<br />
Six Mile Creek is the largest watershed within the study area that flows to Lake <strong>Erie</strong>. It has<br />
several branches, but it is approximately 7 km from the mouth to the headwater following the<br />
longest branch. The maximum headwater elevation is about 20 m above the level of Lake <strong>Erie</strong>.<br />
For most of the first 2 km upstream from Lake <strong>Erie</strong>, Six Mile Creek meanders within a swampy<br />
corridor, though it is evident that some reaches have been straightened (ref. Figure AB-1).<br />
Upstream of this the watercourse splits into two branches of approximately equal size, with each<br />
of these splitting again less than a kilometre farther upstream. Most of these upstream channels<br />
are fairly small, and are composed of both naturally meandering and straightened sections,<br />
situated within active and inactive agricultural lands, including some areas that appear to be in<br />
the process of reverting to swamp habitat. A variety of substrate and low-gradient fish habitat<br />
types were observed. Historically, Six Mile Creek appears to have been heavily impacted by<br />
agricultural encroachment, but in many places is in the process of re-naturalizing.<br />
All the Six Mile Creek channels that are classified by the MNR are classed as Type 1/Critical<br />
Habitat (ref. Figure AB-2). Areas identified as smallmouth bass spawning habitat occur in Lake<br />
<strong>Erie</strong> (ref. Figure AB-2).<br />
March 2008 45 <strong>Fort</strong> <strong>Erie</strong> <strong>Creeks</strong> <strong>Watershed</strong> <strong>Plan</strong><br />
General Report (105116)
The fish community in the lower portion of Six Mile Creek, in the deeper pond-like section from<br />
the mouth at Lake <strong>Erie</strong> to the vicinity of Dominion Road, is diverse with a combination of 16<br />
species of fish captured from two locations. Five fish species were captured over two locations<br />
in the upper portion of the watershed, and no fish were captured or observed at the most northern<br />
location fished. As is often found in low gradient watercourses connected to lakes, the fish<br />
community was a mix of stream and lake species. The presence of white sucker suggests that this<br />
watercourse may be used by this species for spawning, however, suitable coarse substrates may<br />
be in short supply. Along with the capture of 3 yearling quillback in the vicinity of Dominion<br />
Road, the habitat in the lower portion of Six Mile Creek corresponds to the description of<br />
quillback spawning habitat in Scott and Crossman (1973), suggesting that this may be a<br />
spawning area for this species (Table 2.5.1 CPA 2006 Collections).<br />
March 2008 46 <strong>Fort</strong> <strong>Erie</strong> <strong>Creeks</strong> <strong>Watershed</strong> <strong>Plan</strong><br />
General Report (105116)
TABLE 2.5.1:<br />
C. PORTT AND ASSOCIATES 2006 FISH COLLECTION<br />
Common name Scientific name CPA-1 CPA-2 CPA-3 CPA-4 CPA-5 CPA-6 CPA-7 CPA-8 CPA-9 CPA-10 CPA-11 CPA-12 CPA-13 CPA-14 CPA-15 CPA-16 CPA-17 CPA-18 CPA-19 CPA-20 CPA-21 CPA-22<br />
banded killifish Fundulus diaphanus 2 1 6 1<br />
spottail shiner Notropis hudsonius 2 17 5<br />
emerald shiner Notropis atherinoides >100 >100 1 + 21* 63 4 >400 1 48<br />
sand shiner Notropis stramineus 1 20<br />
mimic shiner Notropis volucellus 1<br />
striped shiner Luxilus chrysocephalus 4<br />
common shiner Luxilus cornutus 1 1 3 1<br />
spotfin shiner Cyprinella spiloptera 3 2 14 19<br />
bluntnose minnow Pimephales notatus 2 25 38** 52 4 3<br />
fathead minnow Pimephales promelas 3 1 1 1 3<br />
creek chub Semotilus atromaculatus 26** 15<br />
northern pike Esox lucius 1<br />
central mudminnow Umbra limi 2 4 3 1 4<br />
pumpkinseed Lepomis gibbosus 5 4 1 2* 10 3 2 1 3 1 1 2 1<br />
quilback Carpiodes cyprinus 3<br />
common carp Cyprinus carpio 2* 3<br />
white sucker Catostomus commersonii 2 1* 2* 2 2 1 3** 5 1<br />
green sunfish Lepomis cyanellus 2 2 17 3 1 3 2 3 3 4 2<br />
round goby Neogobius melanostomus 6<br />
grass pickerel Esox americanus vermiculatus 10 1** 2 1 1<br />
rock bass Ambloplites rupestris 1<br />
golden shiner Notemigonus crysoleucas 3* 1 1<br />
largemouth bass Micropterus salmoides 2* 1 1 5* 1 4* 2 3<br />
tadpole madtom Noturus gyrinus 1<br />
rudd Scardinius erythrophthalmus 1<br />
* juvenile fish<br />
** others were observed but not captured<br />
March 2008 47 <strong>Fort</strong> <strong>Erie</strong> <strong>Creeks</strong> <strong>Watershed</strong> <strong>Plan</strong><br />
General Report (105116)
TABLE 2.5.2:<br />
RECENT MINISTRY OF NATURAL RESOURCES FISH COLLECTIONS, 2003 - 2005, FORT ERIE.<br />
(ref. FIGURE AB-1)<br />
Location (see key below) BL-1 BL-2 BL-3 BL-4 1 BE-1 BE-2 BA-1 MI-1 MI-2 MI-3 FR-1 FR-2 1 FR-3 FR-4 FR-5 1 FR-6 FR-7 FR-8 FR-9 FR-10<br />
Number of collections 1 7 3 6 1 1 3 1 2 2 1 4 1 1 2 1 1 1 1 1<br />
Collection method<br />
EF 6 seine<br />
seine seine seine seine seine seine seine 1 seine EF<br />
boat 1 EF<br />
1 EF boat<br />
seine EF EF EF EF EF EF EF EF<br />
Years 2004 2003-5 2003-5 2003-5 2003 2003 2003-5 2003 2003,5 2003,4 2004 2003-5 2003 2003 2003 2003 2003 2003 2003 2003<br />
gizzard shad (Dorosoma cepedianum) X X X<br />
longnose gar (Lepisosteus osseus) X<br />
northern pike (Esox lucius) X X X X X X X X X X X<br />
muskellunge (Esox masquinongy) X X X<br />
grass pickerel (Esox americanus vermiculatus) X X X X X X X X<br />
central mudminnow (Umbra limi) X X X X X X X X X X X<br />
carp (Cyprinus carpio) X X X X X X X X X X X<br />
goldfish (Carassius auratus) X X X X X X X<br />
common shiner (Luxilus cornutus) X X X X X X<br />
striped shiner (Luxilus chrysocephalus) X<br />
golden shiner (Notemigonus crysoleucas) X X X X X X X X X X X X<br />
emerald shiner (Notropis atherinoides) X X X X X X<br />
fathead minnow (Pimephales promelas) X X X X X<br />
bluntnose minnow (Pimephales notatus) X X X X X X X X X X X X<br />
creek chub (Semotilus atromaculatus) X X X X X X X X X X<br />
longnose dace (Rhinichthys cataractae) X<br />
common white sucker (Catostomus commersonii) X X X X X X X X X X X X X X X X X<br />
shorthead redhorse (Moxostoma macrolepidotum) X<br />
silver redhorse (Moxostoma erythrurum) X<br />
redhorse (Moxostoma sp.) X X<br />
brown bullhead (Ameiurus nebulosus) X X X X X X X X X X X X X X X<br />
black bullhead (Ameiurus melas) X X X X X X<br />
yellow bullhead (Ameiurus natalis) X<br />
tadpole madtom (Noturus gyrinus) X X X X X X X<br />
yellow perch (Perca flavescens) X X X X X X X X X X X X X<br />
johnny darter (Etheostoma nigrum) X X X X X X X X X X X X X<br />
walleye (Sander vitreus) X<br />
largemouth bass (Micropterus salmoides) X X X X X X X X X X X X X<br />
smallmouth bass (Micropterus dolomieu) X X X<br />
rock bass (Ambloplites rupestris) X X X X X X X X<br />
pumpkinseed (Lepomis gibbosus) X X X X X X X X X X X X X X X<br />
bluegill (Lepomis macrochirus) X X X X X X X X X<br />
green sunfish (Lepomis cyanellus) X X X X X X X X X X X X X<br />
white crappie (Pomoxis annularis) X X X X X<br />
black crappie (Pomoxis nigromaculatus) X X X<br />
brook silverside (Labidesthes sicculus) X<br />
bowfin (Amia calva) X X X<br />
banded killifish (Fundulus diaphanus) X X X<br />
round goby (Neogobius melanostomus) X X X<br />
trout-perch (Percopsis omiscomaycus) X<br />
white perch (Morone americanus) X<br />
1 Combination of two MNR fishing sites located within 100 m of each other.<br />
BL = Black Creek. MI = Miller Creek.<br />
BE = Beaver Creek.<br />
FR = Frenchman’s Creek.<br />
BA = Baker Creek.<br />
March 2008 48 <strong>Fort</strong> <strong>Erie</strong> <strong>Creeks</strong> <strong>Watershed</strong> <strong>Plan</strong><br />
General Report (105116)
TABLE 2.5.3:<br />
ROYAL ONTARIO MUSEUM FISH COLLECTIONS, FORT ERIE<br />
(ref. FIGURE AB-1)<br />
Station ROM-1 ROM-2 ROM-3 ROM-4 ROM-5 ROM-6 ROM-7 ROM-8<br />
Watercourse Black Cr Black Cr Black Cr Beaver Cr Baker Cr Miller Cr Frenchman’s Cr Six Mile Cr<br />
Number of collections at location 2 1 1 1 1 1 1 1<br />
Year 1974 1974 1974 1974 1974 1974 1974 1976<br />
grass pickerel X X<br />
central mudminnow X X X X X X X<br />
goldfish<br />
X<br />
golden shiner X X<br />
emerald shiner X X<br />
bluntnose minnow<br />
X<br />
creek chub<br />
X<br />
common white sucker<br />
X<br />
brown bullhead X X<br />
black bullhead X X<br />
yellow bullhead<br />
X<br />
tadpole madtom<br />
X<br />
pumpkinseed X X X X X X X<br />
2.5.4 Summary of Significant Features/Constraints<br />
The majority of watercourses within the study area contain good quality, low gradient<br />
warmwater aquatic habitat, with the exception of recently straightened and/or cleaned<br />
watercourses. Where adequate sampling has occurred, fish communities have been found to be<br />
appropriately diverse for the existing habitat, indicating that the aquatic ecosystems are generally<br />
healthy.<br />
The sampling conducted by C. Portt and Associates as part of the study, and those undertaken by<br />
MNR are considered to be adequate since they attempted to collect all fish in available habitats<br />
within an area that was within a short distance of the access point. The Royal Ontario Museum<br />
(R.O.M.) records however, are not considered to be adequate to describe fish community since<br />
the cataloguing of specimens is focussed on the needs of the museum collection, and therefore<br />
not all of the species captured at a location are catalogued.<br />
Setbacks from the top-of-bank of watercourses will pose constraints to development. MNR<br />
setback requirements are 30 m from the top of bank for Critical Habitats, and 15 m for both<br />
Important and Marginal Habitats (Ian Barrett, Fisheries Biologist, NPCA. Pers. Comm.,<br />
February 28, 2006). Where no top-of-bank is delineated, some definable standard such as the<br />
waterline of a two-year return flow event is suggested (Ian Barrett, Fisheries Biologist, NPCA<br />
pers. comm., February 28, 2006).<br />
Where watercourse crossings or other works that may potentially impact fish habitat are<br />
required, consideration under the Fisheries Act is required.<br />
2.6 Natural Heritage System<br />
Natural areas provide habitat, moderate floods, filter pollutants, uptake carbon dioxide, offer<br />
shade and wind protection, reduce costs of energy and of water infrastructure and provide<br />
recreation and beauty.<br />
March 2008 49 <strong>Fort</strong> <strong>Erie</strong> <strong>Creeks</strong> <strong>Watershed</strong> <strong>Plan</strong><br />
General Report (105116)
Characterization of the natural heritage system in the <strong>Fort</strong> <strong>Erie</strong> <strong>Creeks</strong> watershed includes:<br />
• A summary of natural heritage features<br />
o Current extent and type<br />
o Wetland location and status<br />
• Historical assessment of the natural heritage system<br />
o Long term change<br />
More recent trends<br />
Change in extent of slough mosaic<br />
• An evaluation of significance and constraints of the current natural heritage system and<br />
its functions<br />
o Vegetation and wildlife<br />
o Site criteria; and<br />
o Subwatershed criteria<br />
Current natural area extent and dominant community type are the basis for characterization. An<br />
emphasis has been placed on wetlands, the dominant natural system of the study area. The<br />
availability of information on the location and status of all wetlands in the watershed is essential<br />
to the application of planning policies that protect those valuable ecosystems. In the <strong>Fort</strong> <strong>Erie</strong><br />
<strong>Creeks</strong> <strong>Watershed</strong>, flat relief and extensive poorly drained soils support numerous wetlands,<br />
some of which have not been formally identified or evaluated. Many small sloughs dot the less<br />
altered landscapes and often maintain small swamp inclusions within a matrix of slightly drier<br />
systems. Delineation of slough wetlands at a regional scale is very difficult. In regeneration<br />
areas, earlier cultivation obscured the slough form and further confounds accurate wetland<br />
boundary mapping. The study area is among the most problematic in southern Ontario for<br />
wetland delineation.<br />
An analysis of historical trends in the type and extent of natural heritage features provides insight<br />
into the effects of land use transitions on the features and functions of the current natural areas.<br />
Historical analysis also assists understanding of currently underrepresented ecosystems relative<br />
to pre-settlement ones.<br />
Ranking of significance of natural areas according to pre-determined evaluation criteria<br />
identifies natural features and functions to protect as well as areas where ecological services are<br />
deficient and enhancement or restoration is needed.<br />
The characterization provides a baseline for future judgement of the level of attainment of the<br />
watershed plan objectives.<br />
2.6.1 Background Information<br />
The background information was collected and reviewed for use in the characterization. Valid<br />
subwatershed comparisons required data to be consistent across the study area. Some higher<br />
resolution data in the Settlement Area are also included to offer additional guidance for those<br />
areas under greatest development pressure. The data sets used for each set of characterization<br />
analyses, and the reasons for their choice, are presented in Table 2.6.1.<br />
March 2008 50 <strong>Fort</strong> <strong>Erie</strong> <strong>Creeks</strong> <strong>Watershed</strong> <strong>Plan</strong><br />
General Report (105116)
TABLE 2.6.1:<br />
TERRESTRIAL NATURAL HERITAGE INFORMATION USED FOR CHARACTERIZATION<br />
Title Source Date Scale Reason Chosen<br />
Status of Information on Wetland Location<br />
Evaluated Wetlands MNR<br />
1:10,000 Most recent and most complete set of evaluation data – developed from<br />
- MNR Jun 05 update<br />
2005<br />
air photo interpretation and field checks.<br />
<strong>Fort</strong> <strong>Erie</strong> Natural Areas<br />
Inventory: near urban<br />
<strong>Fort</strong> <strong>Erie</strong><br />
Report by Dougan<br />
and Assoc<br />
SOLRIS Forest Extent<br />
Boundaries MNR 2002<br />
2003 1:60,000 For the Settlement Areas, independent wetland designations at a<br />
comparable level of detail as the Evaluated Wetlands. The subtleties of<br />
wetlands in the flat landscape support the value of two estimates. Both<br />
sets of data affect the protection designations in the Settlement Area.<br />
The <strong>Fort</strong> <strong>Erie</strong> area landscape can support many small wetlands even<br />
beyond evaluated areas. This was estimated by a combination of wooded<br />
area on wet soils.<br />
Soils<br />
Ont. Min. of<br />
Agricul. & Food<br />
1989 1:25,000 See above. In <strong>Niagara</strong>, the soils data are detailed enough for a valid<br />
wetland estimate at a regional scale<br />
Preliminary Results of the <strong>Fort</strong> <strong>Erie</strong>.<br />
2006 ~ 1:17,000 A check for the estimates of unevaluated rural wetland<br />
<strong>Fort</strong> <strong>Erie</strong> Agricultural Area<br />
Natural Areas Inventory<br />
Report by Bert<br />
Miller Nature<br />
Club<br />
Subwatersheds Philips 2006 Developed from DEM and field checks for this study<br />
Summary of Natural Area Locations, Extent and Cover Type<br />
<strong>Fort</strong> <strong>Erie</strong> Natural Areas<br />
Inventory (NAI): near urban<br />
<strong>Fort</strong> <strong>Erie</strong>.<br />
Report by Dougan<br />
2003 1:60,000 Most recent, complete and detailed available data for the Settlement<br />
Areas<br />
and Assoc.<br />
Evaluated Wetlands<br />
- MNR Jun 05 update<br />
MNR<br />
2005<br />
1:10,000 With Wooded Areas, most recent, complete and detailed available data<br />
for beyond the Settlement Areas<br />
SOLRIS Forest Extent<br />
See above<br />
Boundaries MNR 2002<br />
Air Photo Mosaic <strong>Niagara</strong> Region 2002 High<br />
resolution<br />
For mapping rural shrub extent<br />
Preliminary Results of the<br />
<strong>Fort</strong> <strong>Erie</strong> Agricultural Area<br />
Natural Areas Inventory<br />
<strong>Fort</strong> <strong>Erie</strong>.<br />
Report by Bert<br />
Miller Nature<br />
Club<br />
2006 ~ 1:17,000 Cover type using Ecological Land Inventory for several rural natural<br />
areas<br />
Subwatersheds Philips 2006 Developed from DEM and field checks for this study<br />
Long term change<br />
Soils<br />
Ont. Min. of<br />
Agricul. & Food<br />
1989 1:25,000 Soils can classify natural landscape types – complete coverage for<br />
original; where current natural area for current<br />
Current Cover – see<br />
Best estimate of current natural area extent<br />
Summary of Natural Area<br />
Locations, Extent and Cover<br />
Type databases above<br />
Subwatersheds Philips 2006 Developed from DEM and field checks for this study<br />
More Recent Trends<br />
Wooded Areas<br />
- NPCA 2000 NPCA, MNR 2000 1;10,000<br />
A comparable mapping to the wooded area extent mapped in 1967 for a<br />
fair comparison and valid trends. Available overlaid on 1967 (NWQPS)<br />
1967 Land Use Geogratis 1967 1:50,000 The oldest historic forest extent in digital form<br />
Historic National<br />
Viewed at 1930’s 1:50,000 Standardized method of mapping forest areas over several decades.<br />
Topographic System NTS<br />
editions (Welland: 30L/14<br />
and <strong>Fort</strong> <strong>Erie</strong>: 30L/15)<br />
University of<br />
Ottawa Map<br />
Library<br />
to<br />
1990’s<br />
Subwatersheds Philips 2006 Developed from DEM and field checks for this study<br />
Slough Mosaic Change<br />
Air Photo Mosaic <strong>Niagara</strong> Region 2002 High For mapping estimate of landscape with remaining slough mosaic<br />
resolution<br />
Soils<br />
Ont. Min. of<br />
Agricul. & Food<br />
1989 1:25,000 Coincidence of remaining slough mosaic with certain soil types allows<br />
an estimate pf original extent of the slough mosaic pattern<br />
Subwatersheds Philips 2006 Developed from DEM and field checks for this study<br />
Significance: Vegetation and Wildlife<br />
<strong>Fort</strong> <strong>Erie</strong> Natural Areas<br />
Inventory: near urban<br />
<strong>Fort</strong> <strong>Erie</strong> 2003 1:60,000 Most recent, complete and detailed available data for the Settlement<br />
Areas<br />
Wetland Evaluations MNR 2004/5 1:10,000 Adds data for the rural areas<br />
Ontario Breeding Bird Atlas Bird Studies 2006 Most recent bird information<br />
Canada<br />
NHIC NHIC, MNR 2006 Ontario’s information centre on significant plants and animals. Included<br />
Ontario Herpetofaunal Summary Atlas<br />
March 2008 51 <strong>Fort</strong> <strong>Erie</strong> <strong>Creeks</strong> <strong>Watershed</strong> <strong>Plan</strong><br />
General Report (105116)
TABLE 2.6.1:<br />
TERRESTRIAL NATURAL HERITAGE INFORMATION USED FOR CHARACTERIZATION<br />
Title Source Date Scale Reason Chosen<br />
Significance/Constraints: Sites<br />
Core Natural Heritage Map<br />
incl. Environmental<br />
Protection Areas<br />
RMN <strong>Plan</strong>ning<br />
Department<br />
2005 1:100,000 Consistent ranking of site significance across the whole study area (parts<br />
of 3 municipalities). The June 2005 draft was the most recent digital<br />
version: it was updated using the 2 data sources below<br />
Environmental <strong>Conservation</strong><br />
Areas<br />
Natural Heritage Corridors<br />
Evaluated Wetlands<br />
- MNR Jun 05 update<br />
MNR<br />
2005<br />
1:10,000 Updated the Natural Heritage Map to include recently evaluated<br />
wetlands.<br />
Approved Subdivision <strong>Plan</strong>s RMN <strong>Plan</strong>ning<br />
Department<br />
2006 Updated the Natural Heritage Map to account for already approved plans<br />
of subdivision.<br />
Subwatersheds Philips 2006 Developed from DEM and field checks for this study<br />
Significance/Constraints: Subwatershed<br />
Output from Status of<br />
Best available information on of wetlands, forest and natural cover.<br />
Information on Wetland<br />
Location and from Summary<br />
of Natural Areas Locations,<br />
Extent and Cover Type (see<br />
above in table)<br />
Subwatersheds Philips 2006 Developed from DEM and field checks for this study<br />
2.6.2 Work Activities<br />
Available data (ref. Table 2.6.1) for natural heritage resources have been analysed for extent,<br />
type, change, significance and constraints – all on a subwatershed basis. This characterization<br />
lays the basis for development of subwatershed-specific strategies, targets and action plans. The<br />
resolution of all analyses is at a regional scale, appropriate for watershed and subwatershed<br />
planning. Site planning will require more detailed analyses.<br />
Current Extent and Type:<br />
i. Wetland location status<br />
Available data on wetland location included the most recent available data on MNR’s evaluated<br />
wetlands and the Settlement Area’s Natural Areas Inventory (NAI). The watershed’s wetlands<br />
are so extensive, complex and difficult to delineate that evaluation extent has grown as MNR has<br />
had the opportunity for further investigation. The “moving target” of protected extent creates<br />
planning dilemmas. Swamps are the most difficult wetland type to delineate in these landscapes.<br />
An estimate of total wetland location was conducted; the coincidence of forest cover on saturated<br />
soils (Kingston and Presant, 1989) indicates the possibility of wetland for areas not yet evaluated<br />
(Snell et al, 1998). Wetland boundary estimates mapped by NWQPS using this method<br />
correspond closely with the wetland boundaries evaluated post-NWQPS, a confirmation of the<br />
estimate method’s validity for the regional scale (1:25,000) of the soil data.<br />
The most recent available (June 2005) Evaluated Wetlands were mapped, noting the Provincially<br />
Significant Wetlands. “Possible” wetland was identified as area not mapped as wetland by MNR<br />
but:<br />
• For the Settlement Area, classified wetland by the Natural Areas Inventory<br />
(Dougan and Associates, 2003); or<br />
• For the rural area, forest coinciding with wet soil (Kingston and Presant, 1989) for<br />
50-100% of the soil unit.<br />
March 2008 52 <strong>Fort</strong> <strong>Erie</strong> <strong>Creeks</strong> <strong>Watershed</strong> <strong>Plan</strong><br />
General Report (105116)
Available rural NAI field results assembled by the Bert Miller Nature Club provided a spot<br />
check for the possible additional wetland. MNR generated a few wetland boundary revisions<br />
over the course of the project; the June 2005 set provided at project start-up was used as a<br />
consistent date.<br />
Total wetland area estimate used the evaluated wetland area plus 40% of the area of possible<br />
wetlands. The 40% figure is based on <strong>Niagara</strong> Area of Concern (AOC) air photo sampling to<br />
estimate the proportion of wet slough area within possible wetlands (Snell et al, 1998); the<br />
method corresponds with that used for wetland area by <strong>Niagara</strong> Water Quality Protection<br />
Strategy (NWQPS).<br />
ii.<br />
A summary of natural area locations, extent and cover type<br />
In the Settlement Area, the Natural Areas Inventory was summarized using the dominant cover<br />
type.<br />
The Bert Miller Nature Club is conducting a natural area inventory in the rural areas of the Town<br />
of <strong>Fort</strong> <strong>Erie</strong>. Comprehensive data were not available to allow complete cover mapping of the<br />
rural area. At report preparation, MNR had not released the area’s Southern Ontario Land<br />
Resource Information System (SOLRIS) cover mapping. For the rural area, a combination of the<br />
SOLRIS forest extent and evaluated wetland mapping allowed distinction of treed areas and<br />
open meadow/marsh. Interpretation of the 2002 air photo mosaic provided an estimate of<br />
shrub/meadow areas.<br />
Historical Context for the Natural Heritage System<br />
i. Long Term Change<br />
Natural communities were defined on the basis of their soil landscape. Categories included<br />
mineral, organic and alluvial landscapes. The mineral soil areas were further divided by their<br />
dominant drainage into upland (well-drained), mesic (imperfectly drained) and lowland (poorly<br />
or very poorly drained) as well as into deep fine soils (clays, clay loams and silty clays), deep<br />
coarse soils (sands and gravels) and shallow (less than 1 meter) over bedrock.<br />
March 2008 53 <strong>Fort</strong> <strong>Erie</strong> <strong>Creeks</strong> <strong>Watershed</strong> <strong>Plan</strong><br />
General Report (105116)
The soil units included in each landscape class are listed in Table 2.6.2.<br />
Landscape<br />
Fine soil Mesic<br />
Fine soil Lowland<br />
Coarse soil Upland<br />
Coarse soil Mesic<br />
Coarse soil Lowland<br />
Shallow on Bedrock Upland<br />
Shallow on Bedrock Mesic<br />
Shallow on Bedrock<br />
Lowland<br />
Organic Wetland<br />
Occasionally Inundated<br />
TABLE 2.6.2:<br />
LANDSCAPES’ DOMINANT SOIL SERIES<br />
Dominant Soil Series*<br />
Beverly, Chinguacousy, Cashel, Haldimand, <strong>Niagara</strong>,<br />
Oneida, Ontario, Peel, Tavistock<br />
Jeddo, Lincoln, Malton, Maplewood, Toledo, Welland<br />
Fonthill, Fox, Plainfield, Beach-scarp complex<br />
Berrien, Walsingham<br />
Granby<br />
Farmington<br />
Franktown<br />
Brooke<br />
Lorraine<br />
Alluvial<br />
* includes soil series from Sheet 7 of <strong>Niagara</strong> Soils (Kingston and Presant, 1989).<br />
Some may be beyond the study area.<br />
Originally, the natural landscapes covered the whole watershed. Current landscapes were<br />
classified using the same landscape classes by overlaying the current natural areas on the soil<br />
coverage. Proportional comparisons were calculated based on the area with data, omitting builtup<br />
areas where soils are not mapped.<br />
ii.<br />
Recent Change<br />
Two investigations were conducted:<br />
• A digital overlay of 1967 forest extent (Canada Land Inventory) on 2000 forest extent<br />
(NPCA). Resolution differences limited the interpretation to woodlots greater than 2<br />
hectares, the lower resolution of the two coverages. Slight shifts in registration of the<br />
1967 coverage limited the interpretation to a visual comparison; and<br />
• A visual comparison of the historic editions of the National Topographic System. They<br />
were based on aerial photography of 1936, 1965, 1976, 1980 and 1990 for Welland<br />
(30L/14) and of 1936, 1969, 1976, 1980 and 1990 for <strong>Fort</strong> <strong>Erie</strong> (30L/15).<br />
iii.<br />
Slough Mosaic Change<br />
Landscape units retaining the slough (shallow closed depression) pattern characteristic of the<br />
area’s natural landscapes were interpreted from the 2002 air photo mosaic. Distribution was<br />
compared with the soils to establish correspondence and a basis for estimating the original<br />
slough mosaic distribution.<br />
iv.<br />
Significance<br />
Vegetation and Wildlife<br />
Significance of vegetation and wildlife species and communities was summarized from the<br />
Natural Areas Inventory (Dougan and Associates, 2003) supplemented by the Ontario Breeding<br />
Bird Atlas Data, Natural Heritage Information Centre data, wetland evaluation data, a brief<br />
discussion with the investigator for the Bert Miller Nature Club (A. Garafalo, pers. comm.) as<br />
March 2008 54 <strong>Fort</strong> <strong>Erie</strong> <strong>Creeks</strong> <strong>Watershed</strong> <strong>Plan</strong><br />
General Report (105116)
well as consultation with NPCA and local MNR staff. Ratings were based on species at risk lists<br />
of COSEWIC and OMNR and on NHIC’s rare species list available in 2006.<br />
Site Criteria<br />
The most recent rating of site significance that consistently covers the whole study area is<br />
<strong>Niagara</strong> Region’s Core Natural Heritage map approved in December 2005 (Regional<br />
Municipality of <strong>Niagara</strong>, 2005). It rates provincially significant areas – Provincially Significant<br />
Wetlands, Provincial Life Science ANSI’s – as Environmental Protection Areas. It rates<br />
regionally significant areas - significant woodlands, significant wildlife habitat, regionally<br />
significant life science ANSI’s, other evaluated wetlands, significant valley lands, publicly<br />
owned conservation lands – as Environmental <strong>Conservation</strong> Areas. Significant habitat of<br />
threatened and endangered species qualifies as Environmental Protection Area but has not been<br />
mapped; a check with MNR indicated no information was available at report writing (Vlasman,<br />
Kara, pers. comm.). The above levels of significance meet criteria listed in the Provincial Policy<br />
Statement (2005). Development and site alteration will not be permitted in Environmental<br />
Protection Areas but may be permitted in Environmental <strong>Conservation</strong> Areas if it has been<br />
demonstrated that there will be no significant negative impact (Regional Municipality of<br />
<strong>Niagara</strong>, 2005).<br />
The Region’s Draft Core Natural Heritage Map was updated to 2006 conditions by adding the<br />
June 2005 evaluated wetlands and deleting three small areas where draft plans of subdivision<br />
were approved prior to the significance mapping.<br />
The Town of <strong>Fort</strong> <strong>Erie</strong> and the City of Port Colborne both have recent draft Official <strong>Plan</strong>s (OPs).<br />
Their use for study area-wide significance rating is limited by: a) differing environmental<br />
designations; and b) environmental designation criteria that extend beyond significance (e.g.,<br />
hazards, rehabilitated waste disposal sites). Although consistent significance rating required use<br />
of the Region’s rating, the draft OP’s will be incorporated into the Strategy.<br />
The significance of every natural area (totalling 455 units) in the Settlement Area was rated in<br />
the Natural Areas Inventory (Dougan and Assoc., 2003). Several natural areas in agricultural<br />
<strong>Fort</strong> <strong>Erie</strong> have been inventoried and rated by the Bert Miller Nature Club (2006): these ratings<br />
are incorporated into <strong>Fort</strong> <strong>Erie</strong>’s Draft OP that will be incorporated into the Strategy. The lack of<br />
a comprehensive rural inventory, however, precludes use for a watershed-wide significance<br />
analysis.<br />
Subwatershed Criteria<br />
All subwatersheds – both those within the <strong>Niagara</strong> River Area of Concern and those in the Lake<br />
<strong>Erie</strong> basin - were analysed for their status compared to the minimum habitat guidelines<br />
Environment Canada (2004a) developed to assist restoration planning in Areas of Concern.<br />
Parameters used and their guidelines are:<br />
• Percent wetlands: >6% per subwatershed; >10% per major watershed<br />
• Percent forest: >30%<br />
• Size of the largest forest patch: at least one patch over 200 ha with a minimum of 500 m<br />
width<br />
March 2008 55 <strong>Fort</strong> <strong>Erie</strong> <strong>Creeks</strong> <strong>Watershed</strong> <strong>Plan</strong><br />
General Report (105116)
• Percent of interior forest: >10% over 100 m from the forest edge; and > 5% over 200 m<br />
from the forest edge<br />
• Proximity to other forest patches: none more than 2 km from another.<br />
• Riparian vegetation: > 75% of all stream length naturally vegetated to a minimum of 30<br />
m width on both sides of the streams.<br />
Wetland percentage used the evaluated wetland area plus 40% of the area of possible wetlands<br />
mapped on Figure NH 1 (see Wetland location status section above). Forest extent was the total<br />
of the Settlement Area’s Treed and Sparse Treed cover types from the Natural Areas Inventory<br />
and of the rural area’s Treed Cover from SOLRIS Forest Boundaries (2002). Riparian analyses<br />
used all natural cover types.<br />
2.6.3 Findings/Constraint Identification<br />
The <strong>Fort</strong> <strong>Erie</strong> <strong>Creeks</strong> <strong>Watershed</strong> falls within the Deciduous Forest Region, also known as the<br />
Carolinian Zone or Lake <strong>Erie</strong> Lowlands. This zone lies along the north shore of Lakes <strong>Erie</strong> and<br />
Ontario and the south-east shore of Lake Huron. It is the northern extension of the large<br />
deciduous forest of north-eastern United States. Many of the trees found here are at the northern<br />
limit of their range and biodiversity is the highest of all Canada’s vegetation zones.<br />
Approximately one-third of Canada’s species-at-risk under the Species at Risk Act are found in<br />
this relatively small eco-region (Environment Canada, 2004b).<br />
The moderate climate and rich soils of Ontario’s Deciduous Forest Region resulted in massive<br />
clearing for agriculture. This heritage and ready access to lake transportation laid the basis for<br />
population growth and today’s extensive urbanization. Over 90 per cent of Ontario’s 10 million<br />
residents live in the Deciduous Forest Region (OMNR, 2002). It contains Ontario’s most<br />
threatened habitats. Over 125 species in Carolinian Canada are considered vulnerable, species of<br />
special concern, threatened or endangered by either the federal or provincial government. Over<br />
400 species in Carolinian Canada are considered rare by the Natural Heritage Information Centre<br />
(Carolinian Canada, 2004).<br />
The Deciduous Forest Region has the lowest percentage of natural areas in Ontario. Forest<br />
extent averages 11%. The <strong>Niagara</strong> <strong>Peninsula</strong> watershed exceeds that average at 17.6%<br />
(NWQPS, Phase 2, 2003). Much of that elevated level can be attributed to the relatively high<br />
forest extent in the south-east portion of the peninsula, including the <strong>Fort</strong> <strong>Erie</strong> <strong>Creeks</strong> watershed<br />
where some areas exceed 30%. Since much of the <strong>Fort</strong> <strong>Erie</strong> <strong>Creeks</strong> watershed’s forest is<br />
wetland, NWQPS total wetland estimates for these Local Management Areas exceed the 10%<br />
minimum guideline.<br />
The <strong>Fort</strong> <strong>Erie</strong> <strong>Creeks</strong> <strong>Watershed</strong> rates very well in terms of forest and wetland extent relative to<br />
much of southern Ontario and the Deciduous Forest Zone.<br />
March 2008 56 <strong>Fort</strong> <strong>Erie</strong> <strong>Creeks</strong> <strong>Watershed</strong> <strong>Plan</strong><br />
General Report (105116)
Current Extent and Type<br />
Wetland location status<br />
Wetland information is presented in Figure NH 1 and summarized in Table 2.6.3. Evaluated<br />
wetland covers 13.2% of the study area. Beyond evaluated areas, possible wetland inclusions are<br />
estimated to add approximately 600 hectares for a total wetland coverage estimate of 16.6%.<br />
The highest wetland concentrations occur in Baker Creek and Kraft Drain watersheds; the lowest<br />
concentrations occur in the most highly urbanized subwatersheds – <strong>Fort</strong> <strong>Erie</strong> and Lakeshore.<br />
The largest wetland is Humberstone Marsh in the Black Creek headwaters.<br />
Almost all evaluated wetlands are rated Provincially Significant. Only Bertie Bay Drain<br />
subwatershed has a substantial area of evaluated wetland with local significance (ref.<br />
Figure NH 1).<br />
Subwatershed<br />
Subwatershed<br />
Area (ha)<br />
TABLE 2.6.3:<br />
WETLAND ESTIMATES BY SUBWATERSHED<br />
Evaluated<br />
Wetland (ha)<br />
June 2005<br />
Area Containing<br />
Possible Wetland<br />
(ha)<br />
Total Wetland<br />
Area Estimate*<br />
(ha)<br />
Estimated %<br />
Wetland<br />
Baker 455.0 151.4 74.0 181.0 39.8<br />
Beaver 3478.9 399.4 258.5 502.8 14.5<br />
Bertie Bay Drains +<br />
L. <strong>Erie</strong> 1<br />
868.3 106.6 67.2 133.5 15.4<br />
Black 6872.3 825.5 590.9 1061.9 15.5<br />
<strong>Fort</strong> <strong>Erie</strong> 397.5 0 0 0 0<br />
Frenchman’s Creek 1723.5 278.9 112.7 324.0 18.8<br />
Kraft Drain 554.7 153.5 146.2 212.0 38.2<br />
Lakeshore 364.4 21.7 43.7 39.2 10.8<br />
Miller 795.5 153.4 60.3 177.5 22.3<br />
<strong>Niagara</strong> R. Shore 349.4 37.7 43.5 55.1 15.8<br />
Six Mile Creek 1813.4 211.6 97.1 250.4 13.8<br />
TOTAL 17,662.9 2339.7 1494.1 2937.3 16.6<br />
* Evaluated area + 40% of Area Containing Possible Wetland. This is a conservative estimate: areas containing<br />
possible wetland include only those with forest cover types.<br />
In the Settlement Area, the Natural Area Inventory wetlands included most evaluated wetland<br />
but extended further. Evaluated wetlands very rarely extended beyond Natural Area Inventory<br />
ones and in most of those instances occurred on soils mapped as 100% poorly drained, a<br />
situation supporting the probability of wetland inclusions. The dominance of 100% poorly<br />
drained soils within evaluated wetlands extended to the rural area.<br />
Where the Agricultural Area NAI investigated non-evaluated areas for which soil maps indicate<br />
possible wetland, the NAI confirmed wetland presence (Bert Miller Nature Club, 2006) and the<br />
validity of the forest-wet soil overlay method to flag possible wetland.<br />
Summary of natural area locations, extent and cover type<br />
The distribution of the natural areas’ dominant cover types is shown on Figure NH 2 and<br />
quantified by subwatershed in Table 2.6.4.<br />
March 2008 57 <strong>Fort</strong> <strong>Erie</strong> <strong>Creeks</strong> <strong>Watershed</strong> <strong>Plan</strong><br />
General Report (105116)
Subwatershed<br />
TABLE 2.6.4:<br />
COVER TYPE PERCENTAGES BY SUBWATERSHED<br />
Subwatershed<br />
Area (ha)<br />
Aquatic Beach/Dunes Prairie Shrubs/<br />
Meadow/<br />
Marsh<br />
Trees (incl.<br />
Sparse<br />
Trees)<br />
Total<br />
Natural<br />
Cover<br />
Baker 455.0 25.5 47.2 72.7<br />
Beaver 3478.9 5.9 23.9 29.7<br />
Bertie Bay + L. <strong>Erie</strong> 1 868.3 1.1 0.1 16.7 24.5 42.4<br />
Black 6872.3 8.8 20.4 29.3<br />
<strong>Fort</strong> <strong>Erie</strong> 397.5 0.1 2.2 1.0 3.2<br />
Frenchman’s 1723.5 13.8 22.6 36.5<br />
Kraft 554.7 19.9 42.8 62.7<br />
Lakeshore 364.4 4.6 1.8 22.9 29.3<br />
Miller 795.5 17.1 28.8 46.0<br />
<strong>Niagara</strong> River Shore 349.4 21.7 27.4 49.0<br />
Six Mile 1813.4 0.7 15.4 23.1 39.3<br />
TOTAL Study Area 17,662.9 0.1 0.1 0.1 10.9 23.4 34.5<br />
Trees, including sparse trees, cover 23.4%; shrubs, meadow or marsh cover 10.9%; and aquatic,<br />
beach/dunes and prairie are each 0.1% of the <strong>Fort</strong> <strong>Erie</strong> <strong>Creeks</strong> watersheds. Total natural cover is<br />
34.5%.<br />
Baker and Kraft subwatersheds both exceed 40% forest. All other subwatersheds, except the<br />
built-up <strong>Fort</strong> <strong>Erie</strong> one, fall in the 20-30% range.<br />
Shrub and meadow are more common in the “urban fringe” subwatersheds (Baker, Frenchman’s,<br />
Kraft Miller, <strong>Niagara</strong> River Shore, Bertie Bay) at 13.8 to 25.5% compared to either the built-up<br />
(<strong>Fort</strong> <strong>Erie</strong>, Lakeshore) or rural (Beaver and Black) ones, all of which are less than 8.8%.<br />
Though mapped only for the Settlement Area, the single aquatic system is in Bertie Bay<br />
subwatershed; the beach/dune communities are concentrated in Lakeshore subwatershed; and<br />
prairie is concentrated in Six Mile Creek subwatershed.<br />
The total natural area is highest for Baker Creek subwatershed at 72.7%, followed by Kraft Drain<br />
subwatershed at 62.7% - both extremely high percentages for southern Ontario. The only<br />
subwatershed below 29% is the highly urban <strong>Fort</strong> <strong>Erie</strong> one.<br />
A history of cultural influence determines the existence and composition of almost every shrub<br />
and meadow community; among treed community types, cultural influence is flagged for<br />
plantations (ref. Figure NH 2 Settlement Area only).<br />
Shrub and meadow cover types tend to have a shorter duration than the other types. Shrub and<br />
meadow undergo succession to forest and are easy to clear for agriculture or development. A<br />
comparison for two recent dates (2002 air photo mosaic and 2005 Google Earth) confirms the<br />
flux of this cover type but, for that period, the relatively constant total area and distribution of<br />
change.<br />
Historical Context for the Natural Heritage System<br />
Changes are summarized for both long-term (since pre-settlement) and more recent trends.<br />
March 2008 58 <strong>Fort</strong> <strong>Erie</strong> <strong>Creeks</strong> <strong>Watershed</strong> <strong>Plan</strong><br />
General Report (105116)
Long Term Change<br />
The original communities are indicated by the landscapes mapped on Figure NH 3a. Areas<br />
without soil data are not classified. Table 2.6.5: Original rows list percentages by each<br />
subwatershed’s classified area. Much of the forest grew on lowland areas with fine-textured<br />
soils. A significant area, however, was dry enough to reach the mesic category and there were<br />
also major areas that were shallow soil on bedrock – predominantly upland and mesic in<br />
character. Communities on coarse soils were very small, corresponding to Lake <strong>Erie</strong> shore areas<br />
and to remnants of glacial lake beaches.<br />
The current natural landscapes are presented on Figure NH 3b and listed in Table 2.6.5: Current<br />
rows.<br />
Subwatershed<br />
Baker Creek<br />
Original<br />
Current<br />
Beaver Creek<br />
Original<br />
Current<br />
Bertie Bay Drain +<br />
L. <strong>Erie</strong> 1<br />
Original<br />
Current<br />
Black Creek<br />
Original<br />
Current<br />
<strong>Fort</strong> <strong>Erie</strong><br />
Original<br />
Current<br />
Frenchman’s Creek<br />
Original<br />
Current<br />
Kraft Drain<br />
Original<br />
Current<br />
Lakeshore<br />
Original<br />
Current<br />
Miller Creek<br />
Original<br />
Current<br />
<strong>Niagara</strong> R. Shore<br />
Original<br />
Current<br />
Six Mile Creek<br />
Original<br />
Current<br />
TOTAL Study Area<br />
Original Natural<br />
Current Natural<br />
Current Slough<br />
Mosaic %<br />
TABLE 2.6.5:<br />
ORIGINAL AND CURRENT NATURAL LANDSCAPES BY SUBWATERSHED*: Percentages Are % of Natural Landscapes<br />
Fine<br />
Soil<br />
Lowland<br />
(%)<br />
78.9<br />
82.4<br />
40.1<br />
43.4<br />
57.5<br />
70.5<br />
73.6<br />
79.9<br />
83.5<br />
79.5<br />
61.6<br />
64.1<br />
71.1<br />
73.0<br />
96.6<br />
98.5<br />
57.8<br />
64.1<br />
71.6<br />
85.1<br />
43.5<br />
47.4<br />
Fine<br />
Soil<br />
Mesic<br />
(%)<br />
19.1<br />
15.8<br />
33.5<br />
18.1<br />
17.2<br />
7.9<br />
18.3<br />
7.9<br />
16.5<br />
20.5<br />
20.1<br />
19.8<br />
22.9<br />
19.5<br />
-<br />
-<br />
18.7<br />
20.8<br />
28.1<br />
14.6<br />
21.9<br />
12.3<br />
* built-up areas excluded<br />
Alluvial<br />
(%)<br />
2.0<br />
1.8<br />
10.1<br />
22.9<br />
-<br />
-<br />
4.8<br />
8.3<br />
-<br />
-<br />
6.0<br />
10.1<br />
6.0<br />
7.5<br />
0.1<br />
0<br />
2.5<br />
4.6<br />
0.4<br />
0.3<br />
8.6<br />
14.7<br />
Shallow<br />
Low-<br />
Land<br />
(%)<br />
-<br />
-<br />
-<br />
-<br />
1.2<br />
1.8<br />
-<br />
-<br />
-<br />
-<br />
0.8<br />
0.5<br />
-<br />
-<br />
-<br />
-<br />
-<br />
-<br />
-<br />
-<br />
4.8<br />
7.1<br />
Shallow<br />
Mesic<br />
(%)<br />
-<br />
-<br />
5.9<br />
5.8<br />
7.4<br />
8.0<br />
0.7<br />
0.1<br />
-<br />
-<br />
6.9<br />
2.7<br />
-<br />
-<br />
-<br />
-<br />
14.9<br />
5.0<br />
-<br />
-<br />
9.0<br />
5.9<br />
Shallow<br />
Upland<br />
(%)<br />
-<br />
-<br />
10.4<br />
9.8<br />
16.1<br />
11.7<br />
1.3<br />
0.9<br />
-<br />
-<br />
2.2<br />
2.4<br />
-<br />
-<br />
-<br />
-<br />
3.6<br />
3.6<br />
-<br />
-<br />
12.1<br />
12.6<br />
Coarse<br />
Soil<br />
Mesic<br />
(%)<br />
-<br />
-<br />
-<br />
-<br />
-<br />
-<br />
trace<br />
trace<br />
-<br />
-<br />
-<br />
-<br />
-<br />
-<br />
-<br />
-<br />
1.2<br />
0.9<br />
-<br />
-<br />
-<br />
-<br />
Coarse<br />
Soil<br />
Upland<br />
(%)<br />
-<br />
-<br />
0.1<br />
0.0<br />
0.5<br />
0.1<br />
-<br />
-<br />
-<br />
-<br />
2.3<br />
0.5<br />
trace<br />
0<br />
3.3<br />
1.5<br />
1.2<br />
1.0<br />
-<br />
-<br />
0.2<br />
trace<br />
Organic<br />
(%)<br />
62.0 22.1 5.9 0.5 3.9 4.7 trace 0.3 0.5<br />
67.0 13.4 10.3 0.9 2.7 4.5 0.1 0.1 1.0<br />
88.0 7.6 2.1 0 0.5 0.5 0.1 0.1 1.1<br />
-<br />
-<br />
-<br />
-<br />
-<br />
-<br />
1.2<br />
2.8<br />
-<br />
-<br />
-<br />
-<br />
-<br />
-<br />
-<br />
-<br />
-<br />
-<br />
-<br />
-<br />
-<br />
-<br />
Original<br />
Natural Area<br />
on Mapped<br />
Soils (ha)<br />
448.4<br />
3115.7<br />
492.1<br />
6827.7<br />
10.9<br />
1167.9<br />
468.1<br />
118.6<br />
740.4<br />
264.3<br />
1390.0<br />
15044.1<br />
Current<br />
Natural<br />
Area on<br />
Mapped<br />
Soils (ha)<br />
332.6<br />
976.0<br />
315.2<br />
1922.4<br />
7.3<br />
576.1<br />
333.4<br />
78.2<br />
354.4<br />
143.3<br />
629.0<br />
5667.9<br />
March 2008 59 <strong>Fort</strong> <strong>Erie</strong> <strong>Creeks</strong> <strong>Watershed</strong> <strong>Plan</strong><br />
General Report (105116)
The main percentage shift from “original” to “current” status for the full study area is a lower<br />
proportion of the natural area on mesic sites and a higher proportion on alluvial and lowland<br />
sites; lack of wetness and inundation limitations favoured agricultural use of mesic sites. Within<br />
subwatersheds, changes in relative proportions from original to current conditions are:<br />
• Close to same – Baker, Frenchman’s, Kraft, Lakeshore, Miller, <strong>Fort</strong> <strong>Erie</strong><br />
• A shift from fine soil mesic to alluvial – Beaver, Six Mile<br />
• A shift from fine soil mesic to fine soil lowland – Bertie Bay, <strong>Niagara</strong> River Shore<br />
• A shift from fine soil mesic to fine soil lowland and alluvial – Black, Six Mile<br />
Among the shallow over bedrock landscapes, mesic areas are under-represented today relative to<br />
original proportions. The coarse soil communities, always very small, have almost disappeared.<br />
Recent Change<br />
The sequence of changes since 1936 is presented by subwatershed in Table 2.6.6. Figure NH 4<br />
summarizes recent forest changes.<br />
TABLE 2.6.6:<br />
CHANGES THROUGH FIVE NATURAL TOPOGRAPHIC SURVEY EDITIONS – BY SUBWATERSHED<br />
Subwatershed<br />
Streams/Shores Land Use Forest<br />
& Date<br />
Black: 1936 Drains through and below<br />
Humberstone Marsh, rest<br />
natural. Shows tributary<br />
linking up with later north<br />
tributary of Beaver<br />
1965 A few more drains. Tributary<br />
cut off to the Beaver<br />
Scattered farm houses + 1 road of homes<br />
in Stevensville. A few houses in Snyder.<br />
QEW + RR’s<br />
Few more homes in Stevensville.<br />
Douglastown started. Auto wrecker and<br />
dump beside Humberstone. Marsh<br />
Humberstone Marsh the biggest. Elsewhere<br />
evenly scattered.<br />
Very little change<br />
1976 Same Very similar. Wrecker & dump gone. Very similar. A bit more along creeks but<br />
most bare.<br />
1980 Similar Similar. New ponds near Douglastown’s Very little change. A bit lost to the ponds<br />
new interchange<br />
1990 Similar Similar. Ponds labelled Waste Very little change<br />
Beaver: 1936 Most streams natural. With<br />
stream to Black, smaller basin<br />
Development at Ridgeway + homes along<br />
Ridge Rd near Garrison + scattered<br />
Scattered but much of Beaver valley<br />
vegetated. Only upper reaches not.<br />
than later<br />
farmsteads<br />
1965 Above Stream into Beaver Some growth in Ridgeway & along Ridge Very little change<br />
Creek<br />
Rd. New Quarry near Ridgemount<br />
1976 Same Same Little change. Riparian of upper trib added<br />
1980 A few new tributaries show Similar<br />
Little change. A couple small additions.<br />
up<br />
1990 Same Similar Little change. A bit more.<br />
Baker: 1936 Natural form Few homes, power line Headwaters forested<br />
1969 A creek that not on 1936 map Little change<br />
Bit of spread<br />
is flowing into Miller Ck<br />
1976 Same Same Very similar<br />
1980 Creek reversed into Baker;<br />
new drains<br />
Very similar<br />
Some spread in lower area and along Baker<br />
Creek<br />
1990 Same Few more homes Some further spread in lower area<br />
Miller: 1936 Natural form Little built-up. RR, QEW & power line Scattered woodlots<br />
1969 A creek near mouth that Few homes, dump in headwaters<br />
Bit more forest along creek<br />
reversed to Baker later<br />
1976 Same Dump grown. New Auto wrecker Little change except some clearing near RR<br />
& QEW<br />
1980 Creek now to Baker Auto wrecker bigger Some expansion. Cleared in 1976 back as<br />
forest<br />
1990 Same Auto wrecker bigger More spread. Most of creek system wooded<br />
but not headwaters<br />
March 2008 60 <strong>Fort</strong> <strong>Erie</strong> <strong>Creeks</strong> <strong>Watershed</strong> <strong>Plan</strong><br />
General Report (105116)
TABLE 2.6.6 Con’t:<br />
CHANGES THROUGH FIVE NATURAL TOPOGRAPHIC SURVEY EDITIONS – BY SUBWATERSHED<br />
Subwatershed<br />
& Date<br />
Streams/Shores Land Use Forest<br />
<strong>Niagara</strong> River No creeks. Some houses along <strong>Niagara</strong> Pkwy A few scattered woodlots<br />
Shore: 1936<br />
1965 & 1969 2 creeks shown More homes along Pkwy A bit more wooded<br />
1976 Same A few more homes A bit less wooded<br />
1980 Same Very similar Some spread<br />
1990 Same Very similar A bit of spread<br />
Frenchman’s Natural form<br />
Development in <strong>Fort</strong> <strong>Erie</strong> Race Track Very scattered. Little along creek<br />
Creek: 1936<br />
vicinity. Many RR’s and QEW.<br />
1969 More creeks shown Same + another sports track + quarry in<br />
headwaters<br />
Little change except expansion of woodlot<br />
in lowest reach.<br />
1976 Same Similar + new auto wreckers and chemical A few upper woodlots expanded a bit.<br />
plant near Conrail. QEW intersection<br />
1980 Same Little change Many woodlots expanding<br />
1990 Same Little change Similar. A little spread.<br />
<strong>Fort</strong> <strong>Erie</strong>: Only 3 small streams Mostly built up. RR and QEW Very little<br />
1936<br />
1969 North stream gone New park; STP where creek gone None<br />
1976 Same Same None<br />
1980 Same Same Woodlot in north<br />
1990 Same Same Same<br />
Lakeshore: Irregular shore & further out Some built-up<br />
Very little<br />
1936<br />
than later<br />
1969 Smoothed out shore Similar Bit more both inland & near shore<br />
1976 Same Few more homes Spread further<br />
1980 Same Same Spread still more<br />
1990 Same Few more homes Spread still more<br />
Kraft Drain: Natural stream form Scattered homes Relatively little<br />
1936<br />
1969 Same Few more homes Similar<br />
1976 Same Same Spread along creek and connecting<br />
woodlots<br />
1980 Drains added Few more homes. Chemical plant noted Lot of spread<br />
1990 Same Same More spread<br />
Bertie Bay<br />
Drains:<br />
1936<br />
Irregular shore & further out<br />
than later<br />
No streams mapped<br />
S ½ of Crescent Park built-up. Scattered<br />
homes elsewhere. Many shore cottages.<br />
Scattered woodlots<br />
1969 2 drains extend inland & to<br />
quarry ponds north of<br />
Dominion Road (ref. NTS<br />
mapping)<br />
More homes in N ½ & scattered<br />
elsewhere. More cottages<br />
Very slight spread<br />
1976 Same N ½ of Crescent Park filling in Some spread in mid-area<br />
1980 Same Very similar. Few more cottages Much more spread mid and lower areas,<br />
much of creeks within forest<br />
1990 Same Very similar Most woodlots spread<br />
Six Mile Creek: Natural streams Some built-up in headwaters Scattered woodlots, little along creeks<br />
1936<br />
1965 Some drains Some built-up spread esp. near mouth at<br />
Wavecreast/Thunder Bay<br />
Little change except woodlot gone under<br />
Thunder Bay development<br />
1976 Same Very similar Some spread especially towards shore S. of<br />
Dominion Rd.<br />
1980 More drains Very similar Some spread esp. in upper reaches<br />
1990 Same Very similar Small amount of spread<br />
1990 Same Little change Similar. A little spread.<br />
Forest change has been in the context of other land use changes. Urban expansion in the<br />
watershed has been minor since 1936. Thunder Bay, Crescent Park and Douglastown have<br />
shown the greatest growth in extent. Strips of homes along <strong>Niagara</strong> Parkway, Ridge Road and<br />
Lake <strong>Erie</strong> shoreline have gradually filled in. Interchanges were added to the QEW between 1969<br />
March 2008 61 <strong>Fort</strong> <strong>Erie</strong> <strong>Creeks</strong> <strong>Watershed</strong> <strong>Plan</strong><br />
General Report (105116)
and 1976. These changes removed a few forested areas. In recent decades, however, forest<br />
cover has expanded with the greatest increases in the eastern subwatersheds where regeneration<br />
has more than balanced the losses (ref. Figure NH 4). <strong>Fort</strong> <strong>Erie</strong> subwatershed is an exception: it<br />
has been built-up since 1936 and shown little woodland extent or regeneration since.<br />
Figure NH4’s pattern is confirmed by the historic discussions for stream assessment<br />
(Section 2.4.1.1) and fisheries (Section 2.5.3).<br />
Large relatively mature woodlots are concentrated at Humberstone Marsh and in a band within<br />
3 km of the <strong>Niagara</strong> River in Baker, Miller and lower Frenchman’s Creek subwatersheds. Many<br />
represent older regeneration on once-cleared land abandoned long ago. Much of the more<br />
immature woodland developed in the two decades from 1970 to 1990. The highest proportion of<br />
immature forest relative to more mature forest is in Six Mile Creek subwatershed.<br />
Beaver Creek valley land was relatively well vegetated even in 1936; most other creek systems<br />
were less protected but have improved in riparian forest extent in more recent decades.<br />
Influences on forest besides urban presence and limited urban expansion include drains and<br />
contaminant sources. In 1936, the only obvious drains were through and downstream of the<br />
Humberstone Marsh. Drains gradually extended throughout the study area from the 1960’s on.<br />
Possible point sources of contamination appear over the decades including dumps, auto wreckers<br />
and chemical plants (ref. Potential Point Sources on Subwatershed Local Opportunities Maps).<br />
Other observations include:<br />
• The prevalence of orchards pre-1960’s compared to later dates;<br />
• Stream re-direction: a large tributary of Beaver Creek showed as part of the Black Creek<br />
system in 1936. A small stream that flowed into Miller Creek was altered into a drain<br />
flowing to Baker Creek between 1976 and 1980; and<br />
• The 1936 Lake <strong>Erie</strong> shoreline was much more irregular and extended further into the lake<br />
than noted on any later maps. This pattern very likely reflected the low lake levels of the<br />
1930’s.<br />
In summary, over the past 70 years, the <strong>Fort</strong> <strong>Erie</strong> Creek <strong>Watershed</strong> subwatersheds show a pattern<br />
distinct from most of southern Ontario – a pattern of little urban expansion and significant<br />
increase of immature forest.<br />
Slough Mosaic Change<br />
Figure NH 7 presents the swale mosaic analysis. Landscape units retaining a slough (shallow,<br />
closed depression) pattern within them are estimated to cover 1395.2 hectares. Table 2.6.5<br />
bottom row shows the current slough pattern distribution by landscape for the 1388.2 hectares<br />
with soil data. Slough mosaic patterns favour fine soil lowland compared to its total extent<br />
(which corresponds to original natural extent). Of the 88% of the total slough pattern that<br />
occurs within fine soil lowland, almost all (78.1%) coincides with lacustrine deposits. The<br />
lacustrine soils are noted for their “rippled” micro-topography; poorly drained soils have the<br />
highest presence of sloughs. Assuming the original slough mosaic pattern corresponded to<br />
poorly drained lacustrine soils, approximately 6000 hectares of the original 7400 hectares of<br />
slough patterned units (81.1%) have had their micro-topography levelled (ref. Table 2.6.7 and<br />
Figure NH 7). This estimate is conservative, overlooking sloughs in other landscapes and the<br />
March 2008 62 <strong>Fort</strong> <strong>Erie</strong> <strong>Creeks</strong> <strong>Watershed</strong> <strong>Plan</strong><br />
General Report (105116)
lack of data for urban areas. Of the original 42.2% of the watershed estimated to have had slough<br />
mosaic units, 8.0 % of the study area remains in slough mosaic units, most of it (6.8%) in natural<br />
cover. Figure NH 7 indicates the widespread levelling of the slough mosaic both in current<br />
agricultural land and in abandoned areas that have since regenerated natural cover.<br />
Subwatershed<br />
Subwatershed<br />
Area (ha)<br />
TABLE 2.6.7:<br />
SLOUGH MOSAIC UNIT COVER TYPE PERCENTAGES BY SUBWATERSHED<br />
Original<br />
Slough<br />
Mosaic:<br />
Lincoln,<br />
Malton<br />
&<br />
Welland<br />
soils *<br />
Current<br />
Treed<br />
Slough<br />
Mosaic<br />
Current<br />
Non-<br />
Treed<br />
Natural<br />
Slough<br />
Mosaic<br />
Current<br />
Slough<br />
Mosaic<br />
Without<br />
Natural<br />
Cover<br />
Current<br />
Total<br />
Slough<br />
Mosaic<br />
Total<br />
Natural<br />
Cover<br />
Levelled<br />
Slough<br />
Mosaic *:<br />
% of<br />
<strong>Watershed</strong><br />
Levelled<br />
Slough<br />
Mosaic<br />
*: % of<br />
Original<br />
Slough<br />
Mosaic<br />
Slough<br />
Mosaic<br />
Loss<br />
Indicator:<br />
∑ last 2<br />
columns<br />
Baker 455.0 75.1 7.1 1.2 0.1 8.3 72.7 66.7 88.9 155.6<br />
Beaver 3478.9 16.0 2.4 0.7 0.3 3.4 29.7 12.7 79.1 91.8<br />
Bertie Bay + 868.3 29.5 0.7 0.6 0.1 1.4 42.4 28.0 95.1 123.1<br />
L. <strong>Erie</strong> 1<br />
Black 6872.3 65.7 9.0 2.2 2.3 13.6 29.3 52.1 79.2 131.3<br />
<strong>Fort</strong> <strong>Erie</strong> 397.5 2.3 0 0 0 0 3.2 100 100<br />
Frenchman’s 1723.5 28.2 6.4 1.8 0.3 8.5 36.5 19.7 69.8 85.9<br />
Kraft 554.7 41.4 0.7 0.1 tr 0.9 62.7 40.5 97.8 138.3<br />
Lakeshore 364.4 17.8 0.5 0 0 0.5 29.3 17.3 97.1 114.4<br />
Miller 795.5 53.9 6.6 2.6 0.5 9.7 46.0 44.2 82.0 126.2<br />
<strong>Niagara</strong> River<br />
Shore<br />
349.4 54.1 9.2 0.4 4.8 14.5 49.0 39.7 73.3 113.0<br />
Six Mile 1813.4 20.2 1.0 0 0 1.1 39.3 19.1 94.7 113.8<br />
TOTAL 17,662.9 42.2 5.4 1.4 1.1 8.0 34.5 34.2 81.1 115.3<br />
* Built-Up areas are not included. Original extents are estimates.<br />
The severity of slough mosaic levelling varies among subwatersheds. Although all<br />
subwatersheds have had over two-thirds of their original slough pattern levelled, the southcentral<br />
subwatersheds (Beaver Creek, Frenchman’s Creek, Six Mile Creek and Bertie Bay) had<br />
less original extent to alter (ref. Table 2.6.7 and Figure NH 7).<br />
Significance<br />
Significance is summarized at three levels: species – plants and wildlife, site and subwatershed.<br />
<strong>Plan</strong>ts and <strong>Plan</strong>t Communities<br />
According to Dougan and Associates (2003), 486 vascular plants have been recorded to date for<br />
the <strong>Fort</strong> <strong>Erie</strong> Settlement Area, 454 of which were confirmed to be present in 2002. Of those,<br />
78% are native and a high proportion is Carolinian, restricted in Ontario to a range south of<br />
Toronto. Many are considered significant:<br />
• Nationally, there are 12 species regulated under the Species at Risk Act, six of which are<br />
historical observations. Thirty-five species are considered nationally rare (Argus et al.<br />
1987);<br />
• Provincially, two historic species are regulated under the Ontario Endangered Species<br />
Act; 48 species are rated provincially rare by Natural Heritage Information Centre<br />
(NHIC), of which nine are historic records; and<br />
• Regionally, Ontario Ministry of Natural Resources rates 36 species significant, of which<br />
nine are historic (Dougan and Associates, 2003).<br />
March 2008 63 <strong>Fort</strong> <strong>Erie</strong> <strong>Creeks</strong> <strong>Watershed</strong> <strong>Plan</strong><br />
General Report (105116)
The regulated species are listed in Table 2.6.8. For further detail see Dougan and Associates,<br />
Volume 2 (2003).<br />
Scientific Name<br />
TABLE 2.6.8:<br />
REGULATED PLANT SPECIES-AT-RISK (Dougan and Associates, 2003)<br />
Common Name<br />
National Status<br />
(COSEWIC)<br />
Provincial<br />
Status<br />
(COSSARO)<br />
Recovery<br />
<strong>Plan</strong><br />
Arisaema dracontium Green Dragon SC<br />
Chimaphila maculate var maculata Spotted Wintergreen END Yes<br />
Cypripedium candidum<br />
Small White Lady’s<br />
END<br />
END<br />
Slipper<br />
Eurybia divaricatus White Wood Aster THR Yes<br />
Hibiscus moscheutos ssp moscheutos Swamp Rosemallow SC<br />
Liatris spicata Spiked Blazing Star THR<br />
Liparis liliifolia Purple Twayblade END THR<br />
Morus rubra Red Mulberry END Yes<br />
Phegopteris hexagonoptera Broad Beech Fern SC<br />
Ptelea trifoliata Hop Tree SC<br />
Quercus shumardii Shumard’s Oak SC<br />
Viola pedata Bird’s-foot Violet END<br />
END = Endangered. Facing imminent extirpation or extinction throughout its range<br />
THR = Threatened. Likely to become endangered if nothing is done<br />
SC = Special Concern. Not endangered or threatened but particularly sensitive<br />
It should be noted that historic records do not eliminate the possibility of current undocumented<br />
presence if suitable habitat persists.<br />
Although some species are less at risk in the United States, populations at the northern end of<br />
their range - as are many of the rare species in <strong>Fort</strong> <strong>Erie</strong> watersheds - are often genetically<br />
important for adaptation to northern habitats (Environment Canada, 2004b).<br />
Significant communities have status regionally, provincially or globally because of the restricted<br />
abundance and range. In the Settlement Area, significant communities are largely associated<br />
with the Lake <strong>Erie</strong> shoreline and include: Great Lakes Coastal Marsh, Prairie Meadow Marsh,<br />
Tallgrass Prairie and Great Lakes Dunes. Other significant communities are Pin Oak Swamp<br />
which is common throughout the study area, and Southern Arrow-wood Mineral Thicket Swamp<br />
(Dougan and Associates, 2003).<br />
The only Life Science Area of Natural and Scientific Importance (ANSI) in the study area is<br />
Humberstone Muck Basin Swamp Forest, at the headwaters of Black Creek and part of the<br />
wetland commonly known as Humberstone Marsh. Elsewhere in the agricultural area, outside<br />
the evaluated wetlands, the most significant areas are on the east side of Ridge Road along the<br />
Onondaga Escarpment ridge (A. Garafalo, pers. comm.).<br />
The documented locations of rare species and significant communities indicate the importance of<br />
the Lake <strong>Erie</strong> shore, Humberstone Marsh, the corridor within a few kilometres of the <strong>Niagara</strong><br />
River north from <strong>Fort</strong> <strong>Erie</strong> and the Onondaga Escarpment. By subwatershed, these areas<br />
include:<br />
March 2008 64 <strong>Fort</strong> <strong>Erie</strong> <strong>Creeks</strong> <strong>Watershed</strong> <strong>Plan</strong><br />
General Report (105116)
• The shore of Lakeshore, Kraft Drain, Bertie Bay Drains (including Lake <strong>Erie</strong> 1) and Six<br />
Mile Creek subwatersheds;<br />
• Upper Black Creek subwatershed;<br />
• Frenchman’s Creek, Miller Creek, Baker Creek and <strong>Niagara</strong> River Shores subwatersheds;<br />
and<br />
• The divide between upper Beaver Creek and Six Mile Creek subwatersheds. LandCare<br />
<strong>Niagara</strong>’s Natural Heritage Framework (1998) also includes the well-vegetated Beaver<br />
Creek valleylands.<br />
All designations are current as of 2006 and will need periodic review as Species-At-Risk lists<br />
change.<br />
Wildlife<br />
According to information gathered as part of the <strong>Fort</strong> <strong>Erie</strong> Natural Areas Inventory (NAI)<br />
(Dougan & Associates, 2003), as well as recent results of the Ontario Breeding Bird Atlas<br />
(OBBA), approximately 200 resident or breeding wildlife species (i.e. excluding migrants) have<br />
been documented from the <strong>Fort</strong> <strong>Erie</strong> <strong>Creeks</strong> watersheds area and immediate vicinity including<br />
Point Abino. Only the lists for amphibians and reptiles (24), birds (119) and mammals (15) from<br />
the NAI can be considered complete or comprehensive. The remaining wildlife species on file<br />
are composed of insects (36) and crustaceans (1).<br />
While most of the species have been recently documented (as is the case with the results of the<br />
OBBA), a few of the records are very dated, going back to the late 19 th century and first half of<br />
the 20 th century. Examples are: Spring Salamander (1877), Spotted Turtle (1914), Loggerhead<br />
Shrike (1906), Piping Plover (1934, 1936), Grey Fox (1952) and Prothonotary Warbler (1959),<br />
and Woodland Vole (1946), most (or all) of which have been extirpated as breeding residents.<br />
Of the 200 wildlife species, nineteen (19) are designated as ‘Species at Risk’, i.e., they are<br />
designated as “Special Concern”, “Threatened”, or “Endangered” in Canada (COSEWIC, 2005)<br />
or Ontario (OMNR, 2005). Included are: one (1) species of insect, seven (7) species of<br />
amphibians and reptiles, nine (9) species of birds and two (2) species of mammal. Nine (9) of<br />
the nineteen (19) species have been reported in the last two decades.<br />
According to the Natural Heritage Information Centre, 19 species are regarded as provincially<br />
‘rare’, [i.e., those designated as S1, S2, or S3 (NHIC, 2006)]. Not all of the species are the same<br />
as the ‘Species at Risk’. Both sets are included and distinguished in Table 2.6.9. Designations<br />
change as species’ status changes through time – either because of recovery or of heightened<br />
risk.<br />
March 2008 65 <strong>Fort</strong> <strong>Erie</strong> <strong>Creeks</strong> <strong>Watershed</strong> <strong>Plan</strong><br />
General Report (105116)
TABLE 2.6.9:<br />
PROVINCIALLY & NATIONALLY SIGNIFICANT WILDLIFE SPECIES<br />
<strong>Conservation</strong> Status<br />
Common Name<br />
Scientific Name National Provincial<br />
COSEWIC † OMNR ‡ SRank*<br />
Recent or<br />
Historic<br />
Data Source<br />
Damselflies & Dragonflies<br />
1 Swamp Darner Epiaeschna heros S3 Recent A<br />
Butterflies<br />
1 Monarch Danaus plexippus SC SC S4 Recent A<br />
Amphibians & Reptiles<br />
1 Northern Dusky Salamander Desmognathus fuscus NAR END-R S1 Historic B<br />
2 Spring Salamander Gyrinophilus porphyriticus SC EXP SX Historic B, C, D<br />
3 Fowlers Toad Bufo fowleri THR THR S2 Recent B, C, D<br />
4 Spotted Turtle Clemmys guttata END END S3 Historic C<br />
5 Blanding’s Turtle Emydoidea blandingii THR THR S3 Historic B, C<br />
6 Eastern Hog-nosed Snake ◊ Heterodon platirhinos THR THR S3 Recent B<br />
7 Milksnake Lampropeltis triangulum SC SC S3 Recent B<br />
Birds<br />
1 Great Egret Casmerodius albus S2B Recent E<br />
2 Black-crowned Night-Heron Nycticorax nycticorax S3B Recent E<br />
3 Red-shouldered Hawk Buteo lineatus NAR SC S4B Recent E, F<br />
4 Northern Bobwhite Colinus virginianus END END S1S2B Recent E<br />
5 Piping Plover Charadrius melodus END END-R S1B Historic C, D<br />
6 Red-headed Woodpecker Melanerpes erythrocephalus SC SC S3B Recent A, E<br />
7 Loggerhead Shrike Lanius ludovicianus END END-R S2B Historic C, D<br />
8 Tufted Titmouse Baeolophus bicolor S2S3 Recent A, C, D, E<br />
9 Cerulean Warbler Dendroica cerulea SC SC S3B Recent C, D, E<br />
10 Prothonotary Warbler Protonotaria citrea END END-R S1S2B Historic C, D<br />
11 Hooded Warbler Wilsonia citrina THR THR S3B Recent A, E<br />
12 Yellow-breasted Chat Icteria virens SC SC S2S3B Recent E<br />
Mammals<br />
1 Woodland Vole Microtus pinetorum SC SC S3 Historic D<br />
2 Grey Fox Urocyon cinereoargenteus THR THR SZB Historic C, D<br />
Legend<br />
Note: -- Species in italics may not have been recorded in the study area. Associated accuracy is very low.<br />
◊<br />
The recent Eastern Hog-nosed Snake observation was included because it was documented only a short distance outside the study area boundary. Therefore,<br />
it seems possible it could be found in the study area in the future.<br />
† COSEWIC (Committee on the Status of Endangered Wildlife in Canada). 2005. Canadian Species at Risk. Committee on the Status of Endangered<br />
Wildlife in Canada. Web site: http://www.cosewic.gc.ca/eng/sct0/rpt/rpt_csar_e.cfm [accessed 25 April 2006]<br />
‡ OMNR (Ontario Ministry of Natural Resources). 2006. Species at Risk in Ontario List: Ontario Ministry of Natural Resources Species at Risk Unit,<br />
June 30, 2006. http://www.mnr.gov.on.ca/mnr/speciesatrisk/status_list.html#thr<br />
* NHIC (Natural Heritage Information Centre). 2006a. NHIC List of Ontario Insects: Odonata. Ontario Natural Heritage Information Centre Home Page.<br />
http://www.mnr.gov.on.ca/MNR/nhic/queries/listout.cfmel=iiodo<br />
NHIC (Natural Heritage Information Centre). 2006b. NHIC List of Ontario Insects: Lepidoptera. Ontario Natural Heritage Information Centre Home<br />
Page. http://www.mnr.gov.on.ca/MNR/nhic/queries/listout.cfmel=iilep<br />
NHIC (Natural Heritage Information Centre). 2006c. NHIC List of Ontario Amphibians. Ontario Natural Heritage Information Centre Home Page.<br />
http://www.mnr.gov.on.ca/MNR/nhic/queries/listout.cfmel=aa<br />
NHIC (Natural Heritage Information Centre). 2006d. NHIC List of Ontario Reptiles. Ontario Natural Heritage Information Centre Home Page.<br />
http://www.mnr.gov.on.ca/MNR/nhic/queries/listout.cfmel=ar<br />
NHIC (Natural Heritage Information Centre). 2006e. NHIC List of Ontario Birds. Ontario Natural Heritage Information Centre Home Page.<br />
http://www.mnr.gov.on.ca/MNR/nhic/queries/listout.cfmel=ab<br />
NHIC (Natural Heritage Information Centre). 2006f. NHIC List of Ontario Mammals. Ontario Natural Heritage Information Centre Home Page.<br />
http://www.mnr.gov.on.ca/MNR/nhic/queries/listout.cfmel=am<br />
SC = Special Concern; THR = Threatened; END = Endangered; END-R = Endangered – Regulated; NAR = Not at Risk<br />
S1 =<br />
S2 =<br />
S3 =<br />
Extremely rare in Ontario; usually 5 or fewer occurrences in the province or very few remaining individuals; often especially vulnerable to extirpation.<br />
Very rare in Ontario; usually between 5 and 20 occurrences in the province or with many individuals in fewer occurrences; often susceptible to extirpation.<br />
Rare to uncommon in Ontario; usually between 20 and 100 occurrences in the province; may have fewer occurrences, but with a large number of<br />
individuals in some populations; may be susceptible to large-scale disturbances. Most species with an S3 rank are assigned to the watch list, unless they<br />
have a relatively high global rank.<br />
S4 = Common and apparently secure in Ontario; usually with more than 100 occurrences in the province.<br />
S5 = Very common and demonstrably secure in Ontario.<br />
S = Not Ranked Yet, or if following a ranking, Rank Uncertain (e.g. S3). S species have not had a rank assigned.<br />
SX = Apparently extirpated from Ontario, with little likelihood of rediscovery. Typically not seen in the province for many decades, despite searches at known<br />
historic sites.<br />
SZ = Not of practical conservation concern inasmuch as there are no clearly definable occurrences; applies to long distance migrants, winter vagrants, and<br />
eruptive species, which are too transitory and/or dispersed in their occurrence(s) to be reliably mapped; most such species are non-breeders, however, some<br />
may occasionally breed.<br />
SZB = Breeding migrants/vagrants.<br />
Recent = 1986 to 2006; Historic = 1985 and before.<br />
A = <strong>Fort</strong> <strong>Erie</strong> Natural Areas Inventory (NAI) 2002 field data<br />
B = Ontario Herpetofaunal Summary data (current as of March 2003)<br />
C = OMNR NRVIS data (current as of 2002). Includes only data of individuals known to be from within study area.<br />
D = Rare species information from Natural Heritage Information Centre (NHIC) database (current as of March 2006)<br />
E = Ontario Breeding Bird Atlas data (current as of March 21, 2006)<br />
F = Bird Life of Canada's <strong>Niagara</strong> Frontier by R.W. Sheppard (1970). Published by the <strong>Niagara</strong> Falls Nature Club.<br />
March 2008 66 <strong>Fort</strong> <strong>Erie</strong> <strong>Creeks</strong> <strong>Watershed</strong> <strong>Plan</strong><br />
General Report (105116)
All designations are current as of 2006 and will need periodic review as Species-At-Risk lists<br />
change.<br />
The <strong>Niagara</strong> Area Ministry of Natural Resources office is currently preparing “habitat mapping”<br />
for the Fowler’s Toad and other Threatened and Endangered species. Map availability must<br />
await approval by the various recovery teams and vetting through guidelines for official<br />
designation as “significant habitat of Threatened and Endangered species” under the Provincial<br />
Policy Statement (Vlasman, Kara, pers. comm.). Fowler’s Toad habitat for breeding, foraging<br />
and hibernation includes several Lake <strong>Erie</strong> shore communities including ponds, creek outfalls,<br />
beaches, and rock areas and interconnecting corridors.<br />
According to the 2005 Provincial Policy Statement (PPS), the long-term protection of natural<br />
heritage features, including Significant Wildlife Habitat (SWH), is a key objective (OMMAH,<br />
2005). More specifically the PPS states “Development and site alteration shall not be permitted<br />
in… significant wildlife habitat…unless it has been demonstrated that there will be no negative<br />
impacts on the natural features or their ecological functions.”<br />
PPS implementation requires the identification of Significant Wildlife Habitat (SWH). As of<br />
March 2006, however, none has been officially identified or designated. The Ministry of Natural<br />
Resources provides technical expertise and guidance for the identification of SWH; designation<br />
rests with either the local municipality or the Regional Municipality of <strong>Niagara</strong>.<br />
The <strong>Fort</strong> <strong>Erie</strong> Natural Areas Inventory identified several features as potential Significant Wildlife<br />
Habitat (Dougan & Associates, 2003a) including:<br />
• Winter deer yards<br />
• Colonial bird nesting site<br />
• Waterfowl stopover and staging area<br />
• Migratory stopover areas for shorebirds, land birds, and butterflies<br />
• Raptor winter feeding and roosting areas<br />
• Turkey Vulture summer roosts<br />
• Bat hibernacula / reptile hibernacula<br />
• Rare vegetation communities and specialized habitats for wildlife<br />
• Habitat for area-sensitive species<br />
• Amphibian woodland breeding ponds<br />
• Habitats for species of conservation concern<br />
• Animal movement corridors.<br />
Ministry of Natural Resources NRVIS (Natural Resources Values Information System) database<br />
maps deer yard areas in many of the larger woodlots throughout the study area. The colonial<br />
bird-nesting site is a heronry in upper Frenchman’s Creek subwatershed. For additional<br />
information on the other potential Significant Wildlife Habitat features, ref. Volume 1 of the<br />
Natural Areas Inventory (Dougan & Associates, 2003).<br />
In fall and winter, waterfowl assemble by the tens of thousands along the open <strong>Niagara</strong> River.<br />
Estimates for that season include over 20% of the global population of Bonaparte’s Gull, up to<br />
14% of the North American Herring Gull population and over 1% of the North American Ring-<br />
March 2008 67 <strong>Fort</strong> <strong>Erie</strong> <strong>Creeks</strong> <strong>Watershed</strong> <strong>Plan</strong><br />
General Report (105116)
illed Gull (spring migration only), Canvasback and Common Merganser populations. Greater<br />
Scaup and Common Goldeneye can also occur in very significant numbers, often approaching<br />
1% of the North American population (IBA Site Summary for the <strong>Niagara</strong> River Corridor, Bird<br />
Studies Canada). The area meets the criteria for a globally significant Important Bird Area<br />
(IBA); the <strong>Niagara</strong> River Corridor IBA extends along the entire <strong>Niagara</strong> River shoreline and<br />
several kilometres inland.<br />
Site Significance<br />
Site significance is described by:<br />
1. Outlining the watershed natural areas’ ecological services;<br />
2. Presenting the results of Provincial, Regional, site significance ratings; and<br />
3. Presenting the results of Local site significance ratings.<br />
1. Ecological Services<br />
The natural areas of the <strong>Fort</strong> <strong>Erie</strong> <strong>Creeks</strong> <strong>Watershed</strong> provide valuable hydrological, biological,<br />
social and climate moderation services. The main hydrological services in the study area are<br />
flood moderation and water quality improvement. The watershed’s wetland extent and natural<br />
slough mosaic form are highly effective at both of these services. Evidence includes the slow<br />
recession limbs of observed event hydrographs compared to simulated ones (Section 2.2). Some<br />
of the symptoms of urbanization noted by the stream assessment (Section 2.4) may result from<br />
slough mosaic levelling and the accelerated runoff caused by agriculture. Wetland and slough<br />
mosaic importance will grow as urbanization increases imperviousness and compaction and as<br />
climate change intensifies storms. Floodplain wetlands are also widespread and play important<br />
buffer roles. The clay substrate limits most groundwater interactions to possible local recharge<br />
through fractured clay, especially where there are at least occasionally unsaturated conditions.<br />
Recharge may also occur on higher bedrock sites. For any such instances, (all areas sensitive to<br />
contamination), the natural ecosystem helps filter contaminants before recharge. The wetland<br />
evaluations consistently score high in hydrological values. Natural area distribution is<br />
widespread, reinforcing flood moderation roles. There are very few steep slopes requiring<br />
erosion control. Most are limited to dunes along Lake <strong>Erie</strong>, some of which are suffering from<br />
loss of natural cover as development occurs. Riparian buffers play a valuable role in stream<br />
protection, filtering pollutants as well as providing shade and food sources for stream biota.<br />
Biological values also tend to be high. The study area’s location in the Carolinian Zone,<br />
Canada’s zone of highest biodiversity, combines with one of the highest natural area extents in<br />
the Zone to boost the biological importance. Comparable or higher natural area concentrations<br />
in the Zone occur only at Six Nations Reserve, Walpole Island Reserve, The Pinery, Long Point<br />
and parts of Norfolk County. The study area differs from these areas in its proximity to urban<br />
population, a feature that raises its social value for recreation, education and aesthetics. The<br />
watershed is also a critical link in the corridor from the American Carolinian Zone. Adaptation<br />
to climate change will require species and community migration northward. The Great Lakes<br />
and cleared land pose major barriers. The study area is a natural funnel for migration past the<br />
lower Great Lakes barrier. The Canadian watersheds further north along the <strong>Niagara</strong> River are<br />
relatively barren of natural area. Migration into southern Ontario for successful climate change<br />
March 2008 68 <strong>Fort</strong> <strong>Erie</strong> <strong>Creeks</strong> <strong>Watershed</strong> <strong>Plan</strong><br />
General Report (105116)
adaptation, assuming breaching of Buffalo’s urban barrier, will likely be heavily reliant on the<br />
<strong>Fort</strong> <strong>Erie</strong> watersheds’ natural area.<br />
Natural areas provide or potentially can provide products such as timber.<br />
The immature forest age classes can play a role in carbon uptake as they grow, assisting in<br />
climate change mitigation. In addition, the high natural area extent near built-up areas moderates<br />
high summer temperatures both through shade and evapotranspiration effects, provides winter<br />
wind breaks and plays a significant role in improving air quality (American Forests, 1999).<br />
2. Provincial and Regional Significance<br />
Site significance is mapped on Figure NH 5; percentages are presented in Table 2.6.10. The<br />
highest concentrations of provincially-significant Environmental Protection Areas (EPA) are in<br />
the watersheds of Baker Creek, Kraft Drain and Miller Creek. This pattern corresponds with the<br />
pattern of more mature forest indicated on Figure NH 4. Only Lakeshore and <strong>Fort</strong> <strong>Erie</strong> are<br />
below 10% designated as Environmental Protection Area. The highest concentrations of<br />
regionally significant Environmental <strong>Conservation</strong> Areas (ECA) occur in Bertie Bay Drains<br />
(including Lake <strong>Erie</strong> 1) and in the <strong>Niagara</strong> River Shore subwatersheds.<br />
Combining the EPA and ECA significance categories shows a pattern of highest percentage in<br />
the Settlement Area subwatersheds, excluding the two most built-up subwatersheds, (i.e., <strong>Fort</strong><br />
<strong>Erie</strong> and Lakeshore). In rural areas, significant areas are much sparser.<br />
TABLE 2.6.10<br />
SIGNIFICANT NATURAL AREAS – PERCENTAGES BY SUBWATERSHED (as of June 2005)<br />
Subwatershed<br />
% %<br />
% LSA* (of part of basin in<br />
% EPA + ECA<br />
EPA* ECA*<br />
Settlement Area)<br />
Baker 33.3 21.3 54.5 66.5<br />
Beaver 11.7 12.2 23.9 26.7<br />
Bertie Bay Drains +<br />
L. <strong>Erie</strong> 1<br />
1.9 38.8 40.7 39.8<br />
Black 12.0 11.5 23.5 40.8<br />
<strong>Fort</strong> <strong>Erie</strong> 0 5.5 5.5 2.3<br />
Frenchman’s Creek 16.6 20.0 36.6 27.6<br />
Kraft Drain 27.4 24.7 52.1 57.2<br />
Lakeshore 5.5 26.7 32.2 20.7<br />
Miller 20.5 20.1 40.6 44.8<br />
<strong>Niagara</strong> R. Shore 12.0 37.8 49.8 39.2<br />
Six Mile Creek 12.0 19.7 31.7 38.8<br />
TOTAL 12.9 16.4 29.3 37.8<br />
* EPA is Environmental Protection Area.<br />
* ECA is Environmental <strong>Conservation</strong> Area.<br />
* LSA is Locally Significant Area<br />
3. Locally Significant Areas<br />
Figure NH 5 also shows the Settlement Area’s Locally Significant Areas (LSA) as mapped by<br />
the Natural Areas Inventory (Dougan and Assoc., 2003). Table 2.6.10 includes LSA percentages<br />
within the Settlement Area. Since the Agricultural Area’s LSA inventory to date has assessed<br />
only a small number of the natural areas, Agricultural Area LSA percentages are not included.<br />
In the Settlement Area, LSA area extent ranges from a low of 2.3% within the built-up <strong>Fort</strong> <strong>Erie</strong><br />
subwatershed to two-thirds of Baker Creek subwatershed. Of the total Settlement Area, 37.8% is<br />
March 2008 69 <strong>Fort</strong> <strong>Erie</strong> <strong>Creeks</strong> <strong>Watershed</strong> <strong>Plan</strong><br />
General Report (105116)
ated Locally Significant, a high proportion of valuable “green infrastructure” compared to most<br />
southern Ontario municipalities. Since these significant areas represent the full range of<br />
significance from local to provincial, they generally correspond with the Environmental<br />
Protection Areas and Environmental <strong>Conservation</strong> Areas mapped by the Region and often extend<br />
further. Very little Environmental Protection Area is not rated Locally Significant within the<br />
Settlement Area; scattered areas of Environmental <strong>Conservation</strong> Areas, however, do not<br />
correspond. The differences reflect some differences in criteria for the two levels of<br />
investigation, Locally Significant Area criteria being more site-specific.<br />
Subwatershed Criteria<br />
Environment Canada (2004a) developed guidelines that use landscape ecology concepts to set<br />
benchmarks to assist development of natural heritage strategies and planning both for Areas of<br />
Concern and for other southern Ontario watersheds. Most of the study area is within the<br />
<strong>Niagara</strong> River Area of Concern. The guidelines are not intended as strict targets but as useful<br />
ecological “yardsticks” that should be considered within the unique context of each study area.<br />
Guidelines represent minimum desirable habitat proportions. Landscapes with habitat exceeding<br />
these minimum amounts should be conserved and enhanced whenever possible (Environment<br />
Canada, 2004a).<br />
Important parameters include percentage of wetlands, forests, interior forests and riparian cover.<br />
Other forest parameters include largest patch and distance between patches.<br />
Wetlands in the <strong>Fort</strong> <strong>Erie</strong> study area, in addition to being valuable habitat, play important<br />
hydrological roles. The numerous sloughs in the natural clay plain landscape trap water, both<br />
moderating floods and treating contaminants. The guidelines use studies (e.g., Hey and<br />
Wickencamp, 1996) that find hydrological services improve most markedly with additional<br />
wetland area up to the 10 percent level of wetland coverage. Improvements continue as wetland<br />
area increases beyond 10 per cent of the watershed but at a slower rate. The maximum wetland<br />
extent possible provides the best hydrological services.<br />
Forest extent is an important factor in habitat quality. The 30% minimum threshold identified as<br />
a guideline by Environment Canada (2004a) has been shown to be a level that supports most or<br />
all of the bird species of the geographical range (Freemark, 1988, Cadman et al, 1987). Forest<br />
can provide hydrological services of water retention and water quality improvement. Many<br />
species also require large forest patch sizes to approximate conditions of the original landscape<br />
and avoid disturbances associated with the forest edge (Tate, 1998). This requirement is<br />
reflected in parameters for the size of the largest patch and for percentage of interior forest.<br />
Connectivity among forest patches is an important factor for re-colonization by wildlife.<br />
Abundant forest cover within two kilometres of a forest patch was found to be a significant<br />
predictor for forest-interior birds (Austin and Bradstreet, 1996).<br />
Riparian buffers protect stream quality and provide habitat.<br />
March 2008 70 <strong>Fort</strong> <strong>Erie</strong> <strong>Creeks</strong> <strong>Watershed</strong> <strong>Plan</strong><br />
General Report (105116)
Although the slough mosaic is not part of Environment Canada’s guidelines, its presence in<br />
natural areas is also noted because of its important role in the study area’s natural area<br />
functioning – both biological and hydrological.<br />
Table 2.6.11 presents the results of the subwatershed analyses for the habitat guidelines. Shaded<br />
cells indicate that the minimum guideline is met.<br />
TABLE 2.6.11<br />
STATUS OF SUBWATERSHED HABITAT RELATIVE TO MINIMUM GUIDELINES (Shaded cells indicate guideline is met)<br />
Subwatershed<br />
%<br />
wetland<br />
%<br />
forest<br />
Area<br />
largest<br />
forest<br />
patch (ha)<br />
% Interior<br />
forest: 100<br />
m edge<br />
% Interior<br />
forest: 200<br />
m edge<br />
Number of<br />
patches >2<br />
km from<br />
another<br />
% Riparian<br />
Buffers (30<br />
m)<br />
% Natural Area<br />
With Slough<br />
Mosaic (no<br />
guideline)<br />
Baker 39.8 47.2 98.3 9.2 0.8 0 78.8 8.3<br />
Beaver 14.5 23.9 94.4 1.9 0.1 0 51.3 3.1<br />
Bertie Bay<br />
1.3<br />
Drains + L. <strong>Erie</strong><br />
1<br />
15.4 24.5 54.5 3.4 0.1 0 83.7<br />
Black<br />
280.5 +<br />
11.2<br />
15.5 20.5 beyond<br />
basin<br />
3.0 0.5 0 42.9<br />
<strong>Fort</strong> <strong>Erie</strong> 0 1.0 7.1 0 0 0 NA 0<br />
Frenchman’s<br />
8.2<br />
18.8 22.7 117.4 6.2 1.8 0 58.3<br />
Creek<br />
Kraft Drain 38.2 42.8 103.7 11.8 1.9 0 91.7 0.8<br />
Lakeshore 10.8 22.9 39.1 0.7 0 0 36.3 0.5<br />
Miller 22.3 28.8 98.0 5.6 0.5 0 62.9 9.2<br />
<strong>Niagara</strong> R. Shore 15.8 27.4 85.5 3.1 0.1 0 51.6 9.6<br />
Six Mile Creek 13.8 23.2 85.4 2.2 0 0 69.4 1.0<br />
TOTAL 16.6 23.4<br />
280.5 +<br />
beyond<br />
basin<br />
3.5 0.5 0 53.8 6.8<br />
Wetland and Forest Percentages: Every subwatershed except the almost completely built-up <strong>Fort</strong><br />
<strong>Erie</strong> subwatershed meets and considerably exceeds the minimum wetland guideline of 10%<br />
cover per watershed and 6% per subwatershed. All but <strong>Fort</strong> <strong>Erie</strong> subwatershed exceed twothirds<br />
of the 30% minimum forest guideline but only Baker Creek and Kraft Drain<br />
subwatersheds exceed 30%, both by a substantial margin. The study area’s forest and wetland<br />
percentage values are high for southern Ontario. The wetland estimates exceed those of NWQPS<br />
because much more area has been mapped as evaluated wetland since NWQPS. The newly<br />
evaluated areas were flagged by NWQPS as probably containing wetland inclusions but were<br />
counted as only 40% wetland in area on the basis of the slough extent within those areas. The<br />
shift to the evaluated wetland designation maintains the locations but boosts the area calculation<br />
to 100%. Inclusion of shrub areas as possible future forest pushes percentages near or over 30%<br />
for all subwatersheds but <strong>Fort</strong> <strong>Erie</strong> (ref. Table 2.6.4).<br />
Largest Forest Patch: If roads are considered patch boundaries, no forest patch exceeds 200 ha.<br />
Overlooking road effects, only Humberstone Marsh in Black Creek exceeds the minimum<br />
guideline of 200 ha area at least 500 m in width, and it further exceeds the guideline when area<br />
beyond the basin is included. The only other large patch that crosses the study area boundary is<br />
the northernmost woodlot – a small corner of a large (over 100 ha) woodlot extends into the<br />
study area. Beaver Creek’s largest forest patch is partially in Black Creek subwatershed. If the<br />
Beaver Creek valley land system were included, the area would exceed 200 ha. In all<br />
March 2008 71 <strong>Fort</strong> <strong>Erie</strong> <strong>Creeks</strong> <strong>Watershed</strong> <strong>Plan</strong><br />
General Report (105116)
subwatersheds, many of the forest patches are separated from others by relatively small<br />
intrusions.<br />
Interior Forest: Interior forest greater than 100 m and 200 m from the forest edge is mapped in<br />
Figure NH 6. Only Kraft Drain meets the 10% interior forest (>100 m) minimum guideline. If,<br />
however, rural roads and hydro corridors are not considered forest edge, Baker Creek also meets<br />
the 10% guideline and approaches the 5% minimum guideline for area greater than 200 m from<br />
the edge. Frenchman’s Creek and Miller Creek subwatersheds exhibit moderate amounts of<br />
interior forest. Disregarding the <strong>Fort</strong> <strong>Erie</strong> subwatershed where there is no interior forest, the<br />
lowest interior forest percentages occur in Beaver Creek, Lakeshore and Six Mile Creek<br />
subwatersheds. Lakeshore subwatershed’s percentage would improve significantly, especially<br />
for interior greater than 100 m from the edge, if roads are not counted as edge. Bertie Bay<br />
Drains and <strong>Niagara</strong> River Shore, although approaching the study area’s average interior<br />
percentage for greater than 100 m from the edge, fare poorly for percentage of area greater than<br />
200 m.<br />
Distance to the Nearest Woodlot: The entire study area meets the minimum guideline of all<br />
forest patches being within 2 km. Many species, however, need closer proximity for successive<br />
migration, colonization and on-going population health. The Core Natural Heritage Map of the<br />
Region, municipal draft OP’s, Land Care <strong>Niagara</strong> (1998) and the Natural Areas Inventory<br />
propose corridor systems. The most complete existing corridors occur between the QEW and the<br />
<strong>Niagara</strong> River through Lower Frenchman’s Creek, Miller Creek and Baker Creek subwatersheds.<br />
Beaver Creek valley lands are also very well connected. Proposed corridors with significant<br />
current gaps occur in the subwatersheds flowing into Lake <strong>Erie</strong> and some of the rural headwaters<br />
links both among study area subwatersheds and beyond.<br />
Riparian Buffer: Baker Creek, Bertie Bay Drains and Kraft Drain subwatershed stream systems<br />
exceed the minimum guideline of 75% natural riparian buffers within 30 m of the streams. All<br />
but Black Creek and Lakeshore streams exceed 50%. Overall, the study area has 53.8% natural<br />
riparian cover.<br />
Natural Area With Slough Mosaic: The subwatersheds with the highest proportion of their<br />
natural area containing slough mosaic are Black Creek and the broad corridor of Frenchman’s,<br />
Miller and Baker <strong>Creeks</strong>. Although Environment Canada (2004a) offers no guidelines, a target<br />
consistent with natural landscape functioning could be the proportion of natural area originally<br />
containing the slough mosaic (for estimates, see Table 2.6.7 Original Slough Mosaic column).<br />
No subwatershed approaches their original proportion, an indication of the widespread levelling<br />
that has occurred even under the regenerating natural areas. For the whole study area, the current<br />
proportion of 6.8% of the natural area containing slough mosaic units is far lower than the 42.2%<br />
estimate for original conditions.<br />
Issues<br />
The Regional and Municipal Official <strong>Plan</strong>s protect the extent of much of the natural area from<br />
development. Among development issues, particular concern applies to lakeshore development.<br />
<strong>Fort</strong> <strong>Erie</strong>’s shoreline vegetation communities of dunes, coastal marshes, prairie meadow marsh<br />
and tallgrass prairie are extremely significant, some rated as very rare globally (Dougan and<br />
March 2008 72 <strong>Fort</strong> <strong>Erie</strong> <strong>Creeks</strong> <strong>Watershed</strong> <strong>Plan</strong><br />
General Report (105116)
Associates, 2003). Similarly, associated wildlife species are highly significant. A well-known<br />
example is the threatened Fowler’s Toad. Much of the shoreline has been developed and<br />
proximity to large populations raises development pressure on the remainder. Future<br />
development applications may encounter constraints as MNR identifies significant wildlife<br />
habitat.<br />
Despite good Official <strong>Plan</strong> protection of natural area extent, several issues remain that can affect<br />
natural area functioning. One relates to the extensive levelling of the original slough microtopography<br />
for improved agricultural drainage. When these areas regenerate natural cover<br />
following abandonment, they lack much of their capacity for water retention and offer much<br />
lower hydrological services than unlevelled natural areas (NWQPS: Phase 2, 2003). Their range<br />
of microhabitats is far lower than their unaltered form, permanently thwarting prospects of<br />
greatly improved biodiversity for both vegetation communities and wildlife as areas mature. The<br />
same prospect awaits restoration areas unless the micro-topography is also restored.<br />
The above issues and others, including lack of riparian buffers, effects of agricultural runoff and<br />
climate change are discussed under Impact Assessment in Section 4.3.<br />
In the time period of the watershed plan, predictions of reduced oil access and increased prices<br />
could impose significant changes on society. Implications to the watershed natural areas may<br />
include:<br />
• Increased pressures on shorelines as large nearby populations seek recreation closer to<br />
home;<br />
• Increased pressures on urban natural areas as infill strives to reduce car use;<br />
• Care in shoreline planning to accommodate wind power generation;<br />
• Increased agricultural effects as local food sources become more competitive; and<br />
• Possible use of fast-growing willow for ethanol production.<br />
Administrative issues include:<br />
• The range of habitat types and issues requiring a range of management strategies; and<br />
• Lack of one information hub for ecosystem data. <strong>Plan</strong>ning decisions can suffer from<br />
missing or un-coordinated information.<br />
Economic issues, also common to other parts of southern Ontario, include:<br />
• The need for improved rural income to fund stewardship practices; and<br />
• The need for recognition of the value of ecosystem services and green infrastructure.<br />
2.6.4 Summary of Significant Features/Constraints<br />
Subwatersheds in the For <strong>Erie</strong> <strong>Creeks</strong> <strong>Watershed</strong> Area are rich in wetland and natural area<br />
extent. These features provide valuable habitat, hydrological services and recreational potential.<br />
Biological importance is highest at the Lake <strong>Erie</strong> shoreline, Humberstone Marsh, the large<br />
mature and connected woodlots inland from the <strong>Niagara</strong> River north of <strong>Fort</strong> <strong>Erie</strong>, and the<br />
Onondaga Escarpment. The original landscapes are generally represented in their original<br />
March 2008 73 <strong>Fort</strong> <strong>Erie</strong> <strong>Creeks</strong> <strong>Watershed</strong> <strong>Plan</strong><br />
General Report (105116)
proportions; many of the mesic sites, however, are shrub communities rated Locally Significant<br />
but overlooked by the Regional designation. A major issue is the natural areas’ relative<br />
immaturity and history of clearing. Historical cultivation often obliterated the slough mosaic’s<br />
micro-topography that is critical to both hydrological services and biodiversity. Immature<br />
communities also tend to be less diverse and less representative of the original natural heritage.<br />
Existing protection designations will maintain areas as they develop into more mature<br />
successional stages but active management will be needed to restore the micro-topography and to<br />
allow the sites to maximize their ecological services from a hydrology and associated wildlife<br />
management perspective. The watershed’s landscape characteristics raise the vulnerability of its<br />
natural areas to climate change effects.<br />
The natural areas, although extensive, are often fragmented. In some cases, relatively little<br />
restoration could provide a large boost in interior extent. Urban proximity, however, can be in<br />
itself detrimental to the presence of some interior species. A balance is required between urban<br />
infill requirements to avoid the detrimental effects of sprawl and the potential for improving<br />
interior extent. The larger blocks through lower Frenchman’s Creek, Miller Creek and Baker<br />
Creek subwatersheds combine maturity, size, and potential for improved forest interior extent<br />
with a lower built-up density and may present the best options for restoration effort to increase<br />
interior extent, subject to <strong>Fort</strong> <strong>Erie</strong>’s Proposed Draft Official <strong>Plan</strong>. They also are part of the<br />
Important Bird Area corridor associated with the <strong>Niagara</strong> River.<br />
Natural communities along the Lake <strong>Erie</strong> shoreline are highly significant, very limited in extent<br />
and under strong development pressure.<br />
The rural subwatersheds have lower coverage of both wetland and forest than the Settlement<br />
Area subwatersheds. Compared to their original landscape proportions, they are lacking in mesic<br />
natural areas. Their recent history has been less dynamic than in the Settlement Area, resulting<br />
in a relatively high proportion of mature sites but less forest regeneration. An important<br />
exception is the expansion in the Beaver Creek valley land forest cover. Much of the Black<br />
Creek valley land system, and parts of the upper Frenchman’s and upper Beaver Creek systems<br />
lack natural cover. The headwaters of all three systems also have core areas that could be<br />
connected for improved interior habitat. The distance from urban influence would raise the<br />
potential of interior forest reaching its habitat potential. Agricultural needs, however, are<br />
important considerations.<br />
The Official <strong>Plan</strong>s protect Environmental Protection Areas and require maintenance of natural<br />
area function for intrusion into Environmental <strong>Conservation</strong> Areas. These designations apply to<br />
a large proportion of the natural areas and to over 29% of the watershed. A concentration of the<br />
Environmental Protection Area and Environmental <strong>Conservation</strong> Area designations occurs in the<br />
Settlement Area and will be a major constraint on the location of future development.<br />
Importance:<br />
2.7 Water Quality<br />
Development of the study area would require the application of stormwater quality management<br />
practices, in order to meet Federal and Provincial objectives for the protection of fisheries and<br />
downstream riparian interests.<br />
March 2008 74 <strong>Fort</strong> <strong>Erie</strong> <strong>Creeks</strong> <strong>Watershed</strong> <strong>Plan</strong><br />
General Report (105116)
2.7.1 Background Information Collection<br />
• Water Quality spreadsheets received from the NPCA, including the following<br />
information (ref. Appendix ‘SM-C’):<br />
• NPCA monthly grab sampling data current to June 2007<br />
‣ NPCA monthly field data current to June 2007<br />
‣ NPCA grab sampling data for 2001-2002<br />
‣ NPCA BioMAP results current to most recent sampling event in fall 2005<br />
‣ Historic NPCA BioMAP data<br />
‣ Monitoring station information (i.e. GIS coordinates)<br />
2.7.2 Work Activities<br />
• A mass balance has been completed as part of the NWQPS, using event mean<br />
concentrations for loading.<br />
• The Groundwater Study has been reviewed to identify high sensitivity groundwater sites<br />
in the watershed.<br />
• Existing benthic invertebrate data has been compiled and assessed using appropriate<br />
water quality indices. Water chemistry data has been compiled and reviewed in the<br />
context of the provincial water quality guidelines.<br />
• The Study Team has identified potential sources of pollution in the watershed<br />
characterization phase, which has assisted in developing the management strategies and<br />
opportunities for water quality enhancement (ref. Section 2.8.3).<br />
2.7.3 Findings<br />
Currently, the NPCA, in collaboration with other partners, has a network of surface water and<br />
groundwater monitoring stations. There are currently two types of surface water quality<br />
monitoring programs that are ongoing in the study area which characterize the water quality and<br />
have the potential to identify spatial and temporal trends. One type monitors surface water<br />
quality directly and the other monitors the benthic invertebrate community using the BioMAP<br />
protocol.<br />
2.7.3.1 BioMAP Sites<br />
The NPCA operates a biological surface water quality monitoring program using benthic<br />
macroinvertebrates as indicators of water quality. The benthic macroinvertebrates monitoring<br />
program was initiated in 1995 using the BioMAP protocol. There are currently five BioMAP<br />
stations (one in Black Creek and four in Frenchman’s Creek) located within <strong>Fort</strong> <strong>Erie</strong> Creek<br />
watersheds (the location of BioMAP stations is shown in Figure 20). The results of the 2001 to<br />
2003 analyses have been summarized in the Table 2.7.4 below. The BioMAP analysis at all five<br />
monitoring sites indicate that water quality is impaired.<br />
March 2008 75 <strong>Fort</strong> <strong>Erie</strong> <strong>Creeks</strong> <strong>Watershed</strong> <strong>Plan</strong><br />
General Report (105116)
TABLE 2.7.4:<br />
NPCA BENTHIC INVERTEBRATE WATER QUALITY DATA FOR BLACK CREEK AND FRENCHMAN'S CREEK: 2001-2004<br />
Monitoring Stations Date Sampled WQI (d) Results Status WQI (q) Results Status<br />
BL001 Fall 2001 6.0 Impaired 2.0 Impaired<br />
FR000 Spring 2002 7.45 Impaired 2.50 Impaired<br />
FR000 Spring 2003 5.78 Impaired 2.25 Impaired<br />
FR001 Spring 2003 6.38 Impaired 2.25 Impaired<br />
FR003 Spring 2003 5.59 Impaired 2.30 Impaired<br />
Source: <strong>Niagara</strong> <strong>Peninsula</strong> <strong>Conservation</strong> Authority<br />
WQI (d)= calculated Water Quality Index for benthic invertebrate density (quantitative)<br />
WQI (q)= calculated Water Quality Index for benthic invertebrate diversity (qualitative)<br />
The NPCA also collected BioMAP samples in 1997 and 1998 within the study area, at the<br />
following locations:<br />
TABLE 2.7.5<br />
NPCA HISTORIC BENTHIC SAMPLING<br />
Year Date Location WQI (d) Status<br />
1997 May 12-20 Frenchman’s Creek and Bowen Road 6.5 Poor<br />
1997 Summer Black Creek and Winger St/Main St N/A Fair-Poor<br />
1997 Summer Black Creek and Stevensville <strong>Conservation</strong> Authority N/A Fair-Poor<br />
1997 Summer Frenchman’s Creek at Gilmore Rd N/A Fair-Poor<br />
1998 May 4-12 Frenchman’s Creek upstream of golf course 8.5 Poor<br />
1998 May 4-12 Frenchman’s Creek in pond 8.2 Poor<br />
1998 May 4-12 Frenchman’s Creek downstream of the weir 7.6 Poor<br />
1998 October 22 Frenchman’s Creek upstream of golf course 5.8 Poor<br />
1998 October 22 Frenchman’s Creek in pond 1.6 Poor<br />
1998 October 22 Frenchman’s Creek downstream of the weir 6.6 Poor<br />
2.7.3.2 Surface Water Quality Monitoring Network<br />
The NPCA also has networks of sampling and collections sites for various monitoring programs<br />
conducted by the Authority within the <strong>Niagara</strong> <strong>Watershed</strong>. The monitoring sites include both<br />
BioMAP and water quality grab-sampling sites. In 2007, within the <strong>Fort</strong> <strong>Erie</strong> <strong>Creeks</strong> <strong>Watershed</strong>s<br />
<strong>Plan</strong> study area, there were 6 water quality monitoring stations (ref. Figure 20). Six Mile Creek<br />
Station SM001 and Krafts Drain Station KD001 were added to the monitoring network in 2007.<br />
As a result, there is very limited data currently available. Grab samples have been collected<br />
monthly by the NPCA during the ice-free season, and laboratory analysis have been performed<br />
in collaboration with the Region of <strong>Niagara</strong> Environmental Laboratory. We note the following<br />
Provincial Water Quality Objectives (PWQO) for reference purposes (MOE 1999), with values<br />
in mg/l, except for E. coli (CFU/100 ml).<br />
Aluminum<br />
Ammonia as N<br />
Beryllium (75 mg/l CaCo 3 hardness)<br />
Boron<br />
Bromide<br />
Cadmium (100 mg/l CaCo 3 hardness)<br />
Chromium<br />
Cobalt<br />
0.075 mg/l<br />
0.02 mg/l<br />
0.011 mg/l<br />
1.1 mg/l<br />
0.2 mg/l<br />
0.2 mg/l<br />
0.0001 mg/l<br />
0.0005 mg/l<br />
0.001 mg/l<br />
0.0009 mg/l<br />
March 2008 76 <strong>Fort</strong> <strong>Erie</strong> <strong>Creeks</strong> <strong>Watershed</strong> <strong>Plan</strong><br />
General Report (105116)
Copper<br />
0.005 mg/l<br />
E. coli 100 CFU/100 ml<br />
Iron<br />
0.3 mg/l<br />
Lead<br />
0.005 mg/l<br />
Molybdenum<br />
0.04 mg/l<br />
Nickel<br />
0.025 mg/l<br />
Phosphorus (total)<br />
0.03 mg/l<br />
Silver<br />
0.0001 mg/l<br />
Thallium<br />
0.0003 mg/l<br />
Zinc<br />
0.02 mg/l<br />
Data from the selected sampling stations, for the years 2003 to 2007, have been summarized in<br />
Table 2.7.6.<br />
March 2008 77 <strong>Fort</strong> <strong>Erie</strong> <strong>Creeks</strong> <strong>Watershed</strong> <strong>Plan</strong><br />
General Report (105116)
Site ID Date Alkalinity Aluminum<br />
Ammonia<br />
as N<br />
TABLE 2.7.6<br />
NPCA SURFACE WATER QUALITY DATA 2003-2007: BLACK CREEK & FRENCHMAN'S CREEK<br />
(Units are in mg/L except for: Conductivity=uS/cm, E. coli & total coliform=CFU/100 Ml)<br />
Conductivity<br />
Barium Beryllium Boron Bromide Cadmium Calcium Chloride Chromium Cobalt<br />
Copper E. coli Fluoride Hardness Iron Lead Magnesium Manganese Molybdenum<br />
BL001<br />
22-May-<br />
03<br />
74 3.4
Site ID Date Nickel<br />
Nitrate as<br />
N<br />
Nitrite<br />
as N<br />
pH<br />
Phosphate<br />
Phosphorus<br />
(Total)<br />
TABLE 2.7.6 Con’t<br />
NPCA SURFACE WATER QUALITY DATA 2003-2007: BLACK CREEK & FRENCHMAN'S CREEK<br />
(Units are in mg/L except for: Conductivity=uS/cm, E. coli & total coliform=CFU/100 Ml)<br />
Potassium Silver Sodium Strontium Sulphate Thallium Tin Titanium<br />
Total<br />
Coliform<br />
Total<br />
Dissolved<br />
Solids<br />
Total<br />
Kjeldahl<br />
Nitrogen<br />
Total<br />
Solids<br />
Total<br />
Suspended<br />
Solid<br />
Uranium Vanadium Zinc<br />
BL001<br />
22-May-<br />
03<br />
Site ID Date Alkalinity Aluminum<br />
Ammonia<br />
as N<br />
TABLE 2.7.6<br />
NPCA SURFACE WATER QUALITY DATA 2003-2007: BLACK CREEK & FRENCHMAN'S CREEK<br />
(Units are in mg/L except for: Conductivity=uS/cm, E. coli & total coliform=CFU/100 Ml)<br />
Conductivity<br />
Barium Beryllium Boron Bromide Cadmium Calcium Chloride Chromium Cobalt<br />
Copper E. coli Fluoride Hardness Iron Lead Magnesium Manganese Molybdenum<br />
BL003 22-May-03 95 2.7
Site ID Date Nickel<br />
Nitrate as<br />
N<br />
Nitrite<br />
as N<br />
pH<br />
Phosphate<br />
Phosphorus<br />
(Total)<br />
TABLE 2.7.6<br />
NPCA SURFACE WATER QUALITY DATA 2003-2007: BLACK CREEK & FRENCHMAN'S CREEK<br />
(Units are in mg/L except for: Conductivity=uS/cm, E. coli & total coliform=CFU/100 Ml)<br />
Potassium Silver Sodium Strontium Sulphate Thallium Tin Titanium<br />
Total<br />
Coliform<br />
Total<br />
Dissolved<br />
Solids<br />
Total<br />
Kjeldahl<br />
Nitrogen<br />
Total<br />
Solids<br />
Total<br />
Suspended<br />
Solid<br />
Uranium Vanadium Zinc<br />
BL003 22-May-03
Site ID Date Alkalinity Aluminum<br />
Ammonia<br />
as N<br />
TABLE 2.7.6<br />
NPCA SURFACE WATER QUALITY DATA 2003-2007: BLACK CREEK & FRENCHMAN'S CREEK<br />
(Units are in mg/L except for: Conductivity=uS/cm, E. coli & total coliform=CFU/100 Ml)<br />
Conductivity<br />
Barium Beryllium Boron Bromide Cadmium Calcium Chloride Chromium Cobalt<br />
Copper E. coli Fluoride Hardness Iron Lead Magnesium Manganese Molybdenum<br />
FR001 22-May-03 113 1.7
Site ID Date Nickel<br />
Nitrate as<br />
N<br />
Nitrite<br />
as N<br />
pH<br />
Phosphate<br />
Phosphorus<br />
(Total)<br />
TABLE 2.7.6<br />
NPCA SURFACE WATER QUALITY DATA 2003-2007: BLACK CREEK & FRENCHMAN'S CREEK<br />
(Units are in mg/L except for: Conductivity=uS/cm, E. coli & total coliform=CFU/100 Ml)<br />
Potassium Silver Sodium Strontium Sulphate Thallium Tin Titanium<br />
Total<br />
Coliform<br />
Total<br />
Dissolved<br />
Solids<br />
Total<br />
Kjeldahl<br />
Nitrogen<br />
Total<br />
Solids<br />
Total<br />
Suspended<br />
Solid<br />
Uranium Vanadium Zinc<br />
FR001 22-May-03
Site ID Date Alkalinity Aluminum<br />
Ammonia<br />
as N<br />
TABLE 2.7.6<br />
NPCA SURFACE WATER QUALITY DATA 2003-2007: BLACK CREEK & FRENCHMAN'S CREEK<br />
(Units are in mg/L except for: Conductivity=uS/cm, E. coli & total coliform=CFU/100 Ml)<br />
Conductivity<br />
Barium Beryllium Boron Bromide Cadmium Calcium Chloride Chromium Cobalt<br />
Copper E. coli Fluoride Hardness Iron Lead Magnesium Manganese Molybdenum<br />
FR003 22-May-03 120 2.3
Site ID Date Nickel<br />
Nitrate as<br />
N<br />
Nitrite<br />
as N<br />
pH<br />
Phosphate<br />
Phosphorus<br />
(Total)<br />
TABLE 2.7.6<br />
NPCA SURFACE WATER QUALITY DATA 2003-2007: BLACK CREEK & FRENCHMAN'S CREEK<br />
(Units are in mg/L except for: Conductivity=uS/cm, E. coli & total coliform=CFU/100 Ml)<br />
Potassium Silver Sodium Strontium Sulphate Thallium Tin Titanium<br />
Total<br />
Coliform<br />
Total<br />
Dissolved<br />
Solids<br />
Total<br />
Kjeldahl<br />
Nitrogen<br />
Total<br />
Solids<br />
Total<br />
Suspended<br />
Solid<br />
Uranium Vanadium Zinc<br />
FR003 22-May-03
A review of the NPCA water quality grab samples was conduced and several observations can be<br />
made regarding the data:<br />
Black Creek<br />
• Consistently high E. coli readings in the Black Creek at Station BL001, peaking with the<br />
January 2006 reading of 2908 CFU/100 ml, higher than the Provincial Water Quality<br />
Objective of 100 CFU/100 ml (MOE 1999).<br />
• High E. coli readings (100-200 CFU/100 ml) at Station BL003, over the PWQO of 100<br />
CFU/100 ml in four samples out of 20 (20%).<br />
• Consistently elevated Total Phosphorous (TP) levels (over 10 x the Provincial Water<br />
Quality Objective, or PWQO of 0.03 mg/l) at Station BL001 and BL003.<br />
• Zinc concentrations meeting or exceeding the PWQO of 0.020 mg/l were taken at BL001<br />
four times over the sampling duration (2003-2007), and four times at BL003.<br />
• Stations BL001 and BL003 routinely recorded Iron concentrations above the PQO of<br />
0.3 mg/l.<br />
Frenchmans Creek<br />
• Extremely high E. coli readings (>1000) at Frenchman’s Creek in summer 2006 (June,<br />
July, August) at Station FR001 and FR003, over the PWQO of 100 CFU/100 ml.<br />
• Consistently elevated Total Phosphorous (TP) levels (over 10 x the Provincial Water<br />
Quality Objective, or PWQO of 0.03 mg/l) at Station FR001 and FR003.<br />
• In addition to the routine exceedences of the PWQO for Total Phosphorus, there were<br />
notably high readings at Station FR003 in June, July, and September 2003 (0.42, 0.23,<br />
and 0.31 mg/l respectively). This magnitude of concentration was not subsequently<br />
recorded in the 2004-2007 readings.<br />
• Zinc concentrations meeting or exceeding the PWQO of 0.020 mg/l were taken at FR001<br />
seventeen times over the sampling duration (2003-2007).<br />
• The highest zinc concentrations were recorded in July and August 2006 at FR003,<br />
reaching 0.061 mg/l or 3 times the PWQO of 0.020 mg/l.<br />
• Stations FR001 and FR003 routinely recorded Iron concentrations above the PWQO of<br />
0.3 mg/l<br />
• Station FR001 recorded Boron concentrations exceeding the PWQO level of 0.2 mg/l<br />
June to September 2003, and again from June to August 2006.<br />
March 2008 86 <strong>Fort</strong> <strong>Erie</strong> <strong>Creeks</strong> <strong>Watershed</strong> <strong>Plan</strong><br />
General Report (105116)
2.7.3.3 NPCA Provincial Groundwater Monitoring Network (PGMN)<br />
The NPCA is working in partnership with the Ministry of Environment to monitor the quality<br />
and quantity of groundwater (as well as hourly reporting of groundwater levels) on selected sites.<br />
There is one monitoring site in the study area at the Onondaga Escarpment (Well ID<br />
#W0000289, shown on Figure 20), and another monitoring site adjacent to the study area in the<br />
City of <strong>Niagara</strong> Falls (Well ID #W0000290, shown on Figure 20). As described previously, the<br />
water level hydrograph shows seasonal variations of up to two metres. The lowest water levels<br />
occur later on in the summer with recovery through the fall and early winter. The two metre<br />
seasonal variation would be greater than the majority of hydraulic gradients within the local to<br />
intermediate flow system setting. The chemical results indicate slightly mineralized water.<br />
2.7.3.4 Mass Balance Modelling<br />
A mass balance model has been developed in order to determine the impacts to water quality<br />
which would result from the proposed future development. This model has been based upon a<br />
spreadsheet analytical technique in order to obtain an estimate of annual loading from non-point<br />
sources for selected water quality parameters. While this information provides utility as a<br />
comparative tool for assessing impacts to in-stream water quality, which would be associated<br />
with proposed development and land use changes, the analyses are intended to provide a<br />
planning level estimate of the various pollutants and their sources. Instream concentrations and<br />
lethal levels of toxicity are not determined as part of this process.<br />
The pollutants which have been evaluated have been based upon the following general and<br />
typical water quality indicators:<br />
• Total Phosphorus<br />
• Total Nitrogen<br />
• Fecal Coliforms<br />
• Total Suspended Solids<br />
• Copper<br />
The analytical approach is based upon the Event Mean Concentration (EMC) for each<br />
constituent and land use category. Typical annual rainfall values for the geographic area are<br />
combined with runoff coefficients based upon the prevailing soil types in order to obtain annual<br />
runoff volumes. The contaminant loading for existing land use has been summarized in<br />
Table 2.7.1 and for future land use without stormwater management has been compiled in<br />
Table 2.7.2. The results (ref. Table 2.7.3) indicate an increase in pollutant loading due to<br />
increased imperviousness (ref. Appendix ‘SW-C’, for details).<br />
March 2008 87 <strong>Fort</strong> <strong>Erie</strong> <strong>Creeks</strong> <strong>Watershed</strong> <strong>Plan</strong><br />
General Report (105116)
TABLE 2.7.1<br />
SUMMARY OF ANNUAL CONTAMINANT LOADING (KG) 1<br />
EXISTING LAND USE<br />
<strong>Watershed</strong> F.Col 2 TP TSS Cu TKN<br />
Black Creek 1.13E+11 7.12E-01 5.63E+02 1.51E-02 7.12E-01<br />
Beaver Creek 1.46E+11 7.22E-01 5.57E+02 1.96E-02 7.22E-01<br />
Miller Creek 6.28E+10 5.89E-01 4.83E+02 9.12E-03 5.89E-01<br />
Baker Creek 4.65E+10 2.75E-01 2.40E+02 1.11E-02 2.75E-01<br />
Kraft Drain 1.92E+11 4.81E-01 3.82E+02 4.03E-02 4.81E-01<br />
Bertie Bay Drain / Hollister Drain 5.08E+11 1.08E+00 7.08E+02 8.98E-02 1.08E+00<br />
Six Mile Creek F.E. 2.86E+11 6.79E-01 4.69E+02 4.05E-02 6.79E-01<br />
<strong>Niagara</strong> River # 16 2.11E+11 7.01E-01 5.13E+02 2.89E-02 7.01E-01<br />
<strong>Niagara</strong> River # 19 1.89E+11 4.75E-01 3.42E+02 2.86E-02 4.75E-01<br />
<strong>Niagara</strong> River # 20 6.45E+11 8.03E-01 4.18E+02 8.89E-02 8.03E-01<br />
<strong>Niagara</strong> River # 21 2.52E+11 4.04E-01 2.60E+02 3.85E-02 4.04E-01<br />
<strong>Niagara</strong> River # 22 3.31E+11 4.84E-01 2.92E+02 4.86E-02 4.84E-01<br />
<strong>Fort</strong> <strong>Erie</strong> 1.34E+12 1.63E+00 8.21E+02 1.83E-01 1.63E+00<br />
Lake Shore 1.20E+12 1.46E+00 7.48E+02 1.64E-01 1.46E+00<br />
Lake <strong>Erie</strong> 3.31E+11 4.84E-01 2.92E+02 4.86E-02 4.84E-01<br />
1 Annual Contaminant Loading values have been determined using the tables in Appendix ‘SW-C’<br />
2 Fecal Coliform Annual Contaminant Loading is specified in Counts/Yr<br />
Importance:<br />
2.8 Rural Point and Non-Point Source Pollution<br />
• The impacts of agriculture on water quality are considered to be quite widespread and<br />
varying throughout the various watershed areas. There is a general lack of information<br />
on the significance of the amount and impact rural non-point source pollution<br />
2.8.1 Background Information Collection<br />
• A sample of a rural survey from a previous watershed plan was provided by NPCA, as<br />
well as the results of the 2005-2006 rural landowners’ survey for <strong>Fort</strong> <strong>Erie</strong> (ref.<br />
Appendix ‘E’).<br />
• Digital and hardcopy historic mapping in the study area, for locating potential point<br />
source pollutants<br />
2.8.2 Work Activities<br />
• The limits of the existing mass balance analysis have been reviewed. Several point<br />
sources of pollution have been identified through a review of the available data, primarily<br />
historic and current topographic and aerial mapping. A visual comparison of the historic<br />
map editions from 1936 to 1990 was completed.<br />
• Complemented by the landowner’s survey (mapping) and the NWQPS, an updated<br />
inventory has been prepared which documents potential sources of non-point and point<br />
source contamination.<br />
March 2008 88 <strong>Fort</strong> <strong>Erie</strong> <strong>Creeks</strong> <strong>Watershed</strong> <strong>Plan</strong><br />
General Report (105116)
2.8.3 Findings<br />
The rural landowner survey results numbered 4 responses for the Town of <strong>Fort</strong> <strong>Erie</strong> and 8<br />
responses for the City of Port Colborne. This was from a distribution of 31 and 53 surveys in the<br />
Town and City respectively. The top 4 concerns regarding their lands, from all respondents in<br />
the <strong>Niagara</strong> <strong>Peninsula</strong>, were: Government interference, erosion, water quality, and access to<br />
irrigation.<br />
In terms of point and non-point source pollutants, two of the <strong>Fort</strong> <strong>Erie</strong> respondents considered<br />
“nitrate, phosphate, and bacteria levels” in surface water a “moderate problem”, and in<br />
groundwater a “slight problem”. The presence of pesticides in surface and groundwater and<br />
septic tank seepage, were considered a “serious problem” by 2 of the 4 <strong>Fort</strong> <strong>Erie</strong> respondents.<br />
Tillage, seeding, and crop rotation were the only BMP’s listed as practiced. The survey did not<br />
ask respondents to locate or identify any point source pollutants.<br />
In terms of point source pollutants, a number of potential sources have been identified, including:<br />
• Sewage treatment plants (active and decommissioned)<br />
• Sewage pumping stations<br />
• Landfills (active and decommissioned)<br />
• Auto wreckers<br />
• Quarries<br />
• Industrial areas<br />
• Butcher/rendering operations<br />
• Combined sewer overflows<br />
These locations are identified on the Figures included in Section 6.<br />
Typical non-point sources of pollution identified include: urban development,<br />
farming/agricultural livestock and pesticide and fertilizer use, golf course fertilizer and pesticide<br />
use, roads and railroads.<br />
2.9 Lake <strong>Erie</strong> Shoreline<br />
2.9.1 Background Information Collection<br />
The following information has been collected and reviewed:<br />
• Lake <strong>Erie</strong> Shoreline Management <strong>Plan</strong> (Sandwell/Philpott, 1999)<br />
• Regional Municipality of <strong>Niagara</strong> aerial photography<br />
• NPCA Shoreline, wave uprush and dynamic layers in GIS<br />
• Assessment of Coastal Hazards, <strong>Erie</strong> Beach Development, <strong>Fort</strong> <strong>Erie</strong> (Shoreplan, 2003)<br />
• Great Lakes Flood Levels and Water Related Hazards, Provincial Shoreline Management<br />
Program (MNR 1989)<br />
March 2008 89 <strong>Fort</strong> <strong>Erie</strong> <strong>Creeks</strong> <strong>Watershed</strong> <strong>Plan</strong><br />
General Report (105116)
The Lake <strong>Erie</strong> Shoreline Management <strong>Plan</strong> describes the study area as being located within a<br />
part of reach 9-2, reach 9-3 and reaches 10-1 to 10-10. The locations of these reaches are<br />
presented in Appendix ‘WC-B’. Each of the reaches is described and categorized as to the type<br />
of shoreline and regulatory shoreline zone applicable to the reach. Although the Regulatory<br />
Shoreline Zones are similar in definition to the types of shoreline hazards defined under the<br />
technical guidelines prepared in support of the Provincial Policy Statement (PPS), the<br />
preparation of the Shoreline Management <strong>Plan</strong> (SMP) pre-dates the guidelines and therefore is<br />
not consistent with the PPS and guidelines. A summary of the hazards associated with each<br />
reach are provided in the Shoreline Management <strong>Plan</strong>.<br />
A detailed assessment of erosion rates and flood hazards was completed for the <strong>Erie</strong> Beach<br />
Development project located within reach 10-10. The assessment concluded that the use of an<br />
erosion rate of 0.15 m /year along the north shore of Lake <strong>Erie</strong> was conservative and applicable<br />
in areas where the erosion rate is controlled by the erosion of the bedrock. The flood hazard was<br />
determined to extend up to an elevation 177.11 m.<br />
2.9.2 Work Activities<br />
The shoreline of the study area was visited on three occasions. An initial site reconnaissance by a<br />
coastal engineer was completed in November 2005. This was followed by a survey of four<br />
typical beach cross-sections also in November 2005. A final field assessment of the dynamic<br />
beaches and shoreline conditions was completed in early March 2006.<br />
Locations of the sections surveyed in November 2005 and typical sections surveyed are<br />
presented in Appendix ‘WC-B’. The sections are vertically exaggerated. Run up calculations<br />
during design high water levels were completed using depth limited wave conditions for the<br />
surveyed locations. The results indicate wave uprush elevations varying from 178.6 to 179.2 m.<br />
2.9.3 Findings/Constraint Identification<br />
Shoreline hazards, as defined by technical guidelines were determined and mapped. The three<br />
hazards are:<br />
• Erosion Hazard<br />
• Flood Hazard<br />
• Dynamic Beach Hazard<br />
The extent of erosion and flood hazards were determined for the entire Lake <strong>Erie</strong> shoreline<br />
within the study area. Dynamic beach hazards were determined for three areas that are under<br />
consideration for Dynamic Beach designations. The dynamic beach designation may be<br />
modified based on comments and feedback by agencies.<br />
Erosion Hazard is defined as 100 times the average annual erosion plus a stable slope allowance.<br />
The technical guidelines suggest a default erosion rate of 0.3 m/year unless site specific erosion<br />
rate is available. Further, the technical guidelines propose a stable slope of 3 hor. : 1 vert.<br />
allowance is to be used, unless site specific investigations confirm the safe use of another slope<br />
with the appropriate factors of safety.<br />
March 2008 90 <strong>Fort</strong> <strong>Erie</strong> <strong>Creeks</strong> <strong>Watershed</strong> <strong>Plan</strong><br />
General Report (105116)
The review of the erosion data contained both in the SMP (Sandwell, Philpott, 1992) and the <strong>Erie</strong><br />
Beach Development report (Shoreplan, 2003) indicates that the use of the default value contained<br />
in the technical guidelines would result in an overly conservative estimate of erosion. The<br />
following briefly describes the critical components of the erosion process and the controlling<br />
mechanism.<br />
The Lake <strong>Erie</strong> shoreline of the study area consists of headlands and bays. The headlands are<br />
formed by rock outcrops. The bays in between consist mostly of cohesionless materials. The<br />
bays are dynamically stable. The overall erosion of the shoreline is control by erosion of the<br />
headlands. As the headlands erode, the beach shores in between erode and recede at the same<br />
rate. The erosion rate of limestone or dolomite-type shores, which form the bedrock outcrop, is<br />
very low. The reviewed reports and the references cited in them suggest that the average rate<br />
may be well less than 0.1 m/year. The SMP suggested 0.15 m/year is considered the upper limit<br />
of erosion or these bedrock outcrops.<br />
There are no available reports dealing with the slope stability of the sandy banks within the study<br />
area. Therefore, the use of the default value of 3 horizontal:1 vertical to determine the is<br />
recommended. The sum of the 100 times the erosion rate and the stable slope allowance<br />
combine to produce the erosion allowance. The extent of the Erosion Hazard is presented in<br />
Figures 15-17.<br />
Flood Hazard is defined in the technical guidelines as the limit of wave uprush during a design<br />
storm condition. A design storm condition is defined as a severe storm occurring at 1:100 year<br />
water level of 177.11 m. The technical guidelines allow for a wave uprush allowance of 15<br />
meters, measured horizontally in cases where site specific wave uprush calculations are not<br />
available. Our review of the shore conditions indicates that variability of the backshore grades<br />
and conditions is considerable and use of this horizontal allowance is the most appropriate way<br />
to provide a conservative allowance for wave uprush. The extent of the Flood Hazard is<br />
presented in Figures 15-17.<br />
Dynamic Beach hazard is applicable to beach shorelines. It is defined as the extent of the wave<br />
uprush plus a dynamic beach allowance of 30 metres to accommodate dynamic beach processes.<br />
On beaches that may be experiencing a gradual recession, an appropriate erosion allowance must<br />
be included. The dynamic beach allowance is designated as a line 60 metres behind the 1:100<br />
year instantaneous water level. The sixty metre allowance includes a fifteen metre wave uprush<br />
allowance, fifteen metre erosion allowance and thirty metre dynamic beach allowance.<br />
The locations of the erosion, flood and dynamic beach hazards are presented on Figures 15-17.<br />
This section provides a brief discussion of the outlined limits relative to the technical guidelines.<br />
The use of 0.15 m/year recession rate on a watershed basis rather than the default value of 0.3 m<br />
may be open to discussion. The technical guidelines could be interpreted as allowing site<br />
specific erosion results only to replace the default value. However, the recommended value of<br />
0.15 m/yr is considered to present a realistic and conservative erosion rate within a planning<br />
horizon.<br />
The use of 15 metre wave uprush allowance is also considered realistic and conservative. Much<br />
of the shoreline contains some form of erosion protection works at the upper limit of the beach or<br />
March 2008 91 <strong>Fort</strong> <strong>Erie</strong> <strong>Creeks</strong> <strong>Watershed</strong> <strong>Plan</strong><br />
General Report (105116)
ackshore. In most area, the structures also represent the location of the design high water level<br />
(1:100 year instantaneous). Thus the run up during a design storm occurs on the structure and on<br />
lands above the structures. These lands above the structures tend to be highly landscaped. Thus<br />
their run up properties, such as slope, surface texture and porosity, vary considerably.<br />
Representing wave uprush by a typical section is not appropriate in such cases. The use of a<br />
15 m horizontal allowance, as outlined in the technical guidelines, is more appropriate.<br />
There are three locations where potential for backshore flooding has been identified. These are<br />
located in reach 9-2, 10-4 and 10-7. The potential for flooding to reach the outlined level will<br />
depend on the duration of the flood. The design flood level is reached only as a result of a<br />
substantial set up, which is short in duration. High set up levels generally lasts for several hours<br />
only. It is likely that the two smaller backshore flood areas in reaches 10-4 and 10-7 will flood.<br />
However, the large inland area in reach 9-2 may not. The potential flood area extends over 1<br />
kilometre inland and is as much as 1 kilometre wide. An assessment of flood water inflow has<br />
not been completed, as it is beyond the scope of the watershed plan. Subsequent study would<br />
need to consider overland flow calculations through a relatively narrow opening behind the<br />
beach and then calculate flows spreading over a large, relatively flat area. The study would also<br />
need to consider the dynamic inflow head which would rise and fall over several hours.<br />
The outlined dynamic beach hazards have two aspects to discuss: first, it could be argued that the<br />
entire shoreline in the study area is a dynamic beach. This includes the headlands. It has been<br />
observed that there are sufficient sand or gravel deposits at all sites visited to meet the basic<br />
definition of a dynamic beach provided in the technical guidelines, with respect to thickness and<br />
extent of the sand or gravel cover. This would be considered extreme and unrealistic definition<br />
of a dynamic beach. What is more critical in defining dynamic beach is the ability of the<br />
nearshore profile to respond to water level changes and wave conditions. The headlands and<br />
other areas where bedrock is exposed do not respond to these conditions and should not be<br />
classified as dynamic beaches. The second aspect of the dynamic beach designation is that the<br />
present use and conditions of the shore in the designated areas eliminates much of the dynamic<br />
processes and raises a question about the appropriateness of the application of the Dynamic<br />
Beach hazard at all. The toe of the sand dunes is mostly protected and therefore fixed in<br />
position by presence of seawalls and revetment. The surfaces of the dunes above the<br />
seawalls/revetment are generally landscaped, thus inhibiting any movement of sand. These<br />
result in a static system, are not able to respond to coastal processes. Therefore, designating this<br />
as a dynamic system may be viewed inappropriate. This second view may also be considered<br />
somewhat extreme.<br />
A more appropriate definition of a dynamic beach hazard that recognizes the long time<br />
residential and recreational uses in the area and the real risks associated with these uses is<br />
needed. It is recommended that three dynamic beach areas identified on the figures in<br />
Appendix ‘WC-B’ should be designated as dynamic beaches. However, a consideration should<br />
be given to limiting the extent of dynamic beach hazard to the location of the shore protection<br />
structure, since this is where dynamic processes stop.<br />
March 2008 92 <strong>Fort</strong> <strong>Erie</strong> <strong>Creeks</strong> <strong>Watershed</strong> <strong>Plan</strong><br />
General Report (105116)
Importance:<br />
2.10 Land Use<br />
The Town of <strong>Fort</strong> <strong>Erie</strong> Official <strong>Plan</strong> documents approved future land uses. It has been<br />
thoroughly reviewed by the Region, Province, and NPCA, and has been verified in the context of<br />
ongoing planning initiatives, as well as potential recent impacts of the Greenbelt legislation and<br />
other relevant Provincial Policy and initiatives. While the study area is not within the Greenbelt,<br />
there is a recognized indirect impact to lands beyond the Greenbelt when development<br />
potentially increases on the lands adjacent to the Greenbelt.<br />
2.10.1 Background Information Collection<br />
• (Old) Official <strong>Plan</strong>, Town of <strong>Fort</strong> <strong>Erie</strong>, October 1995<br />
• Official <strong>Plan</strong>, Town of <strong>Fort</strong> <strong>Erie</strong>, September 11, 2006<br />
• Revised Town of <strong>Fort</strong> <strong>Erie</strong> Urban Land Needs Assessment, Town of <strong>Fort</strong> <strong>Erie</strong>,<br />
Community <strong>Plan</strong>ning and Development Services, September 2005<br />
• City of Port Colborne and City of <strong>Niagara</strong> Falls Official <strong>Plan</strong> Land Use schedules<br />
• Regional Municipality of <strong>Niagara</strong> Official <strong>Plan</strong> Land Use schedule<br />
2.10.2 Work Activities<br />
The Official <strong>Plan</strong> land uses have been mapped and layers created for comparison of existing and<br />
future imperviousness coverage, to be used as input to the study area hydrologic models.<br />
2.10.3 Findings /Constraint Identification<br />
Based on the analysis prepared by the Town in the Revised Urban Land Needs Assessment, the<br />
Town will have a surplus of urban land available for residential purposes within the 20-year time<br />
frame of the Official <strong>Plan</strong>. The Town’s assessment determined that there is sufficient<br />
developable residential land available to support the next 32 years of the residential growth<br />
requirements.<br />
The assessment concludes that there is no basis or justification to consider an Urban Boundary<br />
Expansion. The Official <strong>Plan</strong> land use plan (September 11, 2006), which is largely the same as<br />
the Land Use Schedule in Appendix 1 of the Urban Land Needs Assessment (2005), has been<br />
adopted as the future land use plan for the purpose of this study.<br />
March 2008 93 <strong>Fort</strong> <strong>Erie</strong> <strong>Creeks</strong> <strong>Watershed</strong> <strong>Plan</strong><br />
General Report (105116)
3. SUMMARY OF POLICIES, OBJECTIVES AND TARGETS<br />
Policies (Acts, Regulations, Policies, Guidelines, <strong>Plan</strong>s, Programs…) are the governing<br />
documents (legislative or otherwise) that are followed and used to guide practitioners in<br />
watershed planning. The Objectives are similar to goals, and are the overall end products that<br />
are proposed to be achieved, while following the governing policies. The targets are specifically<br />
defined to measure how well the objectives are being met.<br />
In order to effectively evaluate various alternatives and management approaches, it is necessary<br />
to clearly articulate the governing policies on a Federal, Provincial and Municipal scale.<br />
These have been summarized along with other local companion programs, to set Objectives and<br />
Targets, from such sources as: the <strong>Niagara</strong> River Remedial Action <strong>Plan</strong> (RAP), the <strong>Niagara</strong><br />
Water Quality Protection Strategy (NWQPS), Lake <strong>Erie</strong> Lakewide Management <strong>Plan</strong> (LaMP),<br />
and Lake <strong>Erie</strong> Shoreline Management <strong>Plan</strong>. Clearly the watershed strategies developed as part<br />
of this plan need to be consistent with governing policy, hence all parties need to clearly<br />
understand the current requirements.<br />
Policies, objectives and targets will evolve from the stakeholders’ vision of their watershed and<br />
its health and services compared to the current condition and issues. It is suggested to develop<br />
both short term and long-term targets to help build momentum to long-term goals through<br />
shorter-term success.<br />
The following table summarizes the various governing legislation, policy and guidelines relevant<br />
to the study:<br />
TABLE 3.1.1:<br />
SUMMARY OF ACTS AND GUIDELINES<br />
Level of<br />
Name of Management Tool: Type of<br />
Government Act/Regulation/Policy/Guideline/Program Tool<br />
Purpose<br />
Federal Agricultural and Rural Development Act Act The Act provides for federal/provincial agreements (Section<br />
3(b)(I)) to develop and conserve water supplies for agricultural<br />
and other rural development purposes.<br />
Canada Marine Act Act The Canada Marine Act’s objective is to implement National<br />
Marine Policy, to attend to matters related to maritime trade and<br />
transport, to establish Port Authorities and to divest the federal<br />
government certain harbours and ports, to provide a high level of<br />
safety and environmental protection, to ensure that services are<br />
available at a reasonable cost, and to respond to local development<br />
priorities.<br />
Canada Shipping Act Act The Canada Shipping Act (Part XV), administered by Transport<br />
Canada, provides for the Governor in Council to make regulations<br />
with respect to prohibiting the discharge from ships of pollutants<br />
and prescribing substances and classes of substances that are<br />
pollutants.<br />
Canada Water Act Act An Act to provide for the management of the water resources of<br />
Canada, including research and the planning and implementation<br />
of programs relating to the conservation, development and<br />
utilization of water resources<br />
Canadian Environmental Assessment Act Act The Act requires federal departments, including Environment<br />
Canada, agencies, and crown corporations to conduct<br />
environmental assessments for proposed projects where the federal<br />
government is the proponent<br />
Canadian Environmental Protection Act<br />
(CEPA)(1999)<br />
Act<br />
To protect the environment, human life and health from the risks<br />
associated with toxic substances.<br />
March 2008 94 <strong>Fort</strong> <strong>Erie</strong> <strong>Creeks</strong> <strong>Watershed</strong> <strong>Plan</strong><br />
General Report (105116)
TABLE 3.1.1:<br />
SUMMARY OF ACTS AND GUIDELINES<br />
Level of<br />
Name of Management Tool: Type of<br />
Government Act/Regulation/Policy/Guideline/Program Tool<br />
Purpose<br />
Federal Department of the Environment Act Act Establishes the department of the Environment and sets forth the<br />
various powers and responsibilities of the minister.<br />
Federal Fisheries Act (I) Act Purpose is to protect fish habitat. The Act deals with the discharge<br />
of deleterious substances into waters used by fish, and any harmful<br />
alteration and disruption of fish habitat.<br />
Food and Drug Act Act This Act applies to all food, drugs, cosmetics and medical devices<br />
sold in Canada, whether manufactured in Canada or imported.<br />
Migratory Birds Convention Act (1994)(I) Act Protects migratory birds from indiscriminate harvesting; affects<br />
timing of construction or habitat clearing.<br />
Species at Risk Act Act Protection of species at risk.<br />
Pest Control Products Act Act An Act to regulate products used for the control of pests and the<br />
organic functions of plants and animals.<br />
National Round Table on the Environment and<br />
the Economy Act<br />
Act An Act to establish the National Round Table on the Environment<br />
and the Economy.<br />
Provincial<br />
Pesticide Residue Compensation Act Act An Act to provide compensation to farmers whose agricultural<br />
products are contaminated by pesticide residue.<br />
Species at Risk Act Protects wildlife species at risk, including species-specific<br />
recovery plans.<br />
Canada/Ontario Agreement Respecting Great<br />
Lakes Basin Ecosystems.<br />
Canadian Water Quality Guidelines for the<br />
Protection of Aquatic Life<br />
Canadian Water Quality Guidelines for the<br />
Protection of Agricultural Water Uses<br />
Guidelines for Canadian Drinking Water<br />
Quality<br />
Guidelines for Canadian Recreational Water<br />
ISO 1400/EMS<br />
A Framework for Guiding Habitat<br />
Rehabilitation in Great Lakes Areas of<br />
Concern (2004, EC/CWS, OMNR, OME) (D)<br />
Guideline Since 1971, Canada-Ontario Agreements Respecting the Great<br />
Lakes Basin Ecosystem have guided the Parties in their work to<br />
improve the environmental quality of the Basin.<br />
Guideline The Canadian Water Quality Guidelines consist of a set of<br />
recommended “safe limits” for various polluting substances in raw<br />
(untreated) drinking water, recreational water, water used for<br />
agricultural and industrial purposes, and water supporting aquatic<br />
life. They are designed to protect and enhance the quality of water<br />
in Canada. The guidelines apply only to inland surface waters and<br />
ground waters and not to estuarine and marine waters.<br />
Guideline To provide a national guideline for the protection of drinking<br />
water.<br />
Guideline To provide a national guideline for the protection of recreational<br />
waters used for primary contact recreation such as swimming,<br />
windsurfing and water skiing and for secondary contact recreation<br />
activities including boating and fishing.<br />
Guideline ISO is a non-governmental organization established in 1947. The<br />
mission of ISO is to promote the development of standardization<br />
and related activities in the world with a view to facilitating the<br />
international exchange of goods and services, and to developing<br />
co-operation in the spheres of intellectual, scientific, technological<br />
and economic activity.<br />
Guidelines <strong>Watershed</strong>-based suggested guidelines for rehabilitation of forest,<br />
wetlands, riparian habitat. Intended de-listing of Areas of<br />
Concern.<br />
Cleanup Fund Program Initiated in 1990 as part of the federal Great Lakes Action <strong>Plan</strong>,<br />
the Cleanup Fund represents a significant part of Canada’s<br />
commitment to restore the Great Lakes Basin Ecosystem as<br />
outlined in the 1987 Protocol to the Great Lakes Water Quality<br />
Agreement between Canada and the United States (GLWQA).<br />
Bill 127, Ontario Water Resources Amendment<br />
Act (Water Source Protection), 2002<br />
Act<br />
The Bill amends the Ontario Water Resources Act in regard to the<br />
availability and conservation of Ontario water resources.<br />
Specifically, the Bill requires the Director to consider the Ministry<br />
of Environment’s statement of environmental values when making<br />
any decision under the Act. The Bill also requires that<br />
municipalities and conservation authorities are notified of<br />
applications to take water that, if granted, may affect their water<br />
sources or supplies.<br />
March 2008 95 <strong>Fort</strong> <strong>Erie</strong> <strong>Creeks</strong> <strong>Watershed</strong> <strong>Plan</strong><br />
General Report (105116)
TABLE 3.1.1:<br />
SUMMARY OF ACTS AND GUIDELINES<br />
Level of<br />
Name of Management Tool: Type of<br />
Government Act/Regulation/Policy/Guideline/Program Tool<br />
Purpose<br />
Provincial Clean Water Act (2006) Act To protect the quantity and quality of water in aquifers, rivers and<br />
lakes, through development of collaborative locally-driven,<br />
science-based protection plans.<br />
Drainage Act Act Provides for the regulation of drainage practices in Ontario.<br />
Endangered Species Act (1990) Act Provides for the conservation, protection, restoration and<br />
propagation of species of flora and fauna in Ontario that are<br />
threatened with extinction.<br />
Environmental Assessment Act (199) Act The purpose of this Act is to provide for the protection,<br />
conservation and wise management of the environment.<br />
Environmental Protection Act Act The purpose of this Act is to provide for the protection and<br />
conservation of the natural environment. R.S.O. 1990, c. E.19, s.3.<br />
Farming and Food Protection Act (1998) Act The Act is intended to ensure that farmers can carry out normal<br />
farm practices without fear of nuisance complaints or<br />
unnecessarily restrictive by-laws.<br />
Fish and Wildlife <strong>Conservation</strong> Act (1997) Act The new Fish and Wildlife <strong>Conservation</strong> Act came into force as of<br />
January 1, 1999. The Act enables the Ministry of Natural<br />
Resources (MNR) to provide sound management of the province’s<br />
fish and wildlife well into the next century. It replaces the Game<br />
and Fish Act, that last underwent major changes in 1980.<br />
Lakes and Rivers Improvement Act (1990) Act The Lakes and Rivers Improvement Act gives the Ministry of<br />
Natural Resources the mandate to manage water-related activities,<br />
particularly in the areas outside the jurisdiction of <strong>Conservation</strong><br />
Authorities.<br />
Municipal Act Act The Municipal Act sets forth regulations in regard to the<br />
structuring of municipalities in Ontario.<br />
<strong>Niagara</strong> Parks Commission (MOT) Act The <strong>Niagara</strong> Parks Act enables the <strong>Niagara</strong> Parks Commission to<br />
regulate the use of the parks, providing for protection and<br />
preservation of the Property of the Commissioner.<br />
Nutrient Management Act (OMAF) (2002) Act As part of the Ontario government’s Clean Water Strategy, the<br />
Nutrient Management Act provides for province-wide standards to<br />
address the effects of agricultural practices on the environment,<br />
especially as they relate to land-applied materials containing<br />
nutrients.<br />
Ontario Water Resources Act Act The Ontario Water Resource Act deals with the powers and<br />
obligations of the Ontario Clean Water Agency, as well as an<br />
assigned provincial officer, who monitors and investigates any<br />
potential problems with regards to water quality or supply. There<br />
are also extensive sections on Wells, Water Works, and Sewage<br />
works involving their operation, creation and other aspects.<br />
Pesticides Act Act The Ontario Pesticides Act establishes a classification system for<br />
pesticides and regulates the licensing of vendors and persons<br />
employed as applicators of pesticides, the storage and disposal of<br />
pesticides, and the requirements for notification of pesticide use.<br />
Places to Grow Act (2005) Act To enable decisions about growth to be made in ways that sustain<br />
a robust economy, strong communities, healthy environment and a<br />
culture of conservation.<br />
Provincial <strong>Plan</strong>ning Act (D) Act The purposes of this Act is to promote sustainable economic<br />
development in a healthy natural environment<br />
Public Lands Act<br />
Act<br />
Safe Drinking Water Act (MOE) (2002) Act As recommended by Commissioner O’Connor, the government<br />
has passed a Safe Drinking Water Act, which expands on existing<br />
policy and practice and introduces new features to protect drinking<br />
water in Ontario. Its purpose is the protection of human health<br />
through the control and regulation of drinking-water systems and<br />
drinking-water testing and provides legislative authority to<br />
implement 50 of the 93 recommendations made in Commissioner<br />
O’Connor’s Part Two Report.<br />
Environmental Bill of Rights (EBR)<br />
Bill of<br />
Rights<br />
On February 15, 1994, the Environmental Bill of Rights (EBR)<br />
took effect and the people of Ontario received an important new<br />
tool to help them protect and restore the natural environment.<br />
While the Government of Ontario retains the primary<br />
responsibility for environmental protection, the EBR provides<br />
every resident with formal rights to play a more effective role.<br />
March 2008 96 <strong>Fort</strong> <strong>Erie</strong> <strong>Creeks</strong> <strong>Watershed</strong> <strong>Plan</strong><br />
General Report (105116)
TABLE 3.1.1:<br />
SUMMARY OF ACTS AND GUIDELINES<br />
Level of<br />
Name of Management Tool: Type of<br />
Government Act/Regulation/Policy/Guideline/Program Tool<br />
Purpose<br />
Provincial Model NMP By-law By-Law Model By-law to Incorporate the Nutrient Management <strong>Plan</strong><br />
(NMP) Requirements into a Municipal By-law Pursuant to the<br />
Municipal Act (July 23, 1999).<br />
Fish Habitat Types with Management Guideline The report is designed to provide fisheries habitat and<br />
Rationale – <strong>Niagara</strong> Regional Municipality<br />
(MNR) (2000)<br />
management information for assisting with resource management<br />
decisions.<br />
Guidelines for Evaluating Construction<br />
Activities Impacting on Water Resources<br />
(MOE) (1995)<br />
Guideline These guidelines were developed to protect the receiving<br />
environment according to the physical, the chemical and the<br />
biological quality of the material being dredged.<br />
Guidelines for Use at Contaminated Sites in Guideline The purpose is to provide a guideline for use by property owners<br />
Ontario (MOE) (1997)<br />
who are cleaning up or redeveloping a contaminated site.<br />
Guidelines for the Utilization of Biosolids and Guideline Purpose is to provide guidelines on the application of biosolids on<br />
Other Wastes on Agricultural Land<br />
agricultural land.<br />
(MOE/OMAFRA) 1996<br />
Incorporation of the Reasonable Use concept Guideline This guideline establishes the basis for the reasonable use of<br />
into MOE Groundwater Management<br />
groundwater on property adjacent to sources of contaminants and<br />
Activities (1994)<br />
for determining the levels of contaminants acceptable to the<br />
ministry.<br />
Ontario Drinking Water Standards (MOE)<br />
(2001)<br />
Guideline The purpose of the standards is to protect public health through the<br />
provision of safe drinking water.<br />
Provincial Water Quality Objectives (MOE) Guideline To provide objectives for the protection of aquatic life.<br />
(1994)<br />
Significant Wildlife Habitat Technical Guide Guideline Significant Wildlife Habitat has been identified as one of the<br />
(MNR) (2000)<br />
natural heritage feature areas under the Provincial Policy<br />
Statement<br />
Protection and Management of Aquatic<br />
Sediment Quality in Ontario (MOE) (1993)<br />
Guideline The purpose of the sediment quality guideline is to protect the<br />
aquatic environment by setting safe levels for metals, nutrients and<br />
organic compounds.<br />
Guideline Guidance manual for the development of private wells.<br />
Technical Guideline for Private Wells: Water<br />
Supply Assessment (MOE) (1996)<br />
Technical Guideline for On-site Sewage Guideline Guidance manual for assessing the proposed impacts on on-site<br />
Systems (MOE)<br />
sewage systems on groundwater.<br />
Integrating Water Management Objectives into Policy Policy manual on the integration of watershed management<br />
Municipal <strong>Plan</strong>ning Documents (MOE) (1993)<br />
practices into municipal planning documents.<br />
Subwatershed <strong>Plan</strong>ning (MOE) (1993) Policy Technical manual on conducting subwatershed planning in<br />
Ontario.<br />
<strong>Watershed</strong> Management on a <strong>Watershed</strong> Basis Policy Policy manual on watershed management practices.<br />
(MOE) (1993)<br />
Provincial Policy Statement Policy Provincial Policy Statement was issued under Section 3 of the<br />
<strong>Plan</strong>ning Act and came into effect in 2005.<br />
Ontario Drinking Water Protection Regulation Regulation In August 2000, the Government of Ontario announced a new<br />
Drinking Water Protection Regulation (Ontario Regulation<br />
459/00) to ensure the safety of Ontario’s drinking water. The<br />
regulation issued under the Ontario Water Resources Act was a<br />
part of the comprehensive Operation Clean Water action plan. This<br />
regulation put the Ontario Drinking Water Standards into law,<br />
updating and strengthening the Ontario Drinking Water<br />
Objectives.<br />
Ontario’s New Drinking Water Protection<br />
Regulation for Smaller Waterworks Serving<br />
Designated Facilities O. Reg. 505/01<br />
Regulation The Regulation is Part of the New Drinking Water Regulations<br />
administered through the Ministry of the Environment.<br />
Regional Regional Municipalities Act (1990) Act Purpose is to put forth the structuring and governance of<br />
municipalities in support of the Municipal Act.<br />
Regional Municipality of <strong>Niagara</strong> Act (1990) Act Purpose is to put forth the structuring and governance of<br />
municipalities in support of the Regional Municipalities Act and<br />
the Municipal Act.<br />
Regional Municipality of <strong>Niagara</strong> Model Site<br />
Alteration By-law<br />
By-Law<br />
To assist in the protection of sensitive lands and agricultural areas<br />
(can be adopted by the local municipalities under the Municipal<br />
Act).<br />
March 2008 97 <strong>Fort</strong> <strong>Erie</strong> <strong>Creeks</strong> <strong>Watershed</strong> <strong>Plan</strong><br />
General Report (105116)
Level of<br />
Government<br />
Regional<br />
Level of Government<br />
Regional Municipality of <strong>Niagara</strong> Tree Cutting<br />
By-Law<br />
TABLE 3.1.1:<br />
SUMMARY OF ACTS AND GUIDELINES<br />
Level of<br />
Government<br />
Level of Government<br />
By-Law The Tree <strong>Conservation</strong> By-Law is designed to support and<br />
encourage good forestry management and weed out those in the<br />
industry responsible for poor logging practices. The By-Law<br />
regulates tree cutting in woodlots. It does not prohibit it.<br />
Landowners are free to cut trees in their woodlots provided that<br />
they do not violate good forestry practice.<br />
Regional Municipality of <strong>Niagara</strong> EIS<br />
Guidelines (2001)<br />
Guideline Guidelines for the conduct of EIS projects in the Region. To<br />
standardize and put forward the requirements for EIS completion<br />
and review.<br />
Regional Municipality of <strong>Niagara</strong> Policy <strong>Plan</strong><br />
(2005)<br />
Municipal Town of <strong>Fort</strong> <strong>Erie</strong> Site Alteration By-law 201-<br />
96<br />
Municipal EIS Guidelines (D)<br />
<strong>Conservation</strong><br />
Authority<br />
Binational<br />
Canada/USA<br />
Policy The Regional <strong>Plan</strong>, therefore, is essentially a means of guiding<br />
short range public and private actions on a region wide scale<br />
according to long range considerations of the public interest, and is<br />
intended to assist in the creation of conditions within which the<br />
private market and public authorities can function most<br />
effectively.<br />
By-Law To protect lands from unauthorized alteration, which may damage<br />
the existing and future land and environment.<br />
Guideline Purpose is to set forth guidelines for conducting Environmental<br />
Impact Statements as part of the review of social, economic and<br />
environmental impacts of proposed projects in order to protect<br />
natural heritage features.<br />
Municipal Official <strong>Plan</strong>s (D) Policy Municipal planning strategies, and associated land use bylaws, are<br />
the primary tools used by municipalities for land use planning. As<br />
a statement of Council’s policies and priorities, a strategy<br />
establishes a framework for addressing how a community will<br />
respond to opportunities and challenges for orderly growth and<br />
development. And while opinions on municipal planning strategies<br />
are many and varied, most would agree they are necessary.<br />
<strong>Conservation</strong> Authorities Act Act <strong>Conservation</strong> Authorities, created in 1946 by an Act of the<br />
Provincial Legislature, are mandated to ensure the conservation,<br />
restoration and responsible management of Ontario’s water, land<br />
and natural habitats through programs that balance human,<br />
environmental and economic needs.<br />
Land Use Policies for Valleylands, Stream<br />
Corridors and Floodplains (NPCA) (2002)<br />
Shoreline Management Program - <strong>Plan</strong> Input<br />
and Review Guidelines (NPCA) (1988)<br />
Regulation of Development, Interference with<br />
Wetlands and Alterations to Shorelines and<br />
Watercourses – Ont. Reg 155/06 (NPCA)<br />
(2006)<br />
Policy Purpose is to identify valleys and/or valley systems and stream<br />
corridors, to further its objectives relating to flooding and erosion,<br />
and the maintenance of natural environmental integrity, including<br />
the conservation of land.<br />
Program Purpose is to set forth a management program for addressing<br />
erosion problems along shorelines in the <strong>Niagara</strong> <strong>Conservation</strong><br />
Authority lands.<br />
Regulation Generic Regulation allows the NPCA to prohibit or regulate<br />
development in or adjacent to Shorelines, wetlands, floodplains,<br />
watercourses, valleys, dynamic beaches and hazard lands.<br />
Lake <strong>Erie</strong> Lakewide Management <strong>Plan</strong> (LaMP) <strong>Plan</strong> Initiated in 2000, the plan is revisited every two years. A review<br />
of the “Significant Ongoing and Emerging Issues” has been<br />
completed, and there are no specific policies to deal with the<br />
shoreline in the <strong>Fort</strong> <strong>Erie</strong> area, however there are general<br />
ecosystem objectives and indicators.<br />
<strong>Niagara</strong> River Toxics Management <strong>Plan</strong> <strong>Plan</strong> Reports on the status of 18 NRTMP “priority pollutants”<br />
3.1 Policy<br />
The Town of <strong>Fort</strong> <strong>Erie</strong>, <strong>Niagara</strong> <strong>Peninsula</strong> <strong>Conservation</strong> Authority (NPCA), Ministry of Natural<br />
Resources, Department of Fisheries and Oceans, Ministry of the Environment, and <strong>Niagara</strong> Parks<br />
Commission, each have criteria and guidelines pertaining to management of watershed<br />
resources.<br />
March 2008 98 <strong>Fort</strong> <strong>Erie</strong> <strong>Creeks</strong> <strong>Watershed</strong> <strong>Plan</strong><br />
General Report (105116)
The Provincial Policy Statement (2005) includes policies that allow the agencies to “protect,<br />
improve or restore the quality and quantity of water by using the watershed as an ecologically<br />
meaningful scale for land use planning”<br />
The following outlines the basic policy of each agency as it applies to the various watershed<br />
disciplines considered by this study:<br />
3.1.1 Hydrogeology<br />
The NPCA legislative mandate as set out in Section 20 of the <strong>Conservation</strong> Authorities Act is to<br />
establish and undertake programs designed to further the conservation, restoration, development<br />
and management of natural resources. However, the primary water management focus has<br />
generally been surface water management and flooding prevention.<br />
The Provincial Policy Statement (2005) issued under the authority of the <strong>Plan</strong>ning Act directs<br />
conservation authorities to in future place greater emphasis on groundwater resource<br />
management. It indicates that “<strong>Plan</strong>ning authorities shall protect, improve or restore the quality<br />
and quantity of water by:…identifying…groundwater features …protect, improve or restore<br />
vulnerable…groundwater…and sensitive groundwater features …” In this regard, protection of<br />
natural recharge and discharge features are extremely important.<br />
The Ministry of Natural Resources has responsibilities under the Federal Fisheries Act and the<br />
Federal Fish Habitat Management Policy. The Federal Fisheries Act requires that stream flows<br />
be maintained at levels that will not affect fish habitat while the Federal Fish Management Policy<br />
requires no net loss of fish habitat. As such, any development that has the potential to alter<br />
groundwater and surface water relationships (i.e. baseflow and water quality) in a manner that<br />
impacts fish habitat would require the preparation of plans designed to mitigate these effects. In<br />
the case of baseflow maintenance, due to the inter-relationship between groundwater and surface<br />
water, at-source infiltration is generally encouraged provided the water is of suitable quality.<br />
The Ministry of the Environment provides protection and conservation of the natural<br />
environment (including groundwater) through various statues and regulations, most notably the<br />
Ontario Water Resources Act, the Environmental Assessment Act and the Environmental<br />
Protection Act (EPA). In particular, these Acts and associated Regulations, Policies and<br />
Guidelines provide for protection of impacts to groundwater quality by both regulated<br />
(i.e. landfills, septic systems) and unregulated (i.e. spills) contaminant sources. In addition<br />
impacts to groundwater quantity are regulated, primarily through the Permit to Take Water<br />
program (Reg. 387/04). The Town of <strong>Fort</strong> <strong>Erie</strong> are however responsible for approvals of single<br />
lot septic systems receiving less than 10,000 L/day (under EPA transfer of responsibilities to the<br />
Building Code Act).<br />
Under the Health Protection and Promotion Act, the Ministry of Health, Public Health Branch<br />
has “Safe Water” as one of its “Mandatory Health Programs and Services Guidelines”<br />
(December 1997). The stated goal is “To reduce the incidence of water-borne illness in the<br />
population”. The mandate of the Public Health Laboratory is to provide free microbiological<br />
analyses and interpretation of the results.<br />
March 2008 99 <strong>Fort</strong> <strong>Erie</strong> <strong>Creeks</strong> <strong>Watershed</strong> <strong>Plan</strong><br />
General Report (105116)
The Clean Water Protection Act 2006 was passed to secure primarily municipal drinking water<br />
supplies at the source of the water and is commonly referred to as Source Water Protection. The<br />
existing guidelines and technical supporting documents are in a draft stage but technical studies<br />
have begun. Within the <strong>Fort</strong> <strong>Erie</strong> <strong>Creeks</strong> <strong>Watershed</strong> <strong>Plan</strong> Area these studies currently include<br />
the (i) Tier 1 Water Budget and the (ii) Intake Protection Zone study for the Rosehill municipal<br />
surface water treatment plant. With respect to groundwater the Tier 1 Water Budget will be<br />
delineating high volume and significant recharge areas and evaluating the stress state of water<br />
resources in the WSPA (due for completion by end of 2008). Also to be completed in 2008 will<br />
be a preliminary Groundwater Vulnerability Study of highly vulnerable groundwater areas.<br />
3.1.2 Flooding and Erosion<br />
The NPCA mandate under the <strong>Conservation</strong> Authorities Act permits the Authority to regulate<br />
designated areas based on flood potential (risk), erosion, hazard potential and resource<br />
protection. The intent of the regulation is to reduce risk to life and property damage by assessing<br />
the technical feasibility of proposals based on examination of hydrologic and hydraulic effects.<br />
The Authority also administers the Provincial Floodplain Policy issued under Section 3 of the<br />
<strong>Plan</strong>ning Act. This responsibility is delegated to the <strong>Conservation</strong> Authority from the Ministry<br />
of Natural Resources.<br />
Under the new Generic Regulations (May 2006) the NPCA may prohibit or regulate<br />
development in the following areas:<br />
(a) adjacent or close to the shoreline of the Great Lakes-St. Lawrence River System or to inland<br />
lakes that may be affected by flooding, erosion or dynamic beaches, including the area from the<br />
furthest offshore extent of the Authority’s boundary to the furthest landward extent of the<br />
aggregate of the following distances:<br />
(i)<br />
(ii)<br />
(iii)<br />
(iv)<br />
(v)<br />
the 100 year flood level, plus the appropriate allowance for wave uprush shown<br />
in the column headed “100 Year Flood Limit” found in Table 3 of the document<br />
entitled “Lake Ontario Shoreline Management <strong>Plan</strong>”, January 1994<br />
the 100 year flood level, plus the appropriate allowance for wave uprush shown<br />
in the column headed “100 Year Flood Limit” found in Section 3.2 of the<br />
document entitled “Lake <strong>Erie</strong> Shoreline Management <strong>Plan</strong>”, June 1992<br />
the predicted long term stable slope projected from the existing stable toe of the<br />
slope or from the predicted location of the toe of the slope as that location may<br />
have shifted as a result of shoreline erosion over a 100-year period,<br />
where a dynamic beach is associated with the waterfront lands, the appropriate<br />
allowance inland to accommodate dynamic beach movement shown in Section 4.4<br />
of the document entitled “Lake Ontario Shoreline Management <strong>Plan</strong>”, January<br />
1994, and<br />
where a dynamic beach is associated with the waterfront lands, the appropriate<br />
allowance inland to accommodate dynamic beach movement shown in Section<br />
3.8.2 iii) of the document entitled “Lake <strong>Erie</strong> Shoreline Management <strong>Plan</strong>”, June<br />
1992;<br />
March 2008 100 <strong>Fort</strong> <strong>Erie</strong> <strong>Creeks</strong> <strong>Watershed</strong> <strong>Plan</strong><br />
General Report (105116)
(b) River or stream valleys that have depressional features associated with a river or stream,<br />
whether or not they contain a watercourse, the limits of which are determined in accordance<br />
with the following rules:<br />
(i)<br />
(ii)<br />
(iii)<br />
where the river or stream valley is apparent and has stable slopes, the valley<br />
extends from the stable top of bank, plus 15 metres, to a similar point on the<br />
opposite side,<br />
where the river or stream valley is apparent and has unstable slopes, the valley<br />
extends from the predicted long term stable slope projected from the existing<br />
stable slope or, if the toe of the slope is unstable, from the predicted location of<br />
the toe of the slope as a result of stream erosion over a projected 100-year period,<br />
plus 15 metres, to a similar point on the opposite side,<br />
where the river or stream valley is not apparent, the valley extends the greater of,<br />
(A) the distance from a point outside the edge of the maximum extent of<br />
the flood plain under the applicable flood event standard, to a similar<br />
point on the opposite side, and<br />
(B) the distance of a predicted meander belt of a watercourse, expanded<br />
as required to convey the flood flows under the applicable flood<br />
standard, to a similar point on the opposite side;<br />
(c) hazardous lands;<br />
(d) wetlands; or<br />
(e) other areas where development could interfere with the hydrologic function of a wetland,<br />
including areas up to 120 metres of all provincially significant wetlands and wetlands greater<br />
than 2 hectares in size, and areas within 30 metres of wetlands less than 2 hectares in size, but<br />
not including those where development has been approved pursuant to an application made<br />
under the <strong>Plan</strong>ning Act or other public planning or regulatory process.<br />
The Black Creek, Beaver Creek, Baker Creek, Frenchman’s Creek, Miller Creek, Six Mile Creek<br />
and Kraft Drain are regulated based on the flood produced by the Regional Storm (100 year).<br />
The study area is regulated by a "one zone" policy, with no development allowed within the<br />
regulated area.<br />
The Town of <strong>Fort</strong> <strong>Erie</strong>’s storm drainage policies have been defined in a report: “Town of <strong>Fort</strong><br />
<strong>Erie</strong>, Storm Drainage Master <strong>Plan</strong>”, by Kerry T. Howe Engineering Ltd. April, 1993. The AES<br />
design storms for Port Colborne have been recommended for use in the Town of <strong>Fort</strong> <strong>Erie</strong>, and<br />
accordingly the design criteria for minor and major storms has been defined.<br />
The <strong>Niagara</strong> Parks Commission has a legislated mandate for the <strong>Niagara</strong> River corridor, <strong>Niagara</strong><br />
gorge, and environmental matters within their jurisdiction. The NPC will have regard to this<br />
document however, “the use of lands owned by the NPC is regulated under the provisions of the<br />
<strong>Niagara</strong> Parks Act R.S.O. 199, cN3. The provisions of this plan shall not apply to the lands of<br />
the <strong>Niagara</strong> Parks Commission so long as those lands are owned by the <strong>Niagara</strong> Parks<br />
Commission and are used for the purposes of the <strong>Niagara</strong> Parks Commission”.<br />
March 2008 101 <strong>Fort</strong> <strong>Erie</strong> <strong>Creeks</strong> <strong>Watershed</strong> <strong>Plan</strong><br />
General Report (105116)
3.1.3 Stream Morphology<br />
It is NPCA policy to protect stream morphological and fluvial character (ref. Section 2(b)<br />
Generic Regulations, May 2006). Further, for stream corridor delineation from a planning<br />
perspective, the determination of an appropriate meander belt width is recommended.<br />
At the Provincial level, natural hazard lands are covered under Section 3 of the Provincial Policy<br />
Statement. Specific guidelines regarding stream morphology are also found in the Ministry of<br />
Natural Resources “Natural Channel Systems” and “Technical Guide, River and Stream<br />
Systems: Erosion Hazard Limit”, 2001.<br />
3.1.4 Aquatic Habitat and Fisheries<br />
The most encompassing legislation addressing aquatic habitat and fisheries is the Policy for the<br />
Protection of Fish Habitat (Department of Fisheries and Oceans; 1986), under the auspices of the<br />
Federal Fisheries Act. The policy is based on the guiding principle of "no net loss of the<br />
productive capacity of fish habitat" and "net gain" of habitat where feasible. No habitat which is<br />
required for the support of any aspect of a fishery or its productivity (feeding, nursery, spawning,<br />
migratory or general living habitat) can be destroyed, altered or otherwise deleteriously affected<br />
without permission of the Minister, subject to substantial fine and/or imprisonment penalties.<br />
Any assessment of a fishery resource and the constraints that the presence of a fishery resource<br />
has upon development activity, must frame the assessment within the federal and provincial<br />
legislation designed to protect the fishery resource and species at risk. Federal protection of all<br />
fish habitat is provided under the Fisheries Act. Federal protection for species at risk is provided<br />
under the Species At Risk Act, for species listed in Schedule 1 of the Act. Provincial protection<br />
of species at risk is provided under the <strong>Plan</strong>ning Act.<br />
The Fisheries Act defines fish as: “parts of fish, shellfish, crustaceans, marine animals and any<br />
parts of shellfish, crustaceans or marine animals, and the eggs, sperm, spawn, larvae, spat and<br />
juvenile stages of fish, shellfish, crustaceans and marine animals”.<br />
The Fisheries Act defines fish habitat as: “spawning grounds and nursery, rearing, food supply<br />
and migration areas on which fish depend directly or indirectly in order to carry out their life<br />
processes”.<br />
The Fisheries Act states “no person shall carry on any work or undertaking that results in the<br />
harmful alteration, disruption or destruction of fish habitat (Section 35(1))” unless authorized by<br />
the Minister of Fisheries and Oceans, or under regulations made by the Governor in Council<br />
under this Act (Section 35(2)). As well, “no person shall deposit or permit the deposit of any<br />
deleterious substance into water frequented by fish” (Section 36(3)). Stemming from the<br />
Fisheries Act, the Department of Fisheries and Oceans (1986) Policy for the Management of Fish<br />
Habitat has the objective of creating a net gain of habitat for Canada’s Fisheries resources. The<br />
guiding principle to realize this end is “no net loss” which requires that if the productive capacity<br />
of a fish habitat is reduced, then a compensating increase in fish production must be made to<br />
occur. The hierarchy of preferences for applying this principle to development, or other<br />
activities, is as follows:<br />
March 2008 102 <strong>Fort</strong> <strong>Erie</strong> <strong>Creeks</strong> <strong>Watershed</strong> <strong>Plan</strong><br />
General Report (105116)
1. Maintain, without disruption, the natural productive capacity of fish habitats through<br />
relocation, redesign or mitigation.<br />
2. If the former proves impossible or impractical, then compensation by either creating new<br />
habitat, or by increasing the productive capacity of existing habitat, will be considered. It<br />
should be noted, however, that compensation may not be acceptable in some cases where<br />
the habitats in question are deemed especially important or sensitive. It should also be<br />
noted that an Authorization under the Fisheries Act triggers the Canadian Environmental<br />
Assessment Act, so that screening under this Act also becomes necessary.<br />
The presence of fish species classed as “Vulnerable” elevates the fish habitat to MNR “Type 1"<br />
habitat, and triggers provincial protection of habitat under the <strong>Plan</strong>ning Act. Under Section 3 of<br />
the <strong>Plan</strong>ning Act the province requires that, in exercising any authority that affects planning<br />
matters, planning authorities "shall have regard to" policy statements issued under the Act.<br />
Under Section 2.3.1 of the Provincial Policy Statement it is stated that “Development and site<br />
alteration will not be permitted in significant portions of the habitat of endangered and threatened<br />
species”. Coldwater fish habitat is also considered “Type 1", which requires the highest degree<br />
of protection.<br />
Administration of the policy at the local level has been delegated to the NPCA through a Level II<br />
Agreement with DFO. Typically, NPCA reviews the implications of the policy in conjunction<br />
with applications under the Lakes and Rivers Improvement Act, as well as through subdivision<br />
approval, Environmental Assessment and other relevant processes. The NPCA’s responsibilities<br />
include determination of whether or not potential habitat impacts can be mitigated to an<br />
acceptable level. If it is deemed that impacts cannot be mitigated, and the proposal involves<br />
compensation, applications to the Minister of Fisheries for approval of the relevant habitat<br />
impacts must be made, in conjunction with an acceptable plan for compensation of the proposed<br />
habitat impact/loss.<br />
The Ministry of Natural Resources (Vineland Office) has classified fish habitat in all the main<br />
watercourse channels in the <strong>Niagara</strong> Region (ref. “Fish Habitat Types with Management<br />
Rationale, <strong>Niagara</strong> Regional Municipality”, MNR, February 25, 2000). The fish<br />
communities/habitat definitions in this document are as follows (ref. Appendix ‘NH-A’ for full<br />
definitions).<br />
Type 1: areas that limit the overall productive capacity (i.e. if these areas are harmfully altered<br />
the productive capacity of the area would be reduced). Sensitive fish species (part or all of their<br />
life cycle) and/or habitats are present (including springs, seeps, upwelling areas, seasonally<br />
inundated spawning habitats, refugia, nursery areas, over-wintering areas, and ephemeral pools).<br />
These areas require a high degree of protection, however may also be enhanced with care, and<br />
can achieve a high potential for habitat compensation.<br />
Type 2: this habitat is important but below its productive capacity and is ideal for enhancement<br />
or restoration projects. Sensitive species may or may not be present part or all of the time. Fish<br />
community is below potential due to habitat related issues, however may be increased if the<br />
limiting factors are reversed.<br />
March 2008 103 <strong>Fort</strong> <strong>Erie</strong> <strong>Creeks</strong> <strong>Watershed</strong> <strong>Plan</strong><br />
General Report (105116)
Type 3: areas with low productive capacity, where common species may or may not be present,<br />
and no sensitive species and/or specialized habitat are present (incidental exceptions of fish<br />
presence may occur in some locations, e.g. the Welland Shipping Canal). Areas can negatively<br />
affect downstream, down-drift or connected fish habitats, and should not be considered for<br />
compensation opportunities.<br />
This classification in intended to guide the management and treatment of watercourses, whether<br />
confronted by development, land use changes, or opportunities for enhancement.<br />
In the course of any project that has the potential to impact upon a watercourse, an appropriately<br />
detailed site-specific study will be required to address the concerns of DFO, MNR and the CA.<br />
The Department of Fisheries and Oceans has classified the legal drains within the <strong>Fort</strong> <strong>Erie</strong><br />
<strong>Creeks</strong> watershed according to their official drain typing, defined as follows (the DFO should be<br />
contacted to obtain the most current classification of specific drains in <strong>Fort</strong> <strong>Erie</strong>).<br />
Table 3.1.2<br />
DFO DRAIN CLASSIFICATION<br />
Type Flow Temperature Species<br />
A<br />
Permanent<br />
Cold/Cool/<br />
Unknown<br />
B Permanent Warm<br />
Time Since Last<br />
Clean Out<br />
Authorization<br />
No Trout Or Salmon N/A Class A<br />
Top Predators<br />
(Bass, Pike, Muskie, Crappie)<br />
Less Than 10 Years<br />
Class B<br />
C Permanent Warm Baitfish N/A Class C<br />
D<br />
Permanent<br />
Cold/Cool/<br />
Unknown<br />
E Permanent Warm<br />
Trout and/or Salmon N/A Project Specific<br />
Top Predators<br />
(Bass, Pike, Muskie, Crappie)<br />
F Intermittent N/A N/A N/A<br />
Project Specific<br />
Conditional<br />
(See Below)<br />
Class Authorization A:<br />
Authorized Activities: brushing of side slope; bottom cleanout; debris cleanout. Specific Terms<br />
and Conditions: width:depth ratio not increased; shade producing side unaltered; specific timing<br />
restrictions; sediment control; work in water only when flows are not elevated; replanting of<br />
bank vegetation.<br />
Class Authorization B:<br />
Authorized Activities: brushing of side slope; bottom cleanout; debris cleanout.<br />
Specific Terms and Conditions: specific timing restrictions; vegetation can be removed from<br />
either bank, but must be replanted; width:depth ratio can be increased, but channel must be as<br />
deep as possible; sediment control; work in water only when flows are not elevated; replanting of<br />
bank vegetation.<br />
March 2008 104 <strong>Fort</strong> <strong>Erie</strong> <strong>Creeks</strong> <strong>Watershed</strong> <strong>Plan</strong><br />
General Report (105116)
Class Authorization C:<br />
Authorized Activities: brushing of side slope; bottom cleanout; debris cleanout; full clean out.<br />
Specific Terms and Conditions: vegetation removal allowed on either bank, but must be<br />
replanted; bends in channel must be stabilized; specific timing restrictions; sediment control;<br />
work in water only when flows are not elevated.<br />
Project Specific Evaluations: D & E:<br />
Drain types D and E are sensitive to maintenance activities. This however does not necessarily<br />
mean that work cannot proceed in these drains. These projects will be evaluated on a project by<br />
project basis to determine if the effects of maintenance can be mitigated. In some cases, a project<br />
specific authorization under the Fisheries Act may be required.<br />
F Drains:<br />
F drains are intermittent systems and therefore a harmful alteration, disruption or destruction of<br />
fish habitat will not occur in these systems for cleanout work provided the following conditions<br />
are met: work is done in the dry; all disturbed soils are stabilized upon completion of work.<br />
Class Authorization Adaptability:<br />
All conditions can be adapted to suit regional biological differences as well as the needs of the<br />
drainage superintendents. Therefore a Class C authorization in Wingham could have different<br />
terms and conditions than a Class C authorization in Fonthill.<br />
MNR setback guidelines are 30 m from the top of bank for Critical Habitats, and 15 m for both<br />
Important and Marginal Habitats (Ian Barrett, Fisheries Biologist, NPCA. pers. comm.,<br />
February 28, 2006). Where no top-of-bank is delineated, some definable standard such as the<br />
waterline of a two-year return flow event is suggested (Ian Barrett, Fisheries Biologist, NPCA,<br />
pers. comm.. with Study Team, February 28, 2006).<br />
Erosion, flooding and water quality guidelines and policies noted previously also set objectives<br />
to protect fish and aquatic habitat, through water quality treatment objectives, requirements for<br />
erosion and sediment controls, and mitigation of impacts to stream morphology.<br />
3.1.5 Water Quality<br />
The MNR and the MOE have developed technical guidelines for the control of stormwater from<br />
new development (ref. Stormwater Management Practices Design Manual, MOE, March 2003).<br />
These guidelines encompass Best Management Practices for the control of water quality, erosion<br />
and hydrogeologic aspects of stormwater management. They provide direction in the<br />
preparation and review of planning documents and proposals, as well as master drainage and<br />
stormwater management plans, to ensure that stormwater quality is appropriately addressed in<br />
stormwater management system design.<br />
March 2008 105 <strong>Fort</strong> <strong>Erie</strong> <strong>Creeks</strong> <strong>Watershed</strong> <strong>Plan</strong><br />
General Report (105116)
The principles advanced in the documentation include a focus on: various stormwater quality<br />
treatment levels for various types of receiving watercourse habitats, use of at-source controls,<br />
conveyance controls, and end-of-pipe controls, management of volumes, water quality treatment<br />
performance and volume requirements.<br />
Based on the fisheries assessment of the study area of the <strong>Fort</strong> <strong>Erie</strong> <strong>Creeks</strong>, habitat protection has<br />
been advocated in accordance with type assessment of the creeks as a combination of Type 1,<br />
Type 2 and Type 3 Habitat<br />
Enhanced protection should be used where Type 1 habitat exists, or would be impacted by endof-pipe<br />
discharges. Normal protection should be used where Type 1 habitat and conditions for<br />
enhanced protection do not exist. Basic protection may only be used when the receiving aquatic<br />
habitat can be demonstrated to be insensitive to stormwater impacts and has little potential for<br />
future rehabilitation (MOE 2003).<br />
The Enhanced Habitat Protection criteria has been designed to attain suspended solids (and other<br />
pollutants) long-term average removal which exceeds 80% removal efficiency. Normal<br />
protection corresponds to end-of-pipe storage volumes required for the long-term average<br />
removal of 70% suspended solids; basic corresponds to 60%.<br />
In terms of general water quality, the Provincial government has recently increased the scope and<br />
number of legislative vehicles for the protection of water quality. The three most recent are the<br />
Clean Water Act (2006), the Safe Drinking Water Act (2002) and the Nutrient Management Act<br />
(2002). These supplement the many other tools such as the Pest Control Products Act and the<br />
Agricultural and Rural Development Act, and Guidelines for Drinking Water Quality.<br />
These and other Acts, Policies, and Guidelines are administered by all levels of Government,<br />
with the objective of protecting water quality through the prevention, elimination, or mitigation<br />
of both point-source and non-point source pollutants that enter the water cycle.<br />
<strong>Niagara</strong> Water Quality Protection Strategy<br />
The Strategy was developed to protect, restore, and manage the <strong>Niagara</strong> area’s water resources.<br />
The Region is overseeing the implementation of the strategy, together with the <strong>Niagara</strong> <strong>Peninsula</strong><br />
<strong>Conservation</strong> Authority and the Municipalities, as well as other Provincial and Federal<br />
government stakeholders, and numerous public interest groups.<br />
3.1.6 Terrestrial Natural Heritage<br />
Table 3.1.3 outlines the strategies and policies – federal, provincial, regional and local;<br />
government and non-government - most relevant to the natural heritage strategy. A recurrent<br />
theme is priority to protection of existing natural areas. Protection includes a reduction of<br />
agricultural and urban impacts. Other common themes are the importance of enhancement to<br />
increase biodiversity, the value of replication of natural functioning, and the need for awarenessraising<br />
and stewardship partnerships.<br />
March 2008 106 <strong>Fort</strong> <strong>Erie</strong> <strong>Creeks</strong> <strong>Watershed</strong> <strong>Plan</strong><br />
General Report (105116)
TABLE 3.1.3:<br />
SUMMARY OF POLICIES, STRATEGIES AND PLANS RELEVANT TO THE NATURAL HERITAGE STRATEGY<br />
Policy/Strategy Source Policy/Strategy Title Relevance<br />
Environment Canada<br />
and US Environmental<br />
Protection Agency<br />
Lake <strong>Erie</strong> Lake-wide<br />
Management <strong>Plan</strong> (LaMP)<br />
LaMP advocates a return to natural landscapes, where possible, as the best way to restore the<br />
lake. Management strategies include: natural area protection, minor restoration, and strong<br />
mitigation of agricultural and urban effects; enhance native biodiversity and ecological<br />
integrity using targets; use resources sustainability; prevent exotic invasives. The Habitat<br />
Strategy priorities are protection, then restoration, then rehabilitation. The guiding principles<br />
are: watershed scale; pre-European settlement as the baseline; integration of land and water<br />
management; protection of significant areas linked by corridors; restoration focus on restoring<br />
processes and function, address aquatic threats – dams, diversions, invasives; address<br />
emerging issues, incl. shoreline habitat protection related to climate change, via monitoring,<br />
research<br />
Environment Canada<br />
with partners<br />
Environment Canada<br />
with partners<br />
Great Lakes Wetlands<br />
<strong>Conservation</strong> Action <strong>Plan</strong><br />
A Framework for Guiding<br />
Habitat Rehabilitation in<br />
Great Lakes Areas of<br />
Concern (2004)<br />
Strategies include: increase public awareness; develop wetland database and understanding;<br />
secure wetlands; restore and enhance wetlands; strengthen legislation, policies, local<br />
planning; improve coordination; evaluate progress.<br />
<strong>Watershed</strong>-based suggested minimum guidelines for rehabilitation of forest, wetlands,<br />
riparian habitat. Towards de-listing of Areas of Concern<br />
Government of Canada Species at Risk Act Requires protection of wildlife species at risk. Includes species-specific recovery plans that<br />
may affect land use planning.<br />
Government of Canada Fisheries Act Protects fish habitat from unauthorized disruption with a goal to increase habitat capacity.<br />
The act applies to adjoining terrestrial systems where their functions affect fish habitat.<br />
Province of Ontario Endangered Species Act Prohibits interference with habitat of listed species<br />
Province of Ontario Fish and Wildlife<br />
Empowers MNR to manage fish and wildlife species and protect species at risk<br />
<strong>Conservation</strong> Act<br />
Province of Ontario <strong>Plan</strong>ning Act Provincial Policy Statement (PPS) prohibits development in significant wetlands and habitat<br />
of endangered and threatened species. It protects significant woodlands, valleylands, wildlife<br />
habitat and ANSIs from negative impacts of development and site alteration. It requires<br />
diversity, connectivity and ecological functions of natural areas be maintained, restored and<br />
improved.<br />
Ontario Ministry of<br />
Infrastructure Renewal<br />
Places to Grow <strong>Plan</strong> Protects the natural system: natural heritage, surface water features, ground water features,<br />
linkages. Intensifies growth in urban areas.<br />
Ontario Ministry of<br />
Natural Resources<br />
Ontario Ministry of the<br />
Environment, <strong>Niagara</strong><br />
Region and <strong>Niagara</strong><br />
<strong>Peninsula</strong> <strong>Conservation</strong><br />
Authority<br />
<strong>Niagara</strong> <strong>Peninsula</strong><br />
<strong>Conservation</strong> Authority,<br />
Ontario Ministry of the<br />
Environment,<br />
Environment Canada<br />
<strong>Niagara</strong> <strong>Peninsula</strong><br />
<strong>Conservation</strong> Authority<br />
Regional Municipality<br />
of <strong>Niagara</strong><br />
Town of <strong>Fort</strong> <strong>Erie</strong><br />
Ontario Biodiversity<br />
Strategy<br />
<strong>Niagara</strong> Water Quality<br />
Protection Strategy<br />
<strong>Niagara</strong> River Area of<br />
Concern Remedial Action<br />
<strong>Plan</strong><br />
<strong>Conservation</strong> Authorities<br />
Act and Generic<br />
Regulations<br />
Official <strong>Plan</strong><br />
Proposed Draft Official<br />
<strong>Plan</strong><br />
Goals include to protect biodiversity and to use natural heritage sustainably, capturing its<br />
benefits. Strategic directions include: engage Ontarians; promote stewardship, work together,<br />
integrate biodiversity conservation into land use planning, prevention over cure, improve<br />
understanding.<br />
Recognizes both the importance of water in maintaining natural heritage and the vital role of<br />
natural heritage in protecting water. Key strategies are: raise community awareness of natural<br />
heritage value and citizen roles; beneficiaries of natural heritage values contribute to<br />
protection; protection have priority over enhancement and restoration; replicate natural<br />
system functioning where possible<br />
A plan to reduce toxic chemical, nutrient and bacteria loadings; improve sediment quality,<br />
benthic health and groundwater quality; protect habitat; reduce agricultural non point sources;<br />
sustain recreational amenities and extend education. Environment Canada (2004a) has<br />
developed minimum guidelines for wetland, riparian and forest habitat rehabilitation towards<br />
de-listing areas of concern<br />
Any proposed development of restoration works affecting a watercourse, floodplain, shoreline<br />
or wetland will require a permit from <strong>Niagara</strong> <strong>Peninsula</strong> <strong>Conservation</strong> Authority.<br />
Healthy Landscape principles of: ecosystem health and sustainability, prevention through<br />
planning, protection plus restore, stewardship plus regulation, address cumulative impacts.<br />
Objectives add cooperation, maintain <strong>Niagara</strong>’s distinct character. Policies add ecosystem<br />
approach (interrelationships, effects on neighbours, long term effects), monitoring to adapt,<br />
shoreline access and naturalization. Targets are: 30% forest, 10% wetland, 30 m buffer along<br />
70% of first to third order streams.<br />
Mapped Core Natural Heritage System – Environmental Protection Areas (EPA) meet<br />
provincial PPS significance criteria; Environmental <strong>Conservation</strong> Areas (ECA) include<br />
regionally significant areas. Local natural heritage inventories incorporated into municipal<br />
OPs can override.<br />
Environment goals and objectives include enhanced natural heritage, efficient use of urban<br />
land and conservation of rural landscape, protection of features and functions, shoreline<br />
preservation. In support of general goals to maintain unique character and efficient growth<br />
patterns. Targets of 30% woodland, 10% wetland. EPA’s and ECA’s slightly refined from<br />
Region’s map, adding Locally Significant Areas, some trimming of ECAs in settlement areas.<br />
March 2008 107 <strong>Fort</strong> <strong>Erie</strong> <strong>Creeks</strong> <strong>Watershed</strong> <strong>Plan</strong><br />
General Report (105116)
TABLE 3.1.3:<br />
SUMMARY OF POLICIES, STRATEGIES AND PLANS RELEVANT TO THE NATURAL HERITAGE STRATEGY<br />
Policy/Strategy Source Policy/Strategy Title Relevance<br />
City of Port Colborne Draft Official <strong>Plan</strong> A strategic direction is strengthening and integrating natural, cultural and heritage resources.<br />
Strategic planning policies encourage conservation including restoration. Policies protect<br />
Environmental Areas (woodlots, wetlands, ANSI’s, habitat of species at risk, dynamic beach,<br />
watershed-scale corridors) with limited permitted uses and with requirements for sensitive<br />
designs, EIS’s and buffers. An associated Natural Environment Issues and Options<br />
Background Paper (Dillon et al) sets the key issues as percentage and quality of natural cover<br />
balanced with other community needs. Suggested objectives include: natural area protection<br />
and enhancement, strategies in cooperation with and compatible with agriculture, stewardship<br />
partnerships, meet PPS, set targets, protect from nearby uses, link and distribute, improve<br />
patches, monitor. It presents 3 options for degrees of protection proposing that the choice be<br />
based on the community vision.<br />
Carolinian Canada The Big Picture Toward re-establishing an ecologically viable natural heritage system, maps significant core<br />
natural areas for protection and options for restoration, enhancement and corridors. Goals<br />
include 30% natural, proportions of systems similar to pre-settlement, corridor linkages.<br />
LandCare <strong>Niagara</strong><br />
General<br />
Natural Heritage<br />
Framework<br />
3.2 Objectives<br />
Identifies three major natural heritage areas: <strong>Niagara</strong> River to QEW corridor; Beaver Creek<br />
corridor and Humberstone Marsh; plus general linkage zones and rights-of-way.<br />
To paraphrase the MOEE/MNR in “Water Management on A <strong>Watershed</strong> Basis” (1993), the<br />
general objective is “to produce a watershed plan developed in consultation with appropriate<br />
government agencies, and other stakeholders to manage water, land/water interactions, aquatic<br />
life and aquatic resources in order to protect and improve the health of the watershed ecosystem<br />
as land uses change”.<br />
Specific Goals from Local Initiatives:<br />
<strong>Niagara</strong> Water Quality Protection Strategy<br />
The NWQPS (2003) identified the need to manage watersheds in such a manner as to<br />
“sustain healthy rural and urban communities in harmony with a natural environment,<br />
rich in species diversity”.<br />
<strong>Niagara</strong> River Remedial Action <strong>Plan</strong><br />
The <strong>Niagara</strong> River Redial Action <strong>Plan</strong> (RAP), started in 1993, identified an Area of<br />
Concern (AOC) which covers a large portion of the <strong>Fort</strong> <strong>Erie</strong> <strong>Creeks</strong> <strong>Watershed</strong> <strong>Plan</strong><br />
study area. The Stage I Report (Environmental conditions and Problem Definition) was<br />
published in 1993, and the Stage II Implementation Annex, which outlined the numerous<br />
objectives/recommendations of the RAP, as well as the Agencies responsible for<br />
implementation, a schedule, and projected costs, was published in 2005.<br />
In 2004, a ten-year review of the Stage II Report was initiated, to reflect the changing<br />
criteria and status of some of the impairments. This resulted in a new list of 12<br />
Recommendations (replacing the 37 Stage II recommendations from 1995):<br />
March 2008 108 <strong>Fort</strong> <strong>Erie</strong> <strong>Creeks</strong> <strong>Watershed</strong> <strong>Plan</strong><br />
General Report (105116)
Category<br />
Water Quality –<br />
Municipal<br />
Water Quality – Rural<br />
Sediment Quality<br />
TABLE 3.1.4<br />
CURRENT NIAGARA RIVER REMEDIAL ACTION PLAN RECOMMENDATIONS<br />
Recommendations<br />
Implement municipal storm and waste water quality improvement projects through infrastructure upgrades,<br />
optimization, pollution prevention and control planning initiatives.<br />
Identify priority target areas for water quality and habitat improvement and encourage landowner participation<br />
through funding incentives, education, and outreach.<br />
Implement the sediment remediation actions identified through the management plans for contaminated sediment<br />
sites in the AOC.<br />
Biota/Habitat/Land Use<br />
Human Health<br />
Surveillance &<br />
Monitoring<br />
Outreach & Education<br />
General<br />
Support the implementation of municipal natural heritage strategies within the <strong>Niagara</strong> River AOC.<br />
While fish consumption advisories are necessary, adequately communicate and encourage the use of:<br />
(1) the government’s “Guide to Eating Ontario Sport Fish” and (2) any advisories to protect human consumers<br />
from consumption of snapping turtle.<br />
Establish and support a monitoring plan for the RAP.<br />
Develop and deliver education and community programs that address matters of interest to the RAP or that<br />
support RAP implementation.<br />
Provincial and federal governments continue an integrated ecosystem approach to management for its agencies.<br />
All levels of government continue providing resources for RAP initiatives and make projects in Great Lakes<br />
AOCs a priority for infrastructure funding.<br />
The <strong>Niagara</strong> River RAP endorse and encourage the process of multi-sectoral liaison committees as the vehicle to<br />
facilitate the satisfactory remediation of water quality in the <strong>Niagara</strong> River AOC.<br />
That the NPCA maintain its G.I.S. restoration database as a tool in determining priority areas for remediation<br />
within the watershed and collaborate with NWS in G.I.S. information management.<br />
Continue to protect natural habitat on both sides of the <strong>Niagara</strong> River as one ecosystem and seek opportunities<br />
for international cooperation.<br />
Town of <strong>Fort</strong> <strong>Erie</strong> Official <strong>Plan</strong><br />
The Town of <strong>Fort</strong> <strong>Erie</strong> Official <strong>Plan</strong> (adopted by Town Council September 11, 2006)<br />
states the goal for the environment is “To provide present and future residents of the<br />
Town with a high quality living environment that protects and enhances natural heritage<br />
features, minimizes pollution of water, air, and land resources and ensures good<br />
community planning and design”. The Official <strong>Plan</strong> lists a further six objectives:<br />
a) “Tog encourage the efficient use of land resources in the Town and to encourage<br />
the continuation of viable agricultural operations and conservation of the rural<br />
landscape.<br />
b) To identify Natural Hazard Areas for the protection of life and property.<br />
c) To ensure urban development is attractive and appropriately considers the<br />
protection of natural heritage features and functions from the site specific to<br />
watershed levels.<br />
d) To encourage early recognition and regulation of existing and potentially<br />
incompatible uses resulting from adverse environmental effects, including sound,<br />
vibration and gas odour.<br />
March 2008 109 <strong>Fort</strong> <strong>Erie</strong> <strong>Creeks</strong> <strong>Watershed</strong> <strong>Plan</strong><br />
General Report (105116)
e) To ensure the preservation of Lake <strong>Erie</strong>, the <strong>Niagara</strong> River and their shorelines<br />
as major environmental resources, consistent with the recreational potential and<br />
the needs of the resident and tourist population.<br />
f) To recognize the importance of the <strong>Niagara</strong> River as one of forty-three Areas of<br />
Concern in the Great Lakes Basin identified by the federal and provincial<br />
governments in cooperation with the International Joint Commission.”<br />
Friends of <strong>Fort</strong> <strong>Erie</strong> <strong>Creeks</strong><br />
The Friends of <strong>Fort</strong> <strong>Erie</strong> <strong>Creeks</strong> is an active local interest group, whose objectives<br />
include the annual monitoring of the creeks for water quality, fisheries, and erosion. The<br />
group also manages local restoration and clean-up projects. One other objective is to coordinate<br />
research and summer student employment programs in the study area.<br />
Goals Developed Through Public Consultation<br />
Three goals or vision statements were developed at the first workshop, held in April 2006. These<br />
goals were further broken down into a long-list of issues at the second workshop, held in<br />
October 2006. The goals or objectives developed by the Public were:<br />
1. That our community learns how to maintain the natural features of our watershed and<br />
continues to work together to enhance and appreciate its value for seven generations.<br />
2. Attractive, healthy, functioning natural areas (creeks, shoreline, natural heritage<br />
features) become the focal point for land use planning, integrating opportunities<br />
managed human access.<br />
3. Better maintained creeks, with less debris jams, a marsh at creek outlets to trap sediment,<br />
grassed buffers, enhanced water and land values, undoing years of abuse, and<br />
nature/development/farming in harmony.<br />
Through the consultation with the Public, the following objectives were recorded:<br />
1. Protect, Enhance and Restore Watercourses/Wetlands/Woodlots<br />
2. Manage Urban Runoff from Existing and Future Development Areas<br />
3. Address Impacts from Point and Non-Point Source Contaminants<br />
4. Preserve and Enhance the quality and quantity of groundwater.<br />
5. Protect the Lake <strong>Erie</strong> and <strong>Niagara</strong> River shorelines.<br />
6. Integrate rural and agricultural land uses with the ecosystem.<br />
3.2.1 Hydrogeology<br />
• Develop the Study Area in a manner that maintains and/or enhances groundwater<br />
recharge and prevents groundwater level declines and reductions in baseflow. Ensure<br />
that future baseflow maintains permanent and seasonal fish habitat where the<br />
groundwater function exists.<br />
• Minimize the potential negative impacts arising from land use practices and/or<br />
development (i.e. pesticides, herbicides, and fertilizers; septic systems, stormwater<br />
infiltration, leaky underground storage tanks) which represents a threat to groundwater<br />
quality for water wells and ultimately stream water quality.<br />
March 2008 110 <strong>Fort</strong> <strong>Erie</strong> <strong>Creeks</strong> <strong>Watershed</strong> <strong>Plan</strong><br />
General Report (105116)
• Provide guidelines to carry out Phased Hydrogeologic Studies for development<br />
applications. These studies would confirm and refine the hydrogeologic sensitivity of the<br />
development setting within the context of the type of development and potential impacts<br />
to groundwater quantity and quality.<br />
• Carry out water well surveys in areas of high density development (i.e. 5 or more units on<br />
less than 2 acres lots and/or the areas can be refined at the outset of the study) on private<br />
wells and septic systems to assess potential aquifer contamination, water well integrity<br />
and management options.<br />
3.2.2 Flooding<br />
• Mitigate or eliminate currently flood prone areas.<br />
• Control future development flows so that flood potential throughout the watershed, and in<br />
particular in the identified flood damage centres do not increase.<br />
• Manage flooding concerns in a manner that maintains fish habitat and any other natural<br />
resources or features.<br />
3.2.3 Erosion<br />
• Mitigate potential erosion impacts through control of peak flow rates and runoff volumes<br />
from the development area through implementation of erosion control storage.<br />
• Manage stream bank erosion in a manner which maintains fish habitat and any other<br />
natural resources or features.<br />
• Where necessary, address severe erosion through “natural” stabilization measures.<br />
3.2.4 Stream Morphology<br />
• Encourage protection of well-defined watercourse features including those watercourses<br />
which periodically are dry.<br />
• Where appropriate and feasible; restore sinuosity, maintain and protect physical habitat<br />
attributes (pool, riffles, etc.); maintain diversity and fluvial processes; prevent increases<br />
in erosion and deposition.<br />
• Characterize each reach in the study area and, based on the morphological attributes of<br />
each channel reach, determine the physical and biological health of the watercourses.<br />
3.2.5 Aquatic Habitat and Fisheries<br />
• Minimize thermal impacts of development on the <strong>Fort</strong> <strong>Erie</strong> <strong>Creeks</strong> and their tributaries.<br />
• Ensure that no net loss of productive capacity of the existing fish habitat occurs, and<br />
incorporate enhancement where feasible.<br />
March 2008 111 <strong>Fort</strong> <strong>Erie</strong> <strong>Creeks</strong> <strong>Watershed</strong> <strong>Plan</strong><br />
General Report (105116)
• Prevent installation of barriers to movement permanently or seasonally where upstream<br />
habitat exists and remove existing barriers where possible.<br />
• Maintain associated floodplain and riparian habitat linkages to the stream habitat.<br />
3.2.6 Surface Water Quality<br />
• Control quality of stormwater runoff from future developed surfaces so that existing<br />
stream and groundwater quality is maintained.<br />
• Utilize source control management techniques wherever feasible to maintain<br />
hydrogeologic functions of the study area.<br />
• Identify other potential contaminant sources in the watershed (historical and current).<br />
3.2.7 Terrestrial Natural Heritage<br />
Objectives for natural heritage (ref. Table 3.2.1) are advanced to meet the requirements and main<br />
objectives of the policies and strategies listed in Tables 3.1.1 and 3.1.3, as well as those<br />
identified by the public.<br />
Theme<br />
Ecological Health<br />
Ecological Services<br />
Public Awareness<br />
Flexibility<br />
Compatibility<br />
Update<br />
TABLE 3.2.1:<br />
OBJECTIVES FOR TERRESTRIAL NATURAL HERITAGE: FORT ERIE WATERSHEDS<br />
Objective<br />
Maintain and improve the natural heritage system including its natural features, areas, diversity and connectivity while<br />
protecting the area’s significant species, specialized or threatened habitats and distinct character.<br />
Protect and restore natural ecosystems that perform important ecological services contributing to the economic, social<br />
and ecological health of the area<br />
Promote community participation and awareness of a: the value and distinctiveness of its natural heritage and<br />
functioning; and b) the plan’s stewardship opportunities for citizens to maintain, improve and monitor natural heritage.<br />
Build in flexibility for landowner options and for future knowledge and issues<br />
Comply with existing policies, strategies and plans (see Table 3.1.3) with priority to PPS and Region’s and Towns’<br />
OP’s<br />
Maintain relevancy through current information<br />
3.3 Targets<br />
3.3.1 Storm Drainage System<br />
Town of <strong>Fort</strong> <strong>Erie</strong> standards require that the design of each subdivision include provisions for a<br />
minor system (i.e. storm sewer) which is sized for the 5 year return period event as well as major<br />
system overland flow routes. Major and minor system capacity on streets and overland flow<br />
routes must be provided to a minimum of the 100 year return event peak flows.<br />
Drainage areas greater than 40 to 80 hectares may require dedicated overland flow routes in<br />
addition to that provided through area roadways.<br />
Storm drainage systems must be designed with consideration of upstream development in<br />
accordance with the Official <strong>Plan</strong>.<br />
March 2008 112 <strong>Fort</strong> <strong>Erie</strong> <strong>Creeks</strong> <strong>Watershed</strong> <strong>Plan</strong><br />
General Report (105116)
• Maintain pre-development flow duration exceedance characteristics.<br />
• Future development should control peak flow rates to existing levels for the 1:2 year to<br />
1:100 year design events inclusively. Erosion control facilities should be installed in the<br />
study area, and should be considered on a subwatershed basis.<br />
3.3.2 Creek Erosion<br />
Erosion impact mitigation has been proposed to be addressed through incorporation of extended<br />
detention storage within stormwater management facilities. The volume of extended detention<br />
storage has been based on the requirements to detain site runoff resulting from a four hour,<br />
25 mm rainfall event as recommended in the stormwater management planning manual (ref.<br />
MOE, 2003). This volumetric criterion has been evaluated in the context of specific<br />
recommendations in the <strong>Watershed</strong> <strong>Plan</strong>. Future local study would be needed to further refine<br />
this approach.<br />
3.3.3 Water Quality<br />
The Ministry of the Environment Stormwater Management Practices <strong>Plan</strong>ning and Design<br />
Manual outlines storage requirements for water quality treatment for each type of stormwater<br />
management technique. Fisheries habitat constraints indicate that between a Level 1 and Level 3<br />
Habitat protection level would be required.<br />
Due to the recreational swimming uses of Lake <strong>Erie</strong> and <strong>Niagara</strong> River, the Town requires the<br />
effluent to have less than 100 fecal coliforms per 100 ml except for four occurrences annually<br />
(Town of <strong>Fort</strong> <strong>Erie</strong>, Storm Drainage Master <strong>Plan</strong>, by Kerry T. Howe Engineering Ltd. May<br />
1994).<br />
3.3.4 Terrestrial Natural Heritage<br />
Objective 1: Maintain and improve the natural heritage system including its natural features,<br />
areas, diversity and connectivity while protecting the area’s significant species, specialized or<br />
threatened habitats and distinct character.<br />
Targets:<br />
• Environment Canada-based minimum guidelines for wetland, forest, interior<br />
forest and riparian cover<br />
• Development directed away from natural features and areas<br />
• Corridors in draft OP’s of the Towns of <strong>Fort</strong> <strong>Erie</strong> and Port Colborne, the Region’s<br />
OP and LandCare <strong>Niagara</strong>, linking with neighbouring watersheds<br />
• Functional natural landscapes in proportion to original<br />
• Enhancement for accessible opportunities in immature successional areas where<br />
the slough mosaic has been levelled<br />
• Restoration that replicates the functioning of original natural landscapes<br />
• Priority of globally significant communities<br />
Objective 2: Protect and restore natural ecosystems that perform important ecological services<br />
contributing to the economic, social and ecological health of the area.<br />
March 2008 113 <strong>Fort</strong> <strong>Erie</strong> <strong>Creeks</strong> <strong>Watershed</strong> <strong>Plan</strong><br />
General Report (105116)
Targets:<br />
• Priority to long-term protection: of globally provincially, regionally and locally<br />
significant natural features, functions and areas<br />
• Methods to: minimize nuisance wildlife and invasive exotics; maintain wetlands<br />
while also maintaining drains; minimize off-site impacts on natural areas; use<br />
natural heritage sustainability<br />
• Restoration area options important for water protection that avoid prime farmland.<br />
• Compact urban areas, efficient growth patterns, green infrastructure encouraged.<br />
• Encourage options for rural income based on sustainable natural heritage use.<br />
Objective 3: Promote community participation and awareness of a) the value and<br />
distinctiveness of its natural heritage and functioning; and b) the plan’s stewardship opportunities<br />
for citizens to maintain, improve and monitor natural heritage.<br />
Targets:<br />
• User-friendly subwatershed-based summaries of ecosystem functioning, issues<br />
and possible actions.<br />
• Promotion of agency-private-NGO partnerships, information sharing, cost sharing<br />
among beneficiaries and actions towards common goals.<br />
• Suggestions for increasing passive recreational public access to natural areas and<br />
shorelines.<br />
Objective 4: Build in flexibility for landowner options and for future knowledge and issues.<br />
Targets:<br />
• Priority to protection<br />
• Outline of a strategy to monitor natural ecosystem functioning and cumulative<br />
impacts: participatory, scientifically valid, inexpensive, long term, compatible<br />
with regional monitoring systems; produces highly accessible and meaningful<br />
output<br />
• Options for enhancement and restoration areas<br />
Objective 5: Comply with existing policies, strategies and plans<br />
Targets:<br />
• Objectives and targets of documents in Table 3.1.3 fulfilled<br />
• Support for all regulatory requirements.<br />
Objective 6: Maintain relevancy through current information<br />
Targets:<br />
• Knowledge gaps flagged<br />
• Response to long term issues such as climate change and peak oil (point, some<br />
experts predict as soon, when oil production will start to decline rapidly and<br />
prices start to soar, once easily accessible fields are depleted.)<br />
• Encourage adaptation to monitoring findings, new knowledge and new issues.<br />
March 2008 114 <strong>Fort</strong> <strong>Erie</strong> <strong>Creeks</strong> <strong>Watershed</strong> <strong>Plan</strong><br />
General Report (105116)
4. IMPACT ASSESSMENT<br />
As outlined in Section 2, the <strong>Watershed</strong> <strong>Plan</strong> is not intended to prescribe land uses or specific<br />
locations for development, as this planning process is being completed by the Town of <strong>Fort</strong> <strong>Erie</strong>,<br />
through an updated Official <strong>Plan</strong> process. Rather it is the intent that this <strong>Watershed</strong> <strong>Plan</strong><br />
complement land use planning and allow for an integration of the <strong>Watershed</strong> <strong>Plan</strong> findings with<br />
the Official <strong>Plan</strong>, through the definition of constraints and management opportunities.<br />
This report section specifically provides insight as to the impact of proposed development on the<br />
important resources in the <strong>Watershed</strong> <strong>Plan</strong> study area, in terms of the quantity of runoff<br />
(baseflow, flooding and erosion), quality of runoff, the natural heritage system, and the<br />
watercourse systems.<br />
Through the exercise of conducting the impact assessment, each of the sub-disciplines has<br />
generated a set of key issues, or constraint areas where mitigation protection or restoration<br />
efforts will be required. A graphical depiction of the issues for the entire study area is shown on<br />
Drawing 1 as a complement to this assessment.<br />
4.1 Water Quantity<br />
4.1.1 Groundwater and Baseflow<br />
The primary impacts to quantity and quality within the groundwater flow systems are caused by<br />
a (1) a reduction in recharge by reducing the ground surface permeability for infiltration, (2)<br />
groundwater pumping, and (3) introduction of contaminants (i.e. pesticides, herbicides, and<br />
fertilizers; septic systems, stormwater infiltration, leaky underground storage tanks). In addition<br />
to impacting the local water wells, the subsequent groundwater discharge to local streams and<br />
wetlands may be impacted. At this time there is no definitive data or observations which would<br />
indicate any significant impacts to the local groundwater flow systems. Areas where there are<br />
higher densities of private wells and septic systems (i.e. southern part of Six Mile Creek and<br />
Bertie Bay Drains) are more prone to local contamination relating to nitrogen species and<br />
bacteria. These conditions may be very local to the aquifer or the site specific well. Potential<br />
impacts resulting from future land use change should be analyzed through site specific studies at<br />
the design stage.<br />
4.1.2 Flooding<br />
Hydrologic processes are central to many of the natural functions and features within the study<br />
area, hence maintaining or enhancing hydrologic functions as land uses change is important to<br />
preserve existing resources. Significant alterations to subwatershed hydrologic response may<br />
negatively impact on the receiving system, in terms of increased flood potential, reduced<br />
baseflows and alterations to channel forming processes, as well as the aquatic systems which are<br />
supported.<br />
March 2008 115 <strong>Fort</strong> <strong>Erie</strong> <strong>Creeks</strong> <strong>Watershed</strong> <strong>Plan</strong><br />
General Report (105116)
The purpose of the hydrologic modeling has been to evaluate the impact of development on the<br />
hydrologic processes within the subwatershed areas and to determine potential methods to<br />
manage impacts, specifically:<br />
• Baseflow flow<br />
• peak flow rates and flood potential<br />
• in-stream erosion potential<br />
A Future Land Use hydrologic model has been developed based on the proposed urban<br />
development within Subwatershed Areas. The impervious coverage for future conditions has<br />
been based on the Town of <strong>Fort</strong> <strong>Erie</strong> Official <strong>Plan</strong> (September 11, 2006).<br />
The hydrology of the entire study area has been estimated using SWMHYMO for existing land<br />
use and for future land uses. The hydrological model and its parameters have been discussed in<br />
Section 2. Table 4.1.1 summarizes the frequency flows for existing land use for the various<br />
subwatersheds at key points of interest (ref. Figure 8 for nodal locations).<br />
Black Creek<br />
Location<br />
TABLE 4.1.1:<br />
FREQUENCY FLOWS (m3/s)<br />
EXISTING LAND USE<br />
Frequency (year)<br />
Node<br />
2 5 10 25 50 100<br />
Tributary 1 At outlet to <strong>Niagara</strong> River 9.62 29.31 46.11 70.20 89.88 110.53<br />
Tributary 1 At QEW - Conf of Black and Beaver BLK-19 9.04 28.03 44.31 67.70 86.88 106.93<br />
Tributary 1 Before Conf. with Beaver BLK-18 6.74 19.12 29.11 43.28 54.93 66.91<br />
Tributary 1 Before Snyder Drain BLK-16 5.93 17.15 26.16 39.02 49.56 60.38<br />
Tributary 1 After Conf. With Tr. 2 BLK14 5.67 16.46 25.10 37.48 47.58 57.96<br />
Tributary 1 Before Conf. With Tr. 2 BLK13 1.38 3.60 5.37 7.84 9.84 11.90<br />
Tributary 1 After Blk101 BLK11 0.69 1.79 2.65 3.85 4.82 5.83<br />
Tributary 1 Headwater BLK100 0.38 0.92 1.35 1.94 2.40 2.87<br />
Tributary 2 Before Conf. With Tr. 1 (Flow Gauge) BLK25 4.29 12.87 19.75 29.65 37.75 46.08<br />
Tributary 2 Add BLK301 BLK31 4.18 12.42 19.26 29.15 37.16 45.47<br />
Tributary 2 Before Conf. With March Dr (Tr3) BLK-24 1.85 5.85 9.20 14.05 17.99 22.03<br />
Tributary 2 Headwater BLK-23 1.39 4.65 7.38 11.93 14.63 17.96<br />
Tributary 2 Headwater BLK-22 0.79 2.79 4.55 7.16 9.29 11.48<br />
Tributary 3 Conf of Tr.4, Tr.5 with Tr.3 MAD-11 1.24 3.46 5.31 7.95 10.08 12.31<br />
Tributary 3 Tr.6 in Tr. 3 MAD-13 2.21 6.27 9.71 14.62 18.55 22.70<br />
Tributary 4 Tr.4 MAD-10 0.89 2.58 4.01 6.08 7.76 9.52<br />
Tributary 5 Tr.5 RTD-10 0.44 1.16 1.74 2.55 3.19 3.86<br />
Tributary 6 Conf. With Schihl Drain STJ-11 1.21 3.30 4.97 7.33 9.19 11.14<br />
Tributary 6 Headwater STJ-10+STJ102 0.73 1.99 3.02 4.49 5.63 6.85<br />
Tributary 7 Headwater SCH100+SCH101 0.53 1.39 2.09 3.07 3.85 4.65<br />
Beaver Creek<br />
Tributary 1 before conf. With Black Cr BEV 29.1 + BEV 211 2.44 8.92 15.26 24.64 32.48 40.66<br />
Tributary 1 BEV-29 1.90 6.80 11.87 19.32 25.54 32.31<br />
Tributary 1 After Conf. With Tr. 2 BEV-27 1.87 6.02 9.90 16.16 21.03 26.53<br />
March 2008 116 <strong>Fort</strong> <strong>Erie</strong> <strong>Creeks</strong> <strong>Watershed</strong> <strong>Plan</strong><br />
General Report (105116)
Location<br />
TABLE 4.1.1:<br />
FREQUENCY FLOWS (m3/s)<br />
EXISTING LAND USE<br />
Frequency (year)<br />
Node<br />
2 5 10 25 50 100<br />
Tributary 1 BEV-17 1.55 4.95 8.05 12.38 16.09 19.88<br />
Tributary 1 BEV-16 1.33 4.01 6.30 9.62 12.38 15.21<br />
Tributary 1 BEV-14 1.25 3.66 5.69 8.63 11.07 13.55<br />
Tributary 1 Tr.1 Headwater BEV-13 0.89 2.29 3.44 5.12 6.50 7.93<br />
Tributary 2 Before Conf with Tr. 1 BEV-26 1.65 5.22 8.71 13.72 17.87 22.29<br />
Tributary 2 BEV-23 1.41 3.83 6.09 8.90 11.33 13.90<br />
Tributary 2 BEV-21 1.34 3.70 5.81 8.58 10.89 13.40<br />
Tributary 2 Tr.2 Headwater BEV-20 0.71 1.85 2.77 4.05 5.07 6.12<br />
Six Mile Creek<br />
Mann Drain Mann Drain Tr. 3 MAN 101 1.06 2.28 2.58 4.46 6.04 8.13<br />
Mann Drain Mann Drain Tr. 4 MAN 100 0.77 2.15 3.29 4.89 6.17 7.5<br />
Mann Drain Mann Drain Tr. 3 MAN-10 1.52 4.36 5.82 9.32 12.14 15.31<br />
Six Mile Creek Six Mile Cr. Tr. 1 SIX-40 0.96 2.38 3.52 5.11 6.38 7.68<br />
Six Mile Creek Six Mile Cr. Tr. 2 SIX-11 0.77 2.45 3.89 5.96 7.65 9.40<br />
Six Mile Creek Conf. Of Tr.1 and Tr. 2 SIX-22 2.50 7.07 10.91 16.36 20.77 25.36<br />
Six Mile Creek Six Mile Cr. Tr. 1 and Mann Drain SIX-14 4.82 13.15 20.10 30.46 38.81 47.40<br />
Miller Creek<br />
Miller Creek Headwaters MIL 100 0.92 2.49 3.76 5.54 6.98 8.46<br />
Miller Creek MIL-11 1.18 3.35 5.12 7.63 9.68 11.80<br />
Miller Creek At outlet MIL-12 1.69 4.42 6.61 9.69 12.17 14.71<br />
Kraft Drain<br />
Tributary 1 Headwater KRD 100 0.19 0.53 0.90 1.56 2.29 3.05<br />
Tributary 1 Headwater KRD 102 0.58 1.64 3.03 5.30 7.33 9.67<br />
Tributary 2 Headwater KRD 103 0.37 1.02 1.57 2.34 2.96 3.60<br />
Tributary 3 Headwater KRD-12 0.71 1.92 3.24 5.31 7.10 9.23<br />
At Outlet Confluence of all Tributaries KRD-13 1.25 3.49 5.73 9.10 12.10 15.51<br />
Baker Creek<br />
Baker Creek Headwaters BAK-10 0.49 1.34 2.03 3.01 3.79 4.60<br />
Baker Creek Conf. With Dr. Cobb Drain Outlet 0.83 2.12 3.14 4.62 5.81 7.07<br />
In order to assess the potential impacts of future development on peak flows, the Draft Official<br />
<strong>Plan</strong> has been reviewed (ref. March 2006). Most of the future development in the Town of <strong>Fort</strong><br />
<strong>Erie</strong> would proceed as ‘Greenfield’ development. The Official <strong>Plan</strong> also suggests the<br />
re-designation of certain residential designations to urban designations with an Environmental<br />
<strong>Conservation</strong> overlay designation. Since the Official <strong>Plan</strong> is in a draft form, a land use plan with<br />
conservatively high imperviousness has been used for further analyses. Overall, future<br />
imperviousness, within the study area, would increase from 5.8 % (+/-) at present to 10 % (+/-)<br />
(ref. Table 4.1.2).<br />
March 2008 117 <strong>Fort</strong> <strong>Erie</strong> <strong>Creeks</strong> <strong>Watershed</strong> <strong>Plan</strong><br />
General Report (105116)
<strong>Watershed</strong> / Subcatchment<br />
TABLE 4.1.2:<br />
PROPOSED INCREASE IN IMPERVIOUS AREA BY CATCHMENT<br />
Drainage Area<br />
(km2)<br />
Existing<br />
Impervious Area<br />
(km2)<br />
Future<br />
Increase in %<br />
Imperviousness<br />
BLK 205 2.99 0.75 1.36 21%<br />
BEV 202 0.66 0.28 0.35 11%<br />
BEV 2020 0.43 0.00 0.05 13%<br />
BEV 203 0.56 0.17 0.27 19%<br />
MIL 100 4.45 0.16 1.20 24%<br />
MIL 101 2.06 0.00 0.35 17%<br />
BAK 200 1.20 0.01 0.21 17%<br />
KRD 100 0.67 0.05 0.41 55%<br />
KRD 101 1.15 0.34 0.49 13%<br />
KRD 102 1.64 0.06 0.41 22%<br />
KRD 103 2.09 0.02 0.28 13%<br />
BER 102 0.89 0.01 0.12 13%<br />
MAN 102 0.75 0.00 0.14 19%<br />
SIX 102 1.33 0.00 0.15 12%<br />
SIX 103 2.21 0.00 0.35 16%<br />
SIX 400 3.40 0.14 0.63 15%<br />
The future land use mapping by the Town has been used to develop the hydrologic model input<br />
parameters and accordingly a SWMHYMO model has been developed. The frequency flows<br />
have been summarized in Table 4.1.3, and the increase in 100 year peak flows, at the outlet of<br />
each watershed, have been summarized in Table 4.1.4.<br />
Black Creek<br />
Location<br />
TABLE 4.1.3:<br />
FREQUENCY FLOWS (m 3 /s)<br />
FUTURE LAND USE<br />
Node<br />
Frequency (year)<br />
2 5 10 25 50 100<br />
Tributary 1 At outlet to <strong>Niagara</strong> River BLK-20 10.63 30.90 48.10 72.58 92.59 113.40<br />
Tributary 1 At QEW - Conf of Black and Beaver BLK-19 10.08 29.68 46.35 70.13 89.63 109.84<br />
Tributary 1 Before Conf. with Beaver BLK-18 7.48 19.91 30.01 44.33 56.08 68.10<br />
Tributary 1 Before Snyder Drain BLK-16 6.61 17.82 26.92 39.90 50.12 61.38<br />
Tributary 1 After Conf. With Tr. 2 BLK14 6.29 17.06 25.80 38.28 48.44 58.86<br />
Tributary 1 Before Conf. With Tr. 2 BLK13 1.48 3.75 5.55 8.06 10.08 12.17<br />
Tributary 1 After Blk101 BLK11 0.73 1.86 2.74 3.96 4.94 5.96<br />
Tributary 1 Headwater BLK100 0.38 0.92 1.35 1.94 2.40 2.87<br />
Tributary 2 Before Conf. With Tr. 1 (Flow Gauge) BLK25 4.83 13.32 20.26 30.23 38.37 46.71<br />
Tributary 2 Add BLK301 BLK31 4.52 12.97 19.88 29.84 37.91 46.25<br />
Tributary 2 Before Conf. With March Dr (Tr3) BLK-24 2.15 6.37 9.81 14.74 18.76 22.84<br />
Tributary 2 Headwater BLK-23 1.68 5.15 7.97 12.04 15.36 18.73<br />
Tributary 2 Headwater BLK-22 0.97 3.16 4.94 7.59 9.76 11.98<br />
Tributary 3 Conf of Tr.4, Tr.5 with Tr.3 MAD-11 1.24 3.46 5.31 7.95 10.08 12.31<br />
Tributary 3 Tr.6 in Tr. 3 MAD-13 2.22 6.29 9.73 14.65 18.57 22.72<br />
Tributary 4 Tr.4 MAD-10 0.89 2.58 4.01 6.08 7.76 9.52<br />
Tributary 5 Tr.5 RTD-10 0.44 1.16 1.74 2.55 3.19 3.86<br />
Tributary 6 Conf. With Schihl Drain STJ-11 1.22 3.31 4.98 7.35 9.21 11.16<br />
Tributary 6 Headwater STJ-10+STJ102 0.74 2.00 3.04 4.51 5.65 6.87<br />
March 2008 118 <strong>Fort</strong> <strong>Erie</strong> <strong>Creeks</strong> <strong>Watershed</strong> <strong>Plan</strong><br />
General Report (105116)
Location<br />
TABLE 4.1.3:<br />
FREQUENCY FLOWS (m 3 /s)<br />
FUTURE LAND USE<br />
Node<br />
Frequency (year)<br />
2 5 10 25 50 100<br />
Tributary 7 Headwater SCH100+SCH101 0.53 1.39 2.09 3.07 3.85 4.66<br />
Beaver Creek<br />
Tributary 1 before conf. With Black Cr BEV 29.1 + BEV 211 2.77 9.82 16.44 26.10 34.14 42.52<br />
Tributary 1 BEV-29 2.27 7.68 13.20 20.92 27.39 34.28<br />
Tributary 1 After Conf. With Tr. 2 BEV-27 2.20 6.72 11.23 17.39 22.69 28.15<br />
Tributary 1 BEV-17 1.73 5.45 8.66 13.25 16.97 20.88<br />
Tributary 1 BEV-16 1.57 4.39 6.86 10.33 13.12 15.99<br />
Tributary 1 BEV-14 1.45 4.05 6.27 9.36 11.85 14.39<br />
Tributary 1 Tr.1 Headwater BEV-13 1.05 2.65 3.93 5.79 7.23 8.76<br />
Tributary 2 Before Conf with Tr. 1 BEV-26 2.00 5.99 9.99 15.07 19.53 23.99<br />
Tributary 2 BEV-23 1.63 4.24 6.55 9.68 12.13 15.17<br />
Tributary 2 BEV-21 1.45 3.91 6.08 8.83 11.29 13.77<br />
Tributary 2 Tr.2 Headwater BEV-20 0.76 1.92 2.85 4.13 5.16 6.21<br />
Six Mile Creek<br />
Mann Drain Mann Drain Tr. 3 MAN 101 1.06 2.28 2.58 4.46 6.04 8.13<br />
Mann Drain Mann Drain Tr. 4 MAN 100 1.17 2.84 4.14 5.91 7.29 8.70<br />
Mann Drain Mann Drain Tr. 3 MAN-10 1.92 5.06 6.64 10.35 13.27 16.55<br />
Six Mile Creek Six Mile Cr. Tr. 1 SIX-40 1.14 2.76 4.02 5.75 7.11 8.50<br />
Six Mile Creek Six Mile Cr. Tr. 2 SIX-11 0.77 2.45 3.89 5.96 7.65 9.40<br />
Six Mile Creek Conf. Of Tr.1 and Tr. 2 SIX-22 2.95 7.94 12.02 17.75 22.35 27.09<br />
Six Mile Creek Six Mile Cr. Tr. 1 and Mann Drain SIX-14 5.94 15.21 22.73 33.68 42.42 51.33<br />
Miller Creek<br />
Miller Creek Headwaters MIL 100 2.06 4.26 6.75 10.71 14.97 18.63<br />
Miller Creek MIL-11 2.40 5.48 8.36 12.69 16.09 19.68<br />
Miller Creek At outlet MIL-12 2.22 5.45 8.32 12.43 15.93 19.36<br />
Kraft Drain<br />
Tributary 1 Headwater KRD 100 0.76 1.82 2.85 4.15 5.27 6.49<br />
Tributary 1 Headwater KRD 102 1.33 2.42 3.93 6.61 8.96 11.73<br />
Tributary 2 Headwater KRD 103 0.41 1.10 1.67 2.46 3.09 3.75<br />
Tributary 3 Headwater KRD-12 1.41 3.67 5.77 8.65 11.04 13.87<br />
At Outlet Confluence of all Tributaries KRD-13 2.09 5.42 8.27 12.65 16.44 20.74<br />
Baker Creek<br />
Baker Creek Headwaters Bak-10 0.56 1.47 2.20 3.20 4.01 4.84<br />
Baker Creek Conf. With Dr. Cobb Drain Outlet 1.06 2.50 3.61 5.17 6.43 7.75<br />
March 2008 119 <strong>Fort</strong> <strong>Erie</strong> <strong>Creeks</strong> <strong>Watershed</strong> <strong>Plan</strong><br />
General Report (105116)
TABLE 4.1.4:<br />
100 YEAR PEAK FLOW COMPARISON AT SUBWATERSHED OUTLET<br />
Subwatershed<br />
Black Creek (At<br />
Confluence with Beaver<br />
Creek)<br />
Area<br />
(ha)<br />
Existing Peak Flow Future Peak Flow (m 3 /s) Increase in Peak Flow (m3/s)<br />
(m 3 /s) (m 3 /s) (m 3 /s) (%)<br />
6374 66.91 68.1 1.19 2%<br />
Beaver Creek (At<br />
Confluence with Black<br />
Creek)<br />
3777 40.66 42.52 1.86 5%<br />
Black Creek at Outlet 10656 110.53 113.4 2.87 3%<br />
Six Mile Creek E.F 1805 47.4 51.33 3.93 8%<br />
Miller Creek 901 14.71 19.36 4.65 32%<br />
Baker Creek 431 7.07 7.75 0.68 10%<br />
Kraft Drain 555 15.51 20.74 5.23 34%<br />
The results indicate that the 100 year flows would marginally increase in Black Creek and<br />
Beaver Creek, while they would significantly increase in the Six Mile Creek, Miller Creek,<br />
Baker Creek and Kraft Drain, due to the planned urbanization in these watersheds (without<br />
stormwater management). Table 4.1.5 provides the difference in peak flows at the<br />
subcatchments where the catchment scale percentage imperviousness has increased 10% or more<br />
(ref. Drawing 1).<br />
TABLE 4.1.5:<br />
CHANGE IN PEAK FLOWS (m3/s)<br />
Drainage<br />
Frequency / Land Use<br />
<strong>Watershed</strong> /<br />
Subcatchment<br />
Area<br />
5 Year 100 Year<br />
(km2) Existing Future Difference Existing Future Difference<br />
BLK 205 2.99 3.72 6.06 63% 17.80 24.30 37%<br />
BEV 202 0.66 2.27 2.84 25% 8.98 10.18 13%<br />
BEV 2020 0.43 0.38 0.42 11% 1.58 1.65 4%<br />
BEV 203 0.56 1.40 2.16 54% 6.28 8.63 37%<br />
MIL 100 4.45 2.78 5.50 98% 9.20 25.94 182%<br />
MIL 101 2.06 1.43 1.87 31% 5.22 6.05 16%<br />
BAK 200 1.20 0.93 1.03 11% 2.53 2.68 6%<br />
KRD 100 0.67 0.71 2.68 277% 4.31 9.14 113%<br />
KRD 101 1.15 2.18 2.98 37% 9.82 12.00 22%<br />
KRD 102 1.64 1.64 2.42 48% 9.67 11.73 21%<br />
KRD 103 2.09 1.02 1.10 8% 3.60 3.75 3%<br />
BER 102 0.89 0.68 0.80 18% 2.74 3.20 17%<br />
MAN 102 0.75 0.44 0.76 73% 1.75 2.37 35%<br />
SIX 102 1.33 0.82 1.17 43% 3.26 3.93 21%<br />
SIX 103 2.21 0.65 1.04 60% 2.82 3.63 29%<br />
SIX 400 3.40 2.39 2.77 16% 7.71 8.53 11%<br />
March 2008 120 <strong>Fort</strong> <strong>Erie</strong> <strong>Creeks</strong> <strong>Watershed</strong> <strong>Plan</strong><br />
General Report (105116)
Furthermore, the floodplain mapping has been delineated using existing land use mapping, and<br />
has been reviewed for potential flooding for existing residences and/or businesses. A total of<br />
124 structures (houses, outbuildings, culverts, bridges, and roads) have been identified as<br />
potential damage centres or flood vulnerable areas, where existing structures are situated within<br />
the 100 year (Regulatory) floodplain (ref. Drawing 1):<br />
A complete listing of all structures identified is shown in Table 4.1.6.<br />
March 2008 121 <strong>Fort</strong> <strong>Erie</strong> <strong>Creeks</strong> <strong>Watershed</strong> <strong>Plan</strong><br />
General Report (105116)
<strong>Watershed</strong><br />
Damage<br />
Location<br />
NPCA<br />
Floodline<br />
Map<br />
Location<br />
TABLE 4.1.6:<br />
FORT ERIE CREEKS WATERSHED PLAN<br />
POTENTIAL 100 YEAR FLOOD DAMAGE LOCATIONS<br />
Infrastructure Flooded:<br />
Structures<br />
Infrastructure Flooded: Culverts,<br />
Roads<br />
Flood Frequency<br />
Existing 100 Yr Flood<br />
Depth (m)<br />
BLK 1 1 West side of Creek at Switch Rd. 3 Structures 100 0.1 - 1.0<br />
BLK 2 1,2 East side of Creek at Switch Rd. 17 Structures Switch Road 25-100 0.1 - 1.0<br />
BLK 3 2 Glenny Drain 3 Structures 100
4.1.3 Erosion<br />
As part of the geomorphological investigation, field reconnaissance of the main channels within<br />
the study area was completed. During the field reconnaissance, both the RSAT and RGA<br />
assessment tools were used to evaluate the quality and relative stability of each reach for each<br />
creek. The RSAT and RGA scores were tabulated and linked to their qualitative ranking and<br />
compiled (ref. Appendix ‘WC-A’). This data was then used to identify the most sensitive or<br />
unstable reaches in the Town of <strong>Erie</strong> study area and used to prioritize restoration efforts. During<br />
this assessment, erosion areas were mapped and photographed (ref. Appendix ‘WC-A’).<br />
Overall, there were minor amounts of erosion visible throughout the study area. However, there<br />
were a few significant areas of erosion. The prominent areas of erosion that were found within<br />
the study area were on Black Creek and Beaver Creek. Reaches BLC-11 to BLC-15 on Black<br />
Creek exhibited crib wall failure, trampled banks due to farm animals and general basal scour<br />
erosion, due to lack of riparian zones or due to wood debris jams. The upper reaches on Beaver<br />
Creek also showed significant basal scour erosion and bedrock exposure (BVC-14).<br />
There were several other localized sites that were affected by bank and bed erosion. Reach<br />
FRC-9 on Frenchman’s Creek exhibited severe bank erosion and bed incision (i.e. exposed<br />
bedrock throughout the site) because of the channel setting and the flash floods that it receives<br />
from upstream sources. Reach MLC-7 on Miller Creek had severe basal scour erosion and a<br />
watermain was situated well above the channel bed (ref. Appendix ‘WC-A’). In several sections<br />
of Kraft Drain there was significant bank scour due to large debris jams. There was also a large<br />
knickpoint found on Reach KFD-4, indicating that the channel flow was constrained. The first<br />
figure, “Reaches Exhibiting Significant Erosion in <strong>Fort</strong> <strong>Erie</strong>”, in Appendix ‘WC-B’, illustrates<br />
the location of the erosion areas.<br />
Monitoring Analysis<br />
Generally, all stable creek systems erode (e.g., eroding banks, bed scour). Erosion is a natural<br />
process that helps deliver sediment to the system. Sediment supply, transport, and deposition is<br />
necessary to help the creek system dissipate stream energy and maintain a balance between flow<br />
and channel form. However, when this process is disturbed, channel erosion and other<br />
geomorphic processes are augmented. Therefore the channel is in adjustment. In order to<br />
measure the rate of erosion and understand the geomorphic processes occurring in the <strong>Fort</strong> <strong>Erie</strong><br />
study area, a monitoring program was established. This consisted of the establishment of<br />
permanent channel cross-sections sampling sites and erosion pins to measure the rate of<br />
adjustment.<br />
In order to monitor changes taking place in the channels, one monitoring cross-section was<br />
established at each of the sites where detailed field work was completed and one on Beaver<br />
Creek. Each of the monitoring sites was resurveyed on June 22, 2006 and the cross-sectional<br />
area was overlain onto the original November/December, 2005 plot (ref. Appendix ‘WC-C’).<br />
The overlay provides a visual representation of what, if any, changes have occurred between the<br />
monitoring dates. Although a comparison of 2005 and 2006 transects provides an indication of<br />
channel change that has occurred between these dates, it is important to recognize that they do<br />
March 2008 123 <strong>Fort</strong> <strong>Erie</strong> <strong>Creeks</strong> <strong>Watershed</strong> <strong>Plan</strong><br />
General Report (105116)
not necessarily reflect absolute change. That is, scour and fill processes will cause an intraannual<br />
variation of bed elevations within alluvial channels.<br />
The overlay figures in Appendix ‘WC-C’ show that, overall, there has been some change in<br />
cross-sectional configuration. Frenchman’s Creek, Miller Creek and Black Creek have<br />
experienced minor bed scour and bank erosion was prominent for Black Creek and Frenchman’s<br />
Creek.<br />
There was minimal to no change in cross-sectional shape for Six Mile Creek. Aggradation was<br />
observed at the centre of the channel and on the left bank for Beaver Creek.<br />
Erosion pins provide information regarding rates of bank erosion. Bank erosion rates are a<br />
product of channel migration and channel widening. Erosion pins were installed along the length<br />
of each detailed field site in combination with the control cross-sections (ref.<br />
Appendix ‘WC-C’). The exposed length of erosion pins was measured once during the study<br />
period after their installation. Appendix ‘WC-C’ displays the annual rate of change (in meters)<br />
of each of the erosion pins.<br />
The highest rates of erosion were occurring within Frenchman’s Creek and Beaver Creek. Three<br />
erosion pins were installed within Bridgewater’s Golf Course on Frenchman’s Creek. Two out of<br />
the three erosion pins had an erosion rate of 0.10 m/yr. The third erosion pin was a control pin;<br />
therefore, it exhibited no net change. The large erosion rates for the reach located in Bridgewater<br />
Golf Course may be indicative of the surrounding land use. Typically in a golf course, the<br />
vegetative buffer zone is small, therefore there is not enough root structure support to hold the<br />
banks together. However, the vegetative buffer zone within this golf club is well established,<br />
therefore a better explanation of the erosion occurring within this reach is due to events<br />
occurring upstream of this reach.<br />
The large change in cross-sectional area and erosion pin results for Beaver Creek is indicative of<br />
the general setting. Reach BVC-2 is a marsh area that is always fluctuating.<br />
There was very little change in erosion pins for Six Mile Creek as confirmed by the no net<br />
change in cross-sectional shape. For Black Creek and Miller Creek, there was minor erosion for<br />
each of the banks.<br />
Erosion Thresholds<br />
Erosion thresholds were determined at each of the sites where detailed field work was<br />
completed. Erosion thresholds determine the magnitude of flows required to potentially erode<br />
and transport sediment. Therefore, these thresholds provide acceptable limits that prevent an<br />
increase in channel erosion and deposition beyond the natural rates. These results have been<br />
applied to assist with determining recommended locations for stormwater management within<br />
the <strong>Fort</strong> <strong>Erie</strong> area (ref. Section 5).<br />
The collection of detailed field information was pertinent to modeling erosion thresholds. The<br />
calculations performed to determine critical discharge for bed materials were based on formulas<br />
for critical shear stress. Critical discharge is the minimum amount of discharge required to erode<br />
March 2008 124 <strong>Fort</strong> <strong>Erie</strong> <strong>Creeks</strong> <strong>Watershed</strong> <strong>Plan</strong><br />
General Report (105116)
the channel bed and banks. Selection of appropriate thresholds was, in part, dictated by<br />
indicators of active processes (e.g. widening or entrenchment), and channel substrate.<br />
For Black Creek, Miller’s Creek, and Six Mile Creek, shear stress equations for cohesive<br />
materials were applied to the bed material (Chow, 1959). For, Frenchman’s Creek shear stress<br />
equations for non-cohesive materials were used (Fischenich, 2001). The erosion thresholds were<br />
based on the threshold for the D50 (median grain size), which is the general practice. These<br />
thresholds were based on tables provided in Chow (1959) and Fischenich (2001).<br />
As many of the models are based on a simplified cross-sectional geometry, several channel<br />
cross-sections were extracted from each detailed site for threshold analysis. The depth and the<br />
corresponding simplified geometry were used to produce a meaningful threshold. In all cases, a<br />
comparison between the flow competence and bankfull velocity indicates that the bed is fully<br />
mobilized around bankfull flows. This implies that sediment can be entrained below bankfull<br />
flows and that any increase in discharge within these systems will lead to increased transport and<br />
would likely exacerbate channel erosion. Table 4.1.7 provides both bankfull characteristics and<br />
erosion threshold parameters.<br />
TABLE 4.1.7:<br />
CHANNEL THRESHOLDS FOR EACH OF THE DETAILED SITES ASSESSED WITH THE STUDY AREA.<br />
Six Mile Millers<br />
Parameter<br />
Black Creek<br />
Frenchmen’s Bay<br />
Creek Creek<br />
Average Bankfull Width (m) 16.10 17.23 5.60 6.11<br />
Average Bankfull Depth (m) 0.90 0.75 0.52 0.42<br />
Bankfull Gradient (%) 0.18 0.27 0.35 0.27<br />
Bed Material D50 (mm) 0.0048 0.0043 0.047 7.76<br />
Bed Material D84 (mm) 7.8 15.8 11.3 67.6<br />
Manning’s n at Bankfull 0.022 0.025 0.025 0.035<br />
Average Bankfull Velocity (ms-1) 1.79 1.71 1.51 0.83<br />
Average Bankfull Discharge (m3s-1) 13.30 14.39 9.81 2.03<br />
Flow competence (ms-1) @ D50 0.017 0.016 0.048 0.507<br />
Flow competence (ms-1) @ D84 0.508 0.703 0.603 1.37<br />
Tractive Force at Bankfull (Nm-2) 15.89 19.93 17.68 11.04<br />
Critical Shear (Nm-2) (D84) 5.68 11.51 8.23 5.89<br />
Stream Power per Unit Width (Wm-2) 30.30 36.92 30.62 9.11<br />
Critical Velocity (ms-1) 0.62 0.55 0.52 0.25<br />
Critical Depth (m) 0.43 0.30 0.24 0.22<br />
Critical Flow (m3s-1) 2.27 1.06 0.40 0.19<br />
Method Chow (1959) Chow (1959)<br />
Chow<br />
(1959)<br />
Fischenich (2001)<br />
The erosion thresholds are required to assess the impact of development on the watercourse<br />
systems.<br />
An inventory of the reaches has been prepared to identify which reaches are nearing or above the<br />
erosion threshold. Any increase in peak flow or duration of the runoff hydrograph could<br />
March 2008 125 <strong>Fort</strong> <strong>Erie</strong> <strong>Creeks</strong> <strong>Watershed</strong> <strong>Plan</strong><br />
General Report (105116)
potentially increase the erosion in these reaches. These reaches have been identified for<br />
protection (ref. Drawing 1) and future detailed erosion study.<br />
The most erosion-prone reaches have been identified on Drawing 1. Several of the reaches are<br />
located downstream of existing and proposed development. Erosion control targets for new<br />
development can be determined by integrating the hydrology, hydraulics and stream morphology<br />
assessments, in future stages of supporting studies for development.<br />
Meander Belt Widths<br />
A meander belt width defines the area that a watercourse currently occupies or can be expected<br />
to occupy in the future. Meander belt width delineation is commonly used as a planning tool in<br />
order to protect private property and structures from erosion due to fluvial action or geotechnical<br />
instability (Parish Geomorphic Ltd., 2001a). Within a subwatershed context, studies require the<br />
general identification of meander belt widths to facilitate the planning process (ref. Appendix<br />
‘WC-D’).<br />
For the purposes of this study, meander belt widths were measured using digital mapping. The<br />
belt widths are approximate values and should be subjected to refinement during the secondary<br />
planning stage. For unconfined channels, limits of the meander belt are defined by parallel lines<br />
drawn tangential to the outside bends of the laterally extreme meanders of the planform for each<br />
reach. Several channels within the study area were straightened; therefore, a surrogate method<br />
was used to define the meander belt width. The surrogate method was developed by Parish<br />
Geomorphic Ltd., for Toronto Region <strong>Conservation</strong> (Parish Geomorphic Ltd., 2001a) and the<br />
Province of Ontario’s natural channel initiative program in support of the technical requirements<br />
of the Provincial Policy Statement. The policy states when there is no historical evidence of the<br />
natural planform configuration for the altered channel, then it is appropriate to estimate the<br />
meander belt width for the study area in another manner. Specifically, if the adjoining<br />
downstream reach is characterized by the same controls and modifying influences of planform as<br />
the altered study reach, then the planform of the downstream reach can be assumed to represent<br />
the planform of the previously altered channel. This method was applied for the following<br />
reaches: BLC-21, BLC-25, BLC-28, BLC-ST-10, BLC-ST-12, BVC-3, SMC-9, BBD-1,<br />
MND-1, MND-5, MLC-2, HWB-1 and FRC-10.<br />
Table 1 and the Meander Belt Width figure in Appendix ‘WC-D’, display the belt widths for the<br />
assessed reaches in each of the watersheds. Generally, the belt widths for the study area<br />
increased in the downstream direction as streams widened and increased their sinuosity, creating<br />
better-developed flood plains and increasing sediment storage.<br />
4.2 Water Quality<br />
A mass balance model has been developed in order to determine the impacts to water quality<br />
which would result from the proposed future development. This model has been based upon a<br />
spreadsheet analytical technique in order to obtain an estimate of annual loading from non-point<br />
sources for selected water quality parameters. While this information provides utility as a<br />
comparative tool for assessing impacts to in-stream water quality, which would be associated<br />
with proposed development and land use changes, the analyses are intended to provide a<br />
March 2008 126 <strong>Fort</strong> <strong>Erie</strong> <strong>Creeks</strong> <strong>Watershed</strong> <strong>Plan</strong><br />
General Report (105116)
planning level estimate of the various pollutants and their sources. Instream concentrations and<br />
lethal levels of toxicity are not determined as part of this process.<br />
The pollutants which have been evaluated has been based upon the following general and typical<br />
water quality indicators:<br />
• Total Phosphorus<br />
• Total Nitrogen<br />
• Fecal Coliforms<br />
• Total Suspended Solids<br />
• Copper<br />
The analytical approach is based upon the Event Mean Concentration (EMC) for each<br />
constituent and land use category. Typical annual rainfall values for the geographic area are<br />
combined with runoff coefficients based upon the prevailing soil types in order to obtain annual<br />
runoff volumes. The contaminant loading for existing land use has been summarized in<br />
Table 4.2.1 and for future land use without stormwater management has been compiled in<br />
Table 4.2.2. The results (ref. Table 4.2.3) indicate an increase in pollutant loading due to<br />
increased imperviousness (ref. Appendix ‘SW-C’, for details).<br />
TABLE: 4.2.1:<br />
SUMMARY OF ANNUAL CONTAMINANT LOADING (KG) 1<br />
EXISTING LAND USE<br />
<strong>Watershed</strong> F.Col 2 TP TSS Cu TKN<br />
Black Creek 1.13E+11 7.12E-01 5.63E+02 1.51E-02 7.12E-01<br />
Beaver Creek 1.46E+11 7.22E-01 5.57E+02 1.96E-02 7.22E-01<br />
Miller Creek 6.28E+10 5.89E-01 4.83E+02 9.12E-03 5.89E-01<br />
Baker Creek 4.65E+10 2.75E-01 2.40E+02 1.11E-02 2.75E-01<br />
Kraft Drain 1.92E+11 4.81E-01 3.82E+02 4.03E-02 4.81E-01<br />
Bertie Bay Drain / Hollister Drain 5.08E+11 1.08E+00 7.08E+02 8.98E-02 1.08E+00<br />
Six Mile Creek 2.86E+11 6.79E-01 4.69E+02 4.05E-02 6.79E-01<br />
<strong>Niagara</strong> River # 16 2.11E+11 7.01E-01 5.13E+02 2.89E-02 7.01E-01<br />
<strong>Niagara</strong> River # 19 1.89E+11 4.75E-01 3.42E+02 2.86E-02 4.75E-01<br />
<strong>Niagara</strong> River # 20 6.45E+11 8.03E-01 4.18E+02 8.89E-02 8.03E-01<br />
<strong>Niagara</strong> River # 21 2.52E+11 4.04E-01 2.60E+02 3.85E-02 4.04E-01<br />
<strong>Niagara</strong> River # 22 3.31E+11 4.84E-01 2.92E+02 4.86E-02 4.84E-01<br />
<strong>Fort</strong> <strong>Erie</strong> 1.34E+12 1.63E+00 8.21E+02 1.83E-01 1.63E+00<br />
Lake Shore 1.20E+12 1.46E+00 7.48E+02 1.64E-01 1.46E+00<br />
Lake <strong>Erie</strong> 3.31E+11 4.84E-01 2.92E+02 4.86E-02 4.84E-01<br />
1 Annual Contaminant Loading values have been determined using the tables located in Appendix ‘SW-C’<br />
2 Fecal Coliform Annual Contaminant Loading is specified in Counts/Yr<br />
March 2008 127 <strong>Fort</strong> <strong>Erie</strong> <strong>Creeks</strong> <strong>Watershed</strong> <strong>Plan</strong><br />
General Report (105116)
TABLE 4.22:<br />
SUMMARY OF ANNUAL CONTAMINANT LOADING (KG) 1<br />
FUTURE LAND USE<br />
<strong>Watershed</strong> F.Col 2 TP TSS Cu TKN<br />
Black Creek 1.19E+11 7.17E-01 5.62E+02 1.56E-02 7.17E-01<br />
Beaver Creek 1.72E+11 7.86E-01 5.98E+02 2.55E-02 7.86E-01<br />
Miller Creek 1.22E+11 6.99E-01 5.43E+02 3.08E-02 6.99E-01<br />
Baker Creek 5.99E+10 5.07E-01 4.17E+02 9.41E-03 5.07E-01<br />
Kraft Drain 5.67E+11 7.50E-01 4.15E+02 8.00E-02 7.50E-01<br />
Bertie Bay Drain / Hollister Drain 6.48E+11 1.17E+00 7.21E+02 1.12E-01 1.17E+00<br />
Six Mile Creek F.E. 3.84E+11 1.14E+00 8.01E+02 8.60E-02 1.14E+00<br />
<strong>Niagara</strong> River # 16 7.91E+11 1.35E+00 8.14E+02 1.06E-01 1.35E+00<br />
<strong>Niagara</strong> River # 19 1.68E+11 9.72E-01 7.57E+02 6.97E-02 9.72E-01<br />
<strong>Niagara</strong> River # 20 6.45E+11 8.03E-01 4.18E+02 8.89E-02 8.03E-01<br />
<strong>Niagara</strong> River # 21 5.14E+11 1.10E+00 7.15E+02 6.79E-02 1.10E+00<br />
<strong>Niagara</strong> River # 22 3.40E+11 5.80E-01 3.61E+02 5.57E-02 5.80E-01<br />
<strong>Fort</strong> <strong>Erie</strong> 1.34E+12 1.63E+00 8.21E+02 1.83E-01 1.63E+00<br />
Lake Shore 1.19E+12 1.45E+00 7.32E+02 1.63E-01 1.45E+00<br />
Lake <strong>Erie</strong> 3.87E+11 1.04E+00 7.23E+02 8.81E-02 1.04E+00<br />
1 Annual Contaminant Loading values have been determined using the tables located in Appendix ‘SW-C’<br />
2 Fecal Coliform Annual Contaminant Loading is specified in Counts/Yr<br />
TABLE 4.2.3:<br />
% INCREASE IN ANNUAL CONTAMINANT LOADING DUE TO PLANNED LAND USE CHANGES<br />
<strong>Watershed</strong> F.Col 1 TP TSS Cu TKN<br />
Black Creek 6% 1% 0% 3% 1%<br />
Beaver Creek 18% 9% 7% 30% 9%<br />
Miller Creek 94% 19% 12% 237% 19%<br />
Baker Creek 29% 85% 74% -15% 85%<br />
Kraft Drain 196% 56% 8% 98% 56%<br />
Bertie Bay Drain / Hollister Drain 28% 8% 2% 24% 8%<br />
Six Mile Creek F.E. 34% 67% 71% 112% 67%<br />
<strong>Niagara</strong> River # 16 274% 93% 59% 267% 93%<br />
<strong>Niagara</strong> River # 19 -11% 105% 121% 144% 105%<br />
<strong>Niagara</strong> River # 20 0% 0% 0% 0% 0%<br />
<strong>Niagara</strong> River # 21 104% 172% 175% 76% 172%<br />
<strong>Niagara</strong> River # 22 3% 20% 24% 15% 20%<br />
1 Fecal Coliform Annual Contaminant Loading is specified in Counts/Yr<br />
The results suggest that even a small alteration in urbanization could significantly increase the<br />
contaminant loadings, without proper stormwater management.<br />
4.3 Terrestrial Natural Heritage System<br />
Impacts on terrestrial natural are discussed both for direct losses to development if the <strong>Fort</strong> <strong>Erie</strong><br />
Official <strong>Plan</strong> is fully implemented and for the effects of other current and projected human<br />
influences on natural area and function.<br />
March 2008 128 <strong>Fort</strong> <strong>Erie</strong> <strong>Creeks</strong> <strong>Watershed</strong> <strong>Plan</strong><br />
General Report (105116)
A comparison of the <strong>Fort</strong> <strong>Erie</strong> Official <strong>Plan</strong> designations with the location of provincially,<br />
regionally and locally significant natural areas (LSA’s) (ref. Figure NH 5) provided an indication<br />
of the potential direct impact of development on significant natural areas.<br />
Provincial (Environmental Protection Areas or EPA’s) and regional significance ratings<br />
(Environmental <strong>Conservation</strong> Areas or ECA’s) are as designated by the Regional Municipality of<br />
<strong>Niagara</strong> (December, 2005); local significance is as designated by the <strong>Fort</strong> <strong>Erie</strong> Natural Areas<br />
Inventory (Dougan and Assoc., 2003) and applied to the Settlement Area only.<br />
The results are presented by subwatershed in Table 4.3.1. For the Regional ECA category, the<br />
table distinguishes those areas protected by <strong>Fort</strong> <strong>Erie</strong>’s ECA designation and policy that requires<br />
an assessment to ensure lack of major impact. All LSA’s have been subject to more study than<br />
the ECA’s; any development in or adjacent to an LSA requires an Environmental Impact Study<br />
that demonstrates lack of impact on the LSA’s identified features and functions. The comparison<br />
was at a regional analysis scale rather than at the site level; the complexity of the OP digital<br />
layers restricted analysis to a qualitative visual review of the overlay.<br />
The Town of <strong>Fort</strong> <strong>Erie</strong> Official <strong>Plan</strong> protects almost all of the significant natural areas either<br />
completely in the case of Environmental Protection Areas or, for Environmental <strong>Conservation</strong><br />
Areas and Locally Significant Areas, by a requirement for an Environmental Impact Statement.<br />
It should be noted that ECA’s (including LSA’s) identified in the Town of <strong>Fort</strong> <strong>Erie</strong> or Regional<br />
Municipality of <strong>Niagara</strong> are not completely protected features. Development may be permitted,<br />
provided the required expectations are met. In general, the amount of development allowed will<br />
depend on the significance of the feature, its makeup of features and functions, and on the<br />
magnitude of development. Some intrusion may be allowed, through justification with the EIS<br />
process, if the impacts are judged to be low enough. The EIS process remains a form of<br />
protection of the features and functions, while allowing the boundary to be finalized.<br />
In summary:<br />
• Provincially significant areas (Environmental Protection Areas on the Regional OP) are<br />
all designated protected except for a few very small parcels. In total area, the Town’s<br />
Environmental Protection designation currently covers more area than the Region’s, due<br />
in part to the fact that the Town placed 15 m either side of the Black, Beaver, Baker,<br />
Miller, Frenchman’s, Kraft, and Six Mile watercourses to allow for the 100 year<br />
floodplain (the Town now has the final floodplain areas incorporated in their Official<br />
<strong>Plan</strong>). Also, the Region’s Official <strong>Plan</strong> does not have the recently generated floodlines.<br />
• Almost all Regionally significant areas (Environmental <strong>Conservation</strong> Areas in the<br />
Regional OP) are classified as Environmental <strong>Conservation</strong> in the <strong>Fort</strong> <strong>Erie</strong> OP and of<br />
these almost all are within non-development zones (i.e. Agriculture, Rural, Open Space).<br />
Several of the areas not classified ECA by the Town are also in non-development zones.<br />
A few ECA’s are in development zones (i.e. Urban or Rural Residential, Commercial<br />
Industrial-Business Park, Extractive, Institutional) where proposals will trigger an<br />
assessment to document impacts.<br />
• The Locally Significant Areas are protected either completely if under Environmental<br />
Protection Area designation or will trigger an Environmental Impact Study requirement.<br />
March 2008 129 <strong>Fort</strong> <strong>Erie</strong> <strong>Creeks</strong> <strong>Watershed</strong> <strong>Plan</strong><br />
General Report (105116)
Several Special Policy Areas include significant natural areas but also require their protection by<br />
meeting Natural Heritage policies.<br />
The relatively large area of Regional Environmental <strong>Conservation</strong> Area zoned Open Space in the<br />
<strong>Niagara</strong> River Shore, south-east of the mouth of Miller Creek is also part of the important<br />
<strong>Niagara</strong> River corridor. The retention of natural cover would help maintain its role in that<br />
corridor.<br />
Most of the <strong>Fort</strong> <strong>Erie</strong> Official <strong>Plan</strong>’s proposed relatively small urban infill incursions into the<br />
Region’s Environmental <strong>Conservation</strong> Areas are likely suggested as appropriate trade-offs to<br />
encourage infill and to retain the larger, more important, natural areas.<br />
Future development is rated of Low to Moderate concern, assuming full compliance with <strong>Fort</strong><br />
<strong>Erie</strong> and the Regional Municipality of <strong>Niagara</strong>’s Official <strong>Plan</strong>s.<br />
The analysis is qualitative and regional, using regional data. Wetland revisions are on-going<br />
(Dave Heyworth, pers. comm.). Precise, up-to-date area figures would require use of the most<br />
recent and detailed data.<br />
The Port Colborne Draft Official <strong>Plan</strong> shows no development planned for the study area with the<br />
exception of the hamlet of Sherkston. There the hamlet designation abuts a Regionallydesignated<br />
Environmental Protection Area (provincial significance). Adequate buffers and<br />
application of Regional environmental policies would help mitigate possible effects.<br />
Factors affecting natural areas extend beyond direct loss from development. Issues affecting the<br />
ecological functioning of natural areas can be classified by:<br />
a) those related to the location, features, functioning and form of the natural areas<br />
themselves;<br />
b) others that result from effects of nearby or upstream land uses; and<br />
c) those that result from broader–scale influences.<br />
Table 4.3.2 presents contributing factors for each of the three human influence classes. For each<br />
factor, the table outlines its cause, mitigation options, effects on natural area and biodiversity and<br />
effects on natural areas’ ecological services - particularly on natural areas’ water protection roles.<br />
It should be noted that the mitigation listed in Table 4.3.2 should be considered voluntary, and a<br />
stewardship approach that involves the public. It should not be misconstrued as mandatory, and<br />
in being so, interfering with the continuation and expansion of agricultural activities.<br />
The relative severity of the effects is rated. Also rated is the relative spatial extent of the<br />
influencing factor in the study area (none or very localized is Low, throughout but<br />
scattered/limited or extensive in only a small area is Moderate; throughout and extensive is<br />
High). Despite its global scope, climate change is included because its projected impacts on the<br />
hydrological cycle and biota make it a local problem with which conservation authorities and<br />
municipalities must deal (de Loë and Berg, 2006). Consideration of climate change effects will<br />
permit earlier, more effective and more efficient adaptation.<br />
March 2008 130 <strong>Fort</strong> <strong>Erie</strong> <strong>Creeks</strong> <strong>Watershed</strong> <strong>Plan</strong><br />
General Report (105116)
Baker<br />
TABLE 4.3.1:<br />
POTENTIAL INCURSIONS OF FUTURE DEVELOPMENT ON SIGNIFICANT NATURAL AREAS 1 : BROAD-SCALE 2 ANALYSIS BY SUBWATERSHED<br />
Provincially Significant<br />
Natural Areas<br />
With Potential Incursions<br />
According to <strong>Fort</strong> <strong>Erie</strong> OP<br />
An area in proposed golf<br />
course<br />
Regionally Significant Areas<br />
With Potential Incursions According to <strong>Fort</strong> <strong>Erie</strong> OP<br />
But Covered by <strong>Fort</strong> <strong>Erie</strong> OP Environmental<br />
<strong>Conservation</strong> Area Policy<br />
Parts of the proposed golf course (Special Policy Area 5)<br />
Regional Significant Areas Not Protected by <strong>Fort</strong><br />
<strong>Erie</strong> OP Environmental <strong>Conservation</strong> Area Policy<br />
Locally Significant Areas (in Settlement Area)<br />
With Potential Incursions According to <strong>Fort</strong><br />
<strong>Erie</strong> OP<br />
Parts of the proposed golf course (Special Policy<br />
Area 5) and small Open Space area<br />
Parts of the proposed golf course<br />
(Special Policy Area 5)<br />
Small parts along creek valley that are either golf<br />
None<br />
course - Open Space or Agriculture. A very small<br />
area to urban infill. An area on the Miller<br />
subwatershed boundary to Extractive. A few narrow<br />
treed hedgerows<br />
None Some areas to residential – urban and rural A few small areas along lakeshore Some areas to residential- urban and rural<br />
Beaver None Small parts along creek valley that golf course - Open<br />
Space. A very small area to urban infill. A small area on<br />
the Frenchman’s subwatershed boundary to Extractive.<br />
Bertie Bay + L.<br />
<strong>Erie</strong> 1<br />
Black None Areas to Industrial-Business and to Urban and Rural<br />
Residential in Stevensville. Very small area to Urban<br />
Residential in Douglastown<br />
Small areas along creek that Agriculture and in<br />
Douglastown and Stevensville, Open Space or urban<br />
infill<br />
Areas to Industrial-Business and to Urban and<br />
Rural Residential in Stevensville. Very small area<br />
to Urban Residential in Douglastown<br />
<strong>Fort</strong> <strong>Erie</strong> None Small area in industrial-business park and Institutional None Small are to Institutional<br />
Frenchman’s<br />
None<br />
Some areas to residential and Industrial –<br />
Creek<br />
Business Park<br />
Kraft Drain<br />
Several hectares to<br />
Commercial and several to<br />
residential<br />
Very small area to Urban<br />
Residential<br />
Some to Open Space at golf courses, and very small bits<br />
to <strong>Fort</strong> <strong>Erie</strong> Industrial Park (Special Policy Area 3) and<br />
Urban Entertainment Area (Special Policy Area 1). An<br />
area on the Beaver subwatershed boundary to Extractive.<br />
Some areas to Urban Residential and Industrial – Business<br />
Park<br />
Areas to Urban Residential infill and small area to<br />
Commercial<br />
Some to Open Space at golf courses, and very small<br />
bits to <strong>Fort</strong> <strong>Erie</strong> Industrial Park (Special Policy Area<br />
3) and Urban Entertainment Area (Special Policy<br />
Area 1).<br />
Small area to urban infill<br />
Lakeshore<br />
Some area to Urban Residential and a very small area to Small areas to urban infill and Open Space<br />
Commercial<br />
Miller None An area to Industrial-Business Park An area on the Beaver subwatershed boundary to<br />
Extractive<br />
<strong>Niagara</strong> R.<br />
None<br />
A small area to Industrial-Business Park. Possibly a very<br />
Some area to Open Space<br />
Shore<br />
small area in the proposed golf course<br />
Six Mile Creek A few hectares to Rural A few small areas to Urban Residential and Rural<br />
A few very small parcels to Urban infill<br />
Residential and to Urban<br />
Residential<br />
Residential<br />
Area in north end to Commercial. Areas to<br />
residential infill<br />
Some to Urban Residential<br />
An area to Industrial-Business Park (different<br />
one from Regional Significant Area incursion)<br />
None<br />
Some area to Rural Residential, a very small area<br />
to Urban Residential<br />
1. Provincial and Regional significance is as designated by the Regional Municipality of <strong>Niagara</strong>’s Core Natural Heritage Map (2005); Local Significance is as designated by Natural Areas Inventory: Town of<br />
<strong>Fort</strong> <strong>Erie</strong> Settlement Areas (Dougan and Associates, 2003).<br />
2. The overlay was at a regional analysis scale rather than at the site level; the complexity of the OP digital layers restricted analysis to a qualitative visual review of the overlay.<br />
March 2008 131 <strong>Fort</strong> <strong>Erie</strong> <strong>Creeks</strong> <strong>Watershed</strong> <strong>Plan</strong><br />
General Report (105116)
TABLE 4.3.2:<br />
TERRESTRIAL NATURAL HERITAGE ISSUES’ CONTRIBUTING FACTORS: THEIR CAUSES, MITIGATION, SEVERITY, AND EXTENT<br />
Contributing<br />
Factor<br />
Classes<br />
Form and<br />
Function<br />
Contributing<br />
Factors<br />
Difficult<br />
delineation of<br />
wetlands: moving<br />
target for<br />
planners<br />
Cause<br />
Nature of flat landscape &<br />
numerous slough mosaic<br />
wetlands.<br />
Lack of central database for<br />
all agencies<br />
Mitigation<br />
Flag “possible” wetlands - all rural - and treat as ECAs<br />
Target wetland delineation refinements.<br />
Create a central database for NPCA watershed natural<br />
resource planning<br />
Effects on Natural Heritage<br />
Severity H=High<br />
M=Moderate<br />
L=Low<br />
M<br />
Assume most significant<br />
wetlands already evaluated.<br />
More concern in settlement areas<br />
where development more likely<br />
Effects on Ecological Services<br />
Severity H=High<br />
M=Moderate<br />
L=Low<br />
L<br />
All subwatersheds but <strong>Fort</strong> <strong>Erie</strong><br />
have >10% wetland cover<br />
counting only those already<br />
evaluated. <strong>Fort</strong> <strong>Erie</strong><br />
subwatershed has no “possible”<br />
wetland.<br />
Relative<br />
Extent<br />
Throughout<br />
Study Area<br />
H<br />
Fragmented<br />
habitat<br />
Age<br />
representation<br />
skewed to<br />
immature<br />
Original slough<br />
mosaic levelled<br />
away<br />
Altered<br />
watercourses<br />
change natural<br />
drainage<br />
Scattered residential rather<br />
than hamlet-focused<br />
development.<br />
Other intrusive land uses<br />
(e.g., wreckers, industry)<br />
Roads<br />
Soil limitations and poor<br />
agricultural economy with<br />
some land speculation led to<br />
many abandoned areas.<br />
Agriculture requires more<br />
uniform micro-topography<br />
for effective drainage and<br />
crop management. As areas<br />
are abandoned, they retain<br />
the levelled landscape.<br />
Drains are necessary for<br />
viable agriculture on the wet<br />
clay soils. Maintenance is<br />
necessary to avoid flooding.<br />
New roads should try to avoid cutting through natural<br />
areas. If unavoidable, do environmental studies to direct<br />
mitigation.<br />
Discourage development in natural areas in favour of<br />
infill in built-up areas.<br />
Apply <strong>Fort</strong> <strong>Erie</strong> OP<br />
Time + managed disturbance where natural disturbances<br />
are suppressed.<br />
In restoration areas and young shrub areas, create shallow<br />
irregular slough and ridge pattern before planting. <strong>Plan</strong>t<br />
variety of native species appropriate to micro-topography<br />
- by hand but can be low density.<br />
Set hydrologic targets that development must meet<br />
Restore slough pattern avoiding direct drain connection.<br />
In abandoned areas where surface drain system feeding<br />
the municipal drain, block the surface drains and widen<br />
some into closed off wetland sloughs.<br />
Drain naturalization when not harming agriculture.<br />
Investigate feasibility of niche crops adapted to wet soils,<br />
e.g., willow for ethanol<br />
M<br />
Worse in rural areas since urban<br />
already affected by proximity of<br />
development. Urban also should<br />
encourage infill to avoid rural<br />
sprawl.<br />
M<br />
Reduced representation of age<br />
classes within the watershed<br />
tends to create a more<br />
homogeneous system at the<br />
landscape level.<br />
H<br />
Greatly reduces biodiversity by<br />
eliminating micro-habitat<br />
diversity – a major component of<br />
diversity in this landscape.<br />
M<br />
Drains shift communities to drier<br />
ones. This is not severe because<br />
natural sloughs are isolated from<br />
drains and drier, mesic<br />
communities are slightly<br />
underrepresented compared to<br />
original. The drains deliver<br />
sediment & flood peaks to<br />
floodplain wetlands.<br />
L<br />
Minor effect.<br />
L<br />
Helps CO2 uptake though less<br />
aesthetically pleasing<br />
Water protection services (e.g.,<br />
soil stabilization, flood<br />
moderation) are maintained.<br />
H<br />
Greatly reduces the hydrologic<br />
storage capacity of the landscape,<br />
reducing flood moderation and<br />
capacity to improve water<br />
quality. These roles will be even<br />
more important if climate change<br />
brings more extreme storm<br />
events<br />
M<br />
Drains reduce water storage and<br />
contaminant uptake associated<br />
with wetlands and sloughs.<br />
Where the slough mosaic<br />
remains, the effect is less. The<br />
impacts are greater where slough<br />
mosaic is levelled or nonlacustrine<br />
(not part of natural<br />
slough mosaic landform)<br />
H<br />
H<br />
H<br />
M<br />
March 2008 132 <strong>Fort</strong> <strong>Erie</strong> <strong>Creeks</strong> <strong>Watershed</strong> <strong>Plan</strong><br />
General Report (105116)
TABLE 4.3.2:<br />
TERRESTRIAL NATURAL HERITAGE ISSUES’ CONTRIBUTING FACTORS: THEIR CAUSES, MITIGATION, SEVERITY, AND EXTENT<br />
Contributing<br />
Factor<br />
Classes<br />
Contributing<br />
Factors<br />
Lack of riparian<br />
buffer<br />
Broken,<br />
incomplete<br />
habitat corridors<br />
Beaver flooding<br />
inappropriate land<br />
uses<br />
Cause<br />
Landowners maximizing<br />
land area under crops, cattle<br />
access or other land uses to<br />
help economic returns.<br />
Intervening non-natural land<br />
uses.<br />
Lack of a corridor plan for<br />
planners and landowners to<br />
consult.<br />
Unavoidable conflict of<br />
native wildlife and humans.<br />
Flat wet landscape with<br />
some natural area habitat<br />
Mitigation<br />
<strong>Plan</strong>t buffers or allow to regenerate naturally.<br />
Downstream beneficiaries compensate owners<br />
Referral to the proposed corridors when new plans or<br />
restoration opportunities arise.<br />
Manage rail and utility corridors for habitat.<br />
Restore and enhance corridors through open space.<br />
Act as soon as problem appears<br />
Protective material on trees<br />
Beaver baffles at culverts<br />
Consult OMNR for advice.<br />
Effects on Natural Heritage<br />
Severity H=High<br />
M=Moderate<br />
L=Low<br />
M<br />
Riparian buffers can be corridor<br />
linkages and habitat.<br />
M<br />
The relatively high natural area<br />
extent provides some<br />
opportunities for species<br />
migration.<br />
L<br />
Some trees cut but natural<br />
phenomenon<br />
Effects on Ecological Services<br />
Severity H=High<br />
M=Moderate<br />
L=Low<br />
H<br />
Buffers are important for<br />
reducing non-point source<br />
pollution.<br />
L<br />
L<br />
Relative<br />
Extent<br />
Throughout<br />
Study Area<br />
M<br />
M<br />
L<br />
Other Land<br />
Uses<br />
Current urban<br />
development<br />
Spreading<br />
imperviousness<br />
QEW and other<br />
existing roads<br />
Possible future<br />
roads<br />
Agricultural<br />
runoff<br />
Growth in area with good<br />
climate, transportation<br />
access, some farmland<br />
Development adds<br />
impermeable surfaces<br />
Population<br />
Car society<br />
Border location<br />
NAFTA<br />
Population<br />
Car society<br />
Border location<br />
NAFTA<br />
Industrial agriculture<br />
Lack of stream/drain buffers<br />
Nutrient management<br />
problems<br />
Poor farm economy<br />
Clay soil<br />
Retrofit with green roofs, street trees<br />
Develop trail systems<br />
Encourage green roofs, urban trees<br />
Reduce use of road salt, especially in priority areas, using<br />
recommendations of the Region’s Salt Vulnerability<br />
Study now underway<br />
Include rail transit options.<br />
Route to miss natural areas<br />
Consider if expensive gas will reduce need<br />
Better buffers<br />
Higher food prices<br />
Urban financial support for rural water protection<br />
Private land stewardship<br />
M<br />
Removed natural areas but not a<br />
fast urban growth area.<br />
Pets and people alter biota in<br />
nearby natural areas.<br />
H<br />
Alters downstream floodplain<br />
hydrology and habitat conditions<br />
M<br />
Pervasive point source chloride<br />
that affects sensitive biota.<br />
Likely no more than most of<br />
southern Ontario.<br />
Depends on route<br />
H<br />
Over-enriches floodplain & lake<br />
ecosystems, reducing diversity.<br />
Sediment blocks light to aquatic<br />
systems and fills/alters wetlands<br />
M<br />
Removed ecological services but<br />
not a fast urban growth area.<br />
M<br />
Downstream areas still function<br />
but less effectively; removes<br />
functioning of paved areas<br />
L<br />
Blocks some drainage but in<br />
slough mosaic landscape context<br />
not serious<br />
Depends on route<br />
Blocks some drainage but in<br />
slough mosaic landscape context<br />
possibly not serious<br />
M<br />
Reduced wetland quantity and<br />
quality functions as sediment<br />
fills.<br />
Rotting algae deters beach use.<br />
M<br />
L<br />
M<br />
L<br />
M<br />
March 2008 133 <strong>Fort</strong> <strong>Erie</strong> <strong>Creeks</strong> <strong>Watershed</strong> <strong>Plan</strong><br />
General Report (105116)
TABLE 4.3.2:<br />
TERRESTRIAL NATURAL HERITAGE ISSUES’ CONTRIBUTING FACTORS: THEIR CAUSES, MITIGATION, SEVERITY, AND EXTENT<br />
Contributing<br />
Factor<br />
Classes<br />
Broader-Scale<br />
Influences<br />
Contributing<br />
Factors<br />
Lakeshore<br />
development<br />
Golf courses –<br />
new and existing<br />
Potential Leakage<br />
from current/past<br />
Landfills (3),<br />
chemical<br />
plants/foundries<br />
(3), junkyards (6)<br />
Exotic species<br />
and pests and<br />
diseases<br />
Long-range air<br />
pollution<br />
Cause<br />
Prime recreation, cottage &<br />
estate sites close to big<br />
cities.<br />
Improved L. <strong>Erie</strong> water<br />
quality<br />
Land available close to<br />
population centres.<br />
Older demographics.<br />
Old landfills had less<br />
regulation<br />
Accidental releases<br />
Global economy and goods<br />
transport<br />
Releases due to lack of<br />
awareness<br />
Poor regulations and<br />
difficult to enforce<br />
Fossil fuel economy<br />
Downwind of industrial<br />
Ohio River Valley USA<br />
& Nanticoke, ON<br />
Mitigation<br />
Boardwalks, walkway access only & info signs at public<br />
access.<br />
Restoration targeted at large lot owners.<br />
Proactive planning for reduced lake levels & exposed<br />
coastal corridor.<br />
Wind power generation might help pay to protect shore<br />
Ecologically-aware planning to maintain best natural<br />
areas, minimize chemical use and include water retention<br />
areas.<br />
Capture any runoff from landfills<br />
<strong>Plan</strong> for accidents<br />
See Section 3.2<br />
Climate change Fossil fuel economy Promote alternative fuels<br />
Reduce energy use<br />
More local economy<br />
Lack of public<br />
awareness<br />
Lack of access to natural<br />
areas<br />
Lack of outdoor education<br />
Focus on technological<br />
solutions<br />
Lack of sense of place<br />
Public education re issues & identification<br />
Better regulations and enforcement<br />
Promote and use native plants<br />
Work with nurseries to phase out invasives<br />
Locate priority management areas & circulate suitable<br />
action programs<br />
Reduce other stressors to allow system to repel pests<br />
effectively<br />
Promote alternative fuels<br />
Support coal-fired generation plant at Nanticoke<br />
conversion or decommissioning<br />
More options for public access to natural areas<br />
Locally relevant brief accessible info on natural area<br />
values and public’s role<br />
Celebrations for local natural features<br />
Effects on Natural Heritage<br />
Severity H=High<br />
M=Moderate<br />
L=Low<br />
H<br />
Globally rare communities and<br />
endangered Fowlers Toad.<br />
M<br />
Removes some natural areas and<br />
potentially contaminates<br />
remaining on site or adjacent.<br />
Likely L depending on overland<br />
runoff<br />
Clay soils likely good base.<br />
H<br />
Potential to displace native plants<br />
especially in disturbed areas.<br />
Study area is adjacent to border<br />
and Great Lakes<br />
M<br />
Affects some plants<br />
M<br />
Wetlands on flat clay plains<br />
vulnerable<br />
Effects on Ecological Services<br />
Severity H=High<br />
M=Moderate<br />
L=Low<br />
M<br />
Losing possible wind power sites<br />
M<br />
Reshapes land to encourage<br />
drainage<br />
L<br />
L<br />
M<br />
As wetland dries flood storage<br />
capacity remains if wetland not<br />
converted<br />
Relative<br />
Extent<br />
Throughout<br />
Study Area<br />
H H H<br />
M<br />
L<br />
L<br />
H<br />
H<br />
H<br />
March 2008 134 <strong>Fort</strong> <strong>Erie</strong> <strong>Creeks</strong> <strong>Watershed</strong> <strong>Plan</strong><br />
General Report (105116)
Summary<br />
The factors that scored a High severity of effect and a High relative extent were:<br />
• Original slough mosaic levelled and related functions lost,<br />
• Exotic Species (e.g., pests, diseases), and<br />
• Lack of public awareness.<br />
The latter two are very broad level issues not exclusive to the <strong>Fort</strong> <strong>Erie</strong> <strong>Creeks</strong> watershed area.<br />
They do or will, however, affect the watershed significantly. Although obviously requiring<br />
broad-scale response far beyond the study area, local actions can have a major effect on how<br />
well the area improves public awareness and controls exotic species.<br />
Other factors of significant concern (with one High and two Moderate ratings) include:<br />
• Lack of riparian buffers,<br />
• Agricultural runoff<br />
• Lakeshore development, and<br />
• Climate change.<br />
Tables 4.3.3 and 4.3.4 rate each subwatershed’s relative extent for factors with High or Moderate<br />
effect severity. The Lows were not scored because in some cases Low indicated complete<br />
absence of the factor. The <strong>Fort</strong> <strong>Erie</strong> subwatershed was not included since it is has a very low<br />
coverage of natural area. Broader-scale influences were not rated by subwatershed, since all<br />
subwatersheds are affected similarly. The extent of potential issues related to wetland<br />
delineation was based on proportion of settlement area subwatersheds that are forested areas on<br />
100% poorly drained soil but not MNR-evaluated wetlands.<br />
Black Creek subwatershed has both the most issues represented and the most with High extents.<br />
The tables will provide guidance for initial considerations with respect to watershed-specific<br />
mitigation plans.<br />
TABLE 4.3.3:<br />
HIGH SEVERITY NATURAL HERITAGE ISSUES: EXTENT BY SUBWATERSHED<br />
Subwatershed<br />
Levelled Slough Lack of Riparian Spreading Agricultural<br />
Shoreline<br />
Mosaic<br />
Buffers Imperviousness Runoff<br />
Development<br />
Baker H M<br />
Beaver M M M H<br />
Bertie Bay + L. <strong>Erie</strong> 1 H M M<br />
Black H H M H<br />
Frenchman’s M M<br />
Kraft H H M<br />
Lakeshore M M<br />
Miller H H M<br />
<strong>Niagara</strong> R. Shore<br />
M<br />
Six Mile M H M M<br />
March 2008 135 <strong>Fort</strong> <strong>Erie</strong> <strong>Creeks</strong> <strong>Watershed</strong> <strong>Plan</strong><br />
General Report (105116)
Subwatershed<br />
TABLE 4.3.4:<br />
MODERATE SEVERITY NATURAL HERITAGE ISSUES: EXTENT BY SUBWATERSHED<br />
Possible<br />
Artificial<br />
Current<br />
Unevaluated<br />
Immaturity Waterways<br />
Development<br />
Natural Area<br />
Broken<br />
Roads and<br />
Wetlands in<br />
of Natural Changing<br />
Affecting<br />
Fragmentation<br />
Corridors<br />
QEW<br />
Settlement<br />
Areas Natural<br />
Natural<br />
Area<br />
Drainage<br />
Areas<br />
Golf<br />
Courses<br />
Baker M M M M M<br />
Beaver H M M M M<br />
Bertie Bay + L. M M M H M H M<br />
<strong>Erie</strong> 1<br />
Black H H M M H M<br />
Frenchman’s M H M<br />
Kraft M M H M M<br />
Lakeshore H M M H M<br />
Miller<br />
H<br />
<strong>Niagara</strong> R.<br />
M M M M M<br />
Shore<br />
Six Mile M M H H M M<br />
The watershed’s wetlands are possibly among the most vulnerable to climate change in the<br />
Canadian Lake Ontario basin (Snell and Astolfo, 2006). The slough-associated inland wetlands<br />
are maintained by precipitation. Many are already near the wetland-upland threshold, a feature<br />
that contributes to the difficulties in boundary delineation. The level landscape suggests that a<br />
small change in water level will have a broad effect. Predicted increases in evapotranspiration<br />
will tend to dry the sloughs and lower soil water content. Where the slough mosaic remains,<br />
sloughs will retain their flood moderation values but biota will suffer stress. Drier conditions<br />
may also result in more clay fracturing and local groundwater recharge, boosting the value of<br />
terrestrial ecosystems for contaminant filtering prior to recharge. More extreme storms and<br />
droughts will stress floodplain wetlands both with highly variable water volumes and with extra<br />
sediment, as diffuse source erosion increases (Bruce, Dickinson and Lean, 2006). Declining lake<br />
levels would dry out backwaters and alter coastal habitat. The possibility of a newly exposed<br />
coastal corridor, combined with increased pressures for shoreline recreation to escape urban heat<br />
has major planning implications (Snell, E., L. Mortsch and M. Galloway. 2006).<br />
4.4 Aquatic Resources<br />
The key processes/functions/characteristics of watercourses, which influence their biota, are<br />
baseflow, hydrology, channel form, water temperature, water chemistry, riparian vegetation, and<br />
barriers to fish movement and migration. The overall impact on aquatic resources is determined<br />
by the cumulative effects of impacts on those factors.<br />
The relatively flat topography of the study area, with elevations near that of the surrounding<br />
<strong>Niagara</strong> River and Lake <strong>Erie</strong> water levels, has resulted in generally slow-flowing watercourses<br />
with few barriers to fish migration. As a consequence of the low gradients and the fine-grained<br />
soils, dominated by silt and clay, within the study area, the watercourses rarely contain coarser<br />
substrates, such as cobble or gravel. There is little groundwater discharge within the study area,<br />
with the result that flow rates are low, except as a consequence of precipitation events or<br />
snowmelt. The similarity in watercourse attributes, imposed by the landscape, is striking. Most<br />
of the variation in aquatic habitat observed within the study area is a function of whether water is<br />
present throughout the year or seasonally, stream size (width and depth), riparian and instream<br />
vegetation, and the degree to which the watercourses have been altered by past attempts to<br />
March 2008 136 <strong>Fort</strong> <strong>Erie</strong> <strong>Creeks</strong> <strong>Watershed</strong> <strong>Plan</strong><br />
General Report (105116)
maximize available agricultural land. The assessment of impacts, and the determination of<br />
appropriate mitigation measures, is limited to this reduced set of environmental variables<br />
(i.e. presence of flow, stream size, riparian vegetation and historical impacts), in conjunction<br />
with the local aquatic community.<br />
4.5 Watercourse Systems<br />
The following is a detailed account of the geomorphic processes that have been documented for<br />
the respective fluvial systems occurring within the subwatersheds (ref. Figure ‘WS-2’ for reach<br />
locations).<br />
Miller Creek<br />
The headwaters for Miller Creek originate south of Petit Road and extend north, flowing into the<br />
<strong>Niagara</strong> River. The majority of the watercourse was situated in a very thick deciduous forest<br />
with shrub buffers. However, there were a small number of residential homes backing on to the<br />
creek in the downstream section closest to the <strong>Niagara</strong> Parkway.<br />
Large portions of Miller Creek contained substantial amounts of in-stream emergent plant<br />
species and tall grasses. Channel bed substrate consisted of a combination of silt and<br />
unconsolidated clay material creating a very mucky environment. At the time of the assessment,<br />
water flow was minimal, however indication of high and stagnant water levels were noted as a<br />
major impact in much of the area.<br />
General geomorphic assessments revealed extensive signs of planimetric form adjustment,<br />
channel widening, and aggradation. The bankfull widths varied from 1.5 m – 5 m and the<br />
bankfull width varied from 0.3 m – 0.8 m. The channel was relatively well-defined and lacked<br />
any bed morphology. The low-lying topography resulted in several chute formations of the<br />
floodplain.<br />
Topography, combined with clay substrate, were the most significant factors affecting Miller<br />
Creek. Low gradients and slow drainage contributed to wide-spread flooding. Woody areas<br />
created many obstructive organic debris jams which in turn, hindered channel flow. As a result,<br />
much of Miller Creek lacks bank definition and is considered to have limited channel stability.<br />
Beaver Creek<br />
Through a desktop analysis, twenty-six reaches were delineated within the Beaver Creek<br />
subwatershed area. The headwaters originate south of Michener Road in Ridgeway and extend<br />
north to confluence with Black Creek at the Queen Elizabeth Highway. Generally, the channel<br />
bankfull widths ranged from 1 m to 5 m however, as it flowed north to the confluence with Black<br />
Creek, the channel width was greater than 20 m.<br />
The riparian buffers generally consisted of thick shrubs, tall grasses, and herbaceous species;<br />
however, there were areas where the riparian zone consisted of manicured lawn up to the waters<br />
edge (i.e. Ridgeway and at I.C.C. Golf and Country Club). The dominant surrounding land use<br />
was agricultural, with pockets of residential and recreational areas.<br />
March 2008 137 <strong>Fort</strong> <strong>Erie</strong> <strong>Creeks</strong> <strong>Watershed</strong> <strong>Plan</strong><br />
General Report (105116)
Similar to other <strong>Fort</strong> <strong>Erie</strong> <strong>Creeks</strong>, this watercourse was significantly affected by the low-lying<br />
topography and geology of the area. The upstream portions were characterized by poor bank<br />
definition, low bed relief, multiple thread channels, clay/silt bed material, major channel<br />
widening and aggradation. Basal scour was the predominant form of erosion evident in the<br />
Beaver Creek subwatershed. In Reach BVC-14, exposed parent bedrock was found. As a result<br />
of topography and geology, large areas experience massive flooding and water logging which<br />
contribute to an increased accumulation of woody debris that inadvertently obstructs flow<br />
patterns creating large marsh environments.<br />
Black Creek<br />
Black Creek was the longest and most heterogeneous watercourse found in the <strong>Fort</strong> <strong>Erie</strong><br />
watershed. This watercourse contains a north and south tributary that confluences with the main<br />
stem in the Stevensville area. In total, there were forty-nine reaches delineated in the Black<br />
Creek subwatershed system. The main stem originates in the south-eastern portion of <strong>Fort</strong> <strong>Erie</strong>,<br />
close to Halloway Bay Road, and extends north to the confluence with the <strong>Niagara</strong> River. The<br />
north tributary begins south of Netherby Road and east of House Road. South tributary branches<br />
generally begin in the Stevensville Road and Bowen Road area. Surrounding land use, for the<br />
most part, was agricultural, yet there were some areas of residential zoning located in<br />
Stevensville, Douglastown, and Black Creek.<br />
North and South Tributaries<br />
The north tributary differed greatly from the southern tributary in that it predominantly flowed<br />
through agricultural land with thick cut-grass (sp. Leersia) located both in-stream and as a<br />
riparian buffer. The south tributary was similar to various other areas within the <strong>Fort</strong> <strong>Erie</strong> area<br />
which consisted of low-lying topography, wide-spread marsh and saturated floodplain, and poor<br />
bank definition. Within the southern tributary, Reach BLC-ST-9 exhibited significant alteration<br />
due to residential development such as straightening, on-line pool, and water taking. General<br />
geomorphic assessments for both the tributaries revealed signs of planimetric form adjustment,<br />
channel widening, and aggradation, especially closer to the Stevensville area. Reaches located in<br />
the Stevensville area were characterized by several sections of erosion and incision as a result of<br />
fallen trees and large organic and urban debris jams.<br />
Main Black Creek<br />
Much of the main branch of Black Creek was characterized by low-lying topography, abundant<br />
in-stream vegetation, floodplain marsh areas, and poor bank definition. The occurrence of large<br />
organic debris and overbank deposition was frequently observed indicating persistent flooding<br />
and flashy discharge patterns. Comparable to many other areas of <strong>Fort</strong> <strong>Erie</strong>, the topography and<br />
geology played a significant role in bank erosion, drainage, and woody debris jams that were<br />
documented during the geomorphic assessments. Physical channel characteristics varied<br />
gradually as Black Creek flowed towards the <strong>Niagara</strong> River. Similar to Reach BVC-14 of<br />
Beaver Creek, Reach BLC-26 exhibited erosion and channel widening. Areas of exposed<br />
bedrock and major basal scour were observed throughout this reach.<br />
Riparian conditions differed from the upper to the lower sections of the main branch of Black<br />
Creek. The upper section was composed of agricultural zones, with small to absent riparian<br />
March 2008 138 <strong>Fort</strong> <strong>Erie</strong> <strong>Creeks</strong> <strong>Watershed</strong> <strong>Plan</strong><br />
General Report (105116)
uffer zones. Livestock trampling and channel straightening were noted in several agricultural<br />
areas especially in Reach BLC-24 through Reach BLC-30. Further downstream, the riparian<br />
conditions improved with thick shrub and deciduous species. As the channel bankfull width<br />
increased downstream, so did residential development. The channel banks were composed of<br />
manicured lawns and hardened bank structures (i.e. rip-rap).<br />
Frenchman’s Creek<br />
Through desktop analysis, a total of fifteen reaches were determined for this watercourse. The<br />
headwaters of Frenchman’s Creek originate east of Ridgemount Road and north of Bertie Street<br />
(Note that upstream of Sunset Drive, is classified as a Municipal Drain). A large portion of the<br />
watercourse was situated in thick deciduous forest with shrub buffers however, as it flowed<br />
downstream into the urban areas, a reduction in riparian zones was observed resulting in<br />
increased basal erosion (specifically surrounding golf course areas).<br />
The majority of the upstream sections, Reaches FRC-11 to FRC-15, were located in low-lying<br />
topography within mixed deciduous forest. Bankfull widths in this area ranged from 1 m to 6 m.<br />
Throughout the upper reaches of Frenchman’s Creek, large organic debris jams have caused<br />
bank erosion.<br />
The middle portion of Frenchman’s Creek, Reaches FRC-6 to FRC-10, exhibited various impacts<br />
by urban activities such as road realignments, golf course activities, and industrial development.<br />
Channel aggradation and widening were the most significant processes observed in this area.<br />
Large organic and urban debris jams combined with major siltation and lack of bed morphology<br />
were observed in these reaches.<br />
Reaches FRC-4, FRC-5, and FRC-9, were located in the areas of the Bridgewater Golf and<br />
Country Club and the Rio Vista Golf and Country Club. Exposed bedrock, large algae blooms,<br />
basal erosion, exposed irrigation pipes, and aggradation in pool areas were found throughout<br />
these reaches. Runoff from urbanized areas upstream may be one of the reasons that this area<br />
exhibited extensive erosion including the incision of the channel bed into its parent bedrock.<br />
The lower reaches (Reaches FRC-1 to FRC-5) flow through an area with isolated pockets of<br />
residential development and displayed typical geomorphic characteristics of a channel setting.<br />
The bankfull widths were approximately 10 m and the bed substrate was composed of silt and<br />
clay. Due to the typical low-gradient setting, aggradation was pronounced and channel widening<br />
was prominent because of the large organic debris jams.<br />
Six Mile Creek<br />
In general, Six Mile Creek was one of the more stable watercourses assessed in the <strong>Fort</strong> <strong>Erie</strong><br />
region. A total of eleven reaches were defined for this subwatershed with headwaters originating<br />
at Highway #3/Garrison Road and flowing south until reaching Lake <strong>Erie</strong>.<br />
The majority of the channel reaches had low-lying areas, with limited bank definition, and<br />
clay/silt bed material. The dominant geomorphic processes were aggradation and planimetric<br />
adjustment. In Reach SMC-4, close to Dominion Road, an agricultural field was fenced off from<br />
March 2008 139 <strong>Fort</strong> <strong>Erie</strong> <strong>Creeks</strong> <strong>Watershed</strong> <strong>Plan</strong><br />
General Report (105116)
the channel as part of the <strong>Niagara</strong> <strong>Peninsula</strong> <strong>Conservation</strong> Authority initiatives to restore and<br />
preserve area creeks from livestock and other consequences of agricultural activities.<br />
In the downstream section, closest to Lake <strong>Erie</strong>, channel bankfull widths increased and<br />
resembled areas close to the <strong>Niagara</strong> River. Reach SMC-2 and SMC-1 have been straightened at<br />
Thunder Bay Road and few residential properties were observed in this area.<br />
Baker Creek<br />
Baker Creek was the smallest of the watercourses in the <strong>Fort</strong> <strong>Erie</strong> watershed. Located north of<br />
the Queen Elizabeth Highway, this creek travels a short distance before it flows into the <strong>Niagara</strong><br />
River. Only three reaches were delineated within the Baker Creek subwatershed area.<br />
The headwater section was located in a well forested area north of College Road. Reach BKC-3<br />
possessed little bank definition, low gradient, and showed evidence of planimetric form<br />
adjustment. As the channel flowed towards the <strong>Niagara</strong> River, it gained some bank definition<br />
and began to exhibit significant signs of channel widening and aggradation. Similar to other<br />
areas of <strong>Fort</strong> <strong>Erie</strong>, the frequent occurrence of large woody debris jams combined with geology<br />
drastically hindered drainage and flow patterns resulting in large flooded areas (especially noted<br />
in Reach BKC-2). Furthermore, Reach BKC-2 has been significantly impacted by ATV trails<br />
and hydro easement property altering channel thalweg and limiting riparian buffer area.<br />
The remaining area of Baker Creek increases in bankfull width from 1 m to 10 m as it<br />
approaches the <strong>Niagara</strong> River. Reach BKC-1 resembled Miller Creek, in regards to its<br />
backwater setting and residential development. Road culverts at Schweigler Road in BKC-1<br />
were the only form of channel disturbance noted in this section of Baker Creek.<br />
Kraft Drain<br />
Although surrounding land use was residential, the majority of Kraft Drain was located in an<br />
extremely pristine area of <strong>Fort</strong> <strong>Erie</strong>. Channel riparian conditions consisted of thick mixed forest,<br />
shrub, and tall grasses. A general geomorphic assessment of Kraft Drain revealed extensive<br />
signs of channel widening and aggradation, specifically in Reach KFD-3, KFD-2, and KFD-1.<br />
As a result, large sections of Reach KFD-1 were armoured by residential owners in the<br />
immediate area in an effort to increase bank stability. Several areas of exposed tree roots,<br />
leaning and fallen trees, large organic debris jams, and siltation in pools were observed<br />
throughout much of Kraft Drain. Bankfull widths for Reach KFD-1 to KFD-3 ranged between<br />
2 m to 6 m. In Reach KFD-4, the channel bankfull decreased and ranged from 0.25 m to 1 m. In<br />
addition, this reach lacked bank definition and an approximately 1 meter deep knick point was<br />
noted. Reach KFD-5, was significantly straightened from Dominion Road to Nigh Road due to<br />
residential development of that area.<br />
Mann Drain<br />
Mann Drain was the largest of these three drainage systems. Similar to the rest of the <strong>Fort</strong> <strong>Erie</strong><br />
creeks, this system was significantly affected by low-lying topography and characterized by poor<br />
bank definition, low bed relief, and siltation in pools. In Reach MND-1, the <strong>Niagara</strong> <strong>Peninsula</strong><br />
<strong>Conservation</strong> Authority, in conjunction with the Ontario Government, Wetland Habitat Fund,<br />
and the Friends of <strong>Fort</strong> <strong>Erie</strong> <strong>Creeks</strong>, established a Water Quality Improvement Project to restore<br />
March 2008 140 <strong>Fort</strong> <strong>Erie</strong> <strong>Creeks</strong> <strong>Watershed</strong> <strong>Plan</strong><br />
General Report (105116)
stream bank conditions and minimize the effects of livestock activities on watercourses. The<br />
remaining reaches flowed through large floodplain areas and consisted of profuse in-stream<br />
emergent vegetation and multiple thread channels. A general geomorphic assessment of Mann<br />
Drain revealed extensive signs of planimetric form adjustment, aggradation, and some minor<br />
areas of channel widening such as fallen and leaning trees, exposed roots, and organic debris.<br />
Bertie Bay Drain<br />
Bertie Bay Drain was a small watercourse that lacked bank definition as it flowed through thick<br />
mixed deciduous forest. Large areas of flooding were apparent throughout the reaches as a result<br />
of low-lying topography and gradient. In addition, much of the Bertie Bay Drain area was<br />
covered by woody debris indicating wide-spread flooding during increased water flows.<br />
Creek Summary<br />
The main fluvial geomorphological purpose of all watercourses is the efficient movement of<br />
water and sediment through the system. This function entails both conveyance and storage of<br />
sediment and water that is critical to the healthy functioning of the stream. Many of the streams<br />
in <strong>Fort</strong> <strong>Erie</strong> are transitional and are adjusting from one type of stream to another. This explains<br />
the large quantity of poorly defined banks and multiple thread channels found in the watershed.<br />
As a result of topography and geology, large areas are experiencing flooding. This contributes to<br />
increased accumulation of woody debris that inadvertently obstructs flow patterns, thereby<br />
contributing to the transitional and adjustment state of many of the reaches.<br />
Drain Evaluation<br />
Overall, most of the tributaries entering the main channels have been straightened as drains.<br />
Since, straightened reaches do not constitute a natural channel planform; the channel will work<br />
towards regaining a natural planform to ensure that water and sediment are transported<br />
efficiently downstream while minimizing energy expenditure. Natural readjustments of the<br />
channel planform occur through processes such as bank erosion, increasing the sediment load of<br />
the channel (i.e. Miller Creek, Black Creek Drain, Kraft Drain etc). Erosion in straightened<br />
channel reaches can be expected and, indeed, does occur in all watersheds within this study. This<br />
in turn is affecting the natural reaches located within the study area.<br />
As a result of the altered planform, many of the drains within the study area have required<br />
remediation work to alleviate flooding and the accumulation of sediment. For example, in a 1928<br />
report for Mann Drain, recommendations were made for a cleanout of the drain from the outlet<br />
into Six Mile Creek to remove stumps and other debris. In February 2005, there was a clearing<br />
and grubbing of a 12 m path along the Mann Drain, including existing clearing of channel crosssection.<br />
For Frenchman's Creek, throughout the 1990's there was a concern that the drain (the<br />
upper reaches above Sunset Drive) was silting up due to upstream activities. In April 2000, a<br />
clean-up initiative of the drain occurred. For Miller Creek, a report conducted by Blake Erwin<br />
recommended the excavation of the drain and the re-shaping of the side slope to be<br />
1.5 horizontal to 1 vertical to accommodate the flows. For Black Creek Drain, an engineering<br />
report in 1952 recommended the deepening of the drain by approximately 0.9 m to improve the<br />
drainage in the area.<br />
March 2008 141 <strong>Fort</strong> <strong>Erie</strong> <strong>Creeks</strong> <strong>Watershed</strong> <strong>Plan</strong><br />
General Report (105116)
In order to summarize the findings of the characterization and initial impact assessment, the<br />
following table has been prepared. The creeks have been classified by the reach type, and in<br />
particular, its sensitivity to change.<br />
TABLE 4.5.1:<br />
WATERCOURSE SENSITIVITY TO CHANGE<br />
Creek # Reaches Reach Showing Significant Erosion Reaches in Adjustment<br />
Black Creek 74 4; BLC-12, BCC-14, BLC-26, BLC-NT-1 16<br />
Beaver Creek 27 3: BVC-13, BVC-14, BVC-25 16<br />
Six Mile Creek 17 2: SMC-5, SMC-7 2<br />
Frenchman’s Creek 15 5: FRC-4,FRC-5,FRC-6,FRC-9,FRC-14 3<br />
Millers Creek 11 2: MLC-7, MLC-8 3<br />
Baker Creek 3 0 0<br />
Kraft Drain 4 3:KFD-1,KFD-3,KFD-4 4<br />
Bertie Bay Drain 2 0 0<br />
March 2008 142 <strong>Fort</strong> <strong>Erie</strong> <strong>Creeks</strong> <strong>Watershed</strong> <strong>Plan</strong><br />
General Report (105116)
5. WATERSHED MANAGEMENT OPPORTUNITIES<br />
5.1 General<br />
It has been recognized that there tend to be two levels of management opportunities associated<br />
with an area’s watershed resources: those which apply to the whole of the respective study area<br />
and those which relate to a specific location or environmental unit within the respective<br />
watershed area.<br />
The foregoing premise has been used to develop watershed management opportunities for the<br />
study area as a whole, as well as for the following drainage systems:<br />
− Black Creek<br />
− Beaver Creek<br />
− Baker Creek<br />
− Miller Creek<br />
− <strong>Niagara</strong> River Shore (<strong>Niagara</strong> River #16, 19, 20, 21, & 22)<br />
− Frenchman’s Creek<br />
− <strong>Fort</strong> <strong>Erie</strong><br />
− Lakeshore<br />
− Kraft Drain<br />
− Bertie Bay Drains & Lake <strong>Erie</strong> 1<br />
− Six Mile Creek<br />
[Note: On account of the relatively small size, and similar characteristics, the analysis has<br />
combined the <strong>Niagara</strong> River neighbourhood areas into <strong>Niagara</strong> River Shores, and has combined<br />
Lake <strong>Erie</strong> 1 with the Bertie Bay Drains.]<br />
<strong>Watershed</strong> management opportunities identified in this study have been organized according to<br />
the following three key systems:<br />
‣ Watercourse Systems<br />
‣ Natural Heritage Systems<br />
‣ Stormwater Management<br />
5.1.1 Definitions of Key Systems<br />
The three key systems to be addressed in terms of management direction within the <strong>Watershed</strong><br />
<strong>Plan</strong> are:<br />
(i)<br />
Watercourse Systems<br />
Watercourse systems refers to the system of surface water features (creeks and Municipal<br />
Drains) and the associated aquatic habitat within, and the riparian zone and valleylands adjacent<br />
to the watercourse. The Provincial Policy Statement (2005) defines watercourses, within the<br />
definition for surface water features, as “including headwaters, stream channels, rivers, inland<br />
March 2008 143 <strong>Fort</strong> <strong>Erie</strong> <strong>Creeks</strong> <strong>Watershed</strong> <strong>Plan</strong><br />
General Report (105116)
lakes, seepage areas, recharge/discharge areas, springs, and associated riparian lands that can be<br />
defined by their vegetation or topographic characteristics”.<br />
The <strong>Conservation</strong> Authorities Act (RSO 1990, Chapter C.27, Section 25) defines “watercourse”<br />
as “an identifiable depression in the ground in which a flow of water regularly or continuously<br />
occurs”.<br />
The Ministry of Natural Resources defines the watercourses in terms of the levels of fish habitat<br />
(Type 1, Type 2, or Type 3), and provides guidance for the management and restoration of the<br />
fish communities.<br />
Depending on the integrated value of the respective surface water features within the study area,<br />
there will need to be unique guidance provided in terms of protection, enhancement, or<br />
restoration.<br />
Municipal Drains<br />
The Ontario Ministry of Agriculture defines a municipal drain as a drainage system. Most<br />
municipal drains are either ditches or closed systems such as pipes or tiles buried in the ground.<br />
They can also include structures such as dykes or berms, pumping stations, buffer strips, grassed<br />
waterways, storm water detention ponds, culverts and bridges. Even some creeks and small<br />
rivers are now considered to be Municipal drains (ref. www.omafra.gov.on.ca).<br />
<strong>Fort</strong> <strong>Erie</strong> has a combination of both natural and man-made Municipal drains. Figure 8 depicts<br />
the location of the drains, however the Town is currently updating their database and should be<br />
contacted for a current listing of Municipal drains.<br />
Municipal drains are created under the authority of the Drainage Act. There are 3 key elements<br />
of a municipal drain:<br />
Community Project — Landowners who need to solve a drainage problem may submit a<br />
prescribed petition under the Drainage Act to their local municipality, requesting the<br />
establishment of a municipal drain. If certain criteria are met, the municipality appoints an<br />
engineer who prepares a report, identifying the proposed solution to the problem and how the<br />
costs will be shared. There are various meetings where landowners in the watershed of the<br />
municipal drain can voice their desires and concerns. There are also several appeal stages where<br />
they can voice their objections. So, the end result of the process is a "communally accepted"<br />
project.<br />
Legal Existence — After all appeals have been heard and dealt with, the municipality passes a<br />
by-law, adopting the engineer’s report. The municipality then has the authority and the<br />
responsibility to construct and maintain the project. The cost of the work is assessed to the lands<br />
in the watershed in the same ratios as contained within the engineer’s report. So for a ditch or a<br />
pipe to be a municipal drain, there must be a by-law adopting an engineer’s report.<br />
Municipal Infrastructure — Once a municipal drain has been constructed under the authority<br />
of a by-law, it becomes part of that municipality’s infrastructure. The local municipality, through<br />
its drainage superintendent, is responsible for repairing and maintaining the municipal drain. In<br />
March 2008 144 <strong>Fort</strong> <strong>Erie</strong> <strong>Creeks</strong> <strong>Watershed</strong> <strong>Plan</strong><br />
General Report (105116)
certain circumstances, the municipality can be held liable for damages for not maintaining these<br />
drains. (ref. www.omafra.gov.on.ca)<br />
(ii)<br />
Natural Heritage Systems<br />
The Provincial Policy Statement (2005) defines a natural heritage system, and natural heritage<br />
features, as “a system made up of natural heritage features (wetlands, coastal wetlands, fish<br />
habitat, woodlands, valleylands, endangered and threatened species habitat, wildlife habitat, and<br />
areas of natural and scientific interest) and areas, linked by natural corridors which are necessary<br />
to maintain biological and geological diversity, natural functions, viable populations of<br />
indigenous species and ecosystems. These systems can include lands that have been restored and<br />
areas with the potential to be restored to a natural area”.<br />
The management direction builds on: natural heritage objectives and targets; each<br />
subwatershed’s natural area status and existing impacts; and opportunities unique to the area.<br />
(iii)<br />
Stormwater Management<br />
Stormwater from rainfall and snowmelt either infiltrates into the ground, or runs on the surface.<br />
In an urban environment, this runoff is modified as it is conveyed to natural watercourses<br />
through lawns, gutters, storm sewers and roadways. Prior to discharging to a swale, creek,<br />
wetland, pond, or lake, this stormwater, which often carries pollutants, must be treated in<br />
accordance with Provincial doctrine. Stormwater management (SWM) is the application of<br />
practices that are designed to protect downstream receiving waters from negative impacts of<br />
urban development, such as flooding, erosion, and degraded water quality. Each subwatershed<br />
within the <strong>Fort</strong> <strong>Erie</strong> <strong>Creeks</strong> <strong>Watershed</strong> area should have a system of stormwater management<br />
facilities that manage stormwater in accordance with the area’s resource protection objectives.<br />
5.1.2 General <strong>Watershed</strong> Goals and Objectives<br />
The following list of general watershed-wide goals and objectives has been generated from the<br />
combination of input from the Study Team, Technical Steering Committee, and the public (ref.<br />
Section 3.2):<br />
1. Protect, enhance and restore important watercourses/terrestrial natural areas/aquatic<br />
habitat<br />
2. Manage urban runoff and minimize flooding from existing and future development areas<br />
3. Minimize point and non-point source contaminants<br />
4. Preserve and enhance the quality and quantity of groundwater.<br />
5. Protect the Lake <strong>Erie</strong> and <strong>Niagara</strong> River shorelines.<br />
6. Integrate rural and agricultural land uses with the ecosystem.<br />
5.2 <strong>Watershed</strong>-Wide Constraints and Opportunities<br />
• The <strong>Niagara</strong> Water Quality Protection Strategy (NWQPS) recognized that there is a<br />
general lack of consistency and rigor in land use policies for protecting, improving and<br />
restoring water quality and quantity across the <strong>Niagara</strong> Region. To this end, principles<br />
have been established as part of this <strong>Watershed</strong> <strong>Plan</strong>, such that the Town of <strong>Fort</strong> <strong>Erie</strong> and<br />
March 2008 145 <strong>Fort</strong> <strong>Erie</strong> <strong>Creeks</strong> <strong>Watershed</strong> <strong>Plan</strong><br />
General Report (105116)
Regional Municipality of <strong>Niagara</strong> can embrace the recommendations for future Official<br />
<strong>Plan</strong> and Zoning updates. Excerpts from the NWQPS are included in Appendix ‘H”.<br />
• The <strong>Niagara</strong> River Remedial Action <strong>Plan</strong> (RAP) established 32 different priority<br />
activities for implementation, to restore the desired beneficial uses. The Stage II<br />
Implementation Annex is on account for “the proposed and anticipated RAP partner and<br />
implementation activities”. Excerpts from the RAP are included in Appendix ‘H’.<br />
• In addition to land use policy, other area-wide policies have been proposed, which are<br />
less relevant to any one site in particular. These activities would relate to policies for<br />
Natural Heritage Systems, stewardship, public education and other overarching mandates<br />
related to water quality and quantity management. These policies/strategies were<br />
developed in accordance with the applicable Federal, Provincial, Regional and/or Local<br />
policies.<br />
• As part of the development of the <strong>Fort</strong> <strong>Erie</strong> <strong>Creeks</strong> <strong>Watershed</strong> <strong>Plan</strong>, it is important that all<br />
opportunities relate back to the public and stakeholders’ vision and goals. Opportunities<br />
will also need to be compatible with the recent provincial planning initiatives (e.g., Places<br />
to Grow) to contribute to the <strong>Niagara</strong>’s sub-area planning and with Regional<br />
complementary initiatives.<br />
The following is a list of constraints and opportunities identified at the watershed-wide level.<br />
These have been summarized graphically for Stormwater Management and Watercourses on<br />
Drawing 1. Natural area significance constraints are presented on Figure NH 8: Protection<br />
designation has a High constraint; <strong>Conservation</strong> has a Medium constraint. The extent of other<br />
natural heritage issues is rated by subwatershed in Tables 4.3.3 and 4.3.4.<br />
Constraints/Designations<br />
−<br />
−<br />
−<br />
Natural Areas<br />
• Significance<br />
• High Severity Issues<br />
− Reduced function because of levelling of slough mosaic<br />
− Gaps in riparian buffers<br />
− Spreading imperviousness<br />
− Agricultural runoff<br />
• Development, especially along the lakeshore<br />
Watercourses of Fisheries Significance (ref. Section 2.5.3 and 5.3.1 for definitions)<br />
• Type 1<br />
• Type 2<br />
• Type 3<br />
Stream Morphology<br />
• Meander belt width<br />
• Sensitive points of gradient control<br />
March 2008 146 <strong>Fort</strong> <strong>Erie</strong> <strong>Creeks</strong> <strong>Watershed</strong> <strong>Plan</strong><br />
General Report (105116)
−<br />
−<br />
−<br />
Flooding and conveyance<br />
• 100 year regulatory flood plain<br />
• Municipal Drains<br />
• Deficient (under-sized) culverts<br />
• Existing stormwater management facilities<br />
• Erosion sites<br />
Water Quality<br />
• Point Source pollutants<br />
• Contaminated areas<br />
Proposed Land Use<br />
Management Opportunities<br />
−<br />
−<br />
−<br />
Natural Area Enhancement<br />
• Re-establishment of slough mosaic where feasible in appropriate sites<br />
• Add riparian buffers to watercourses, and increase buffers on core areas<br />
(EPA/ECA/LSA’s)<br />
• Reinstate and strengthen linkages/environmental corridors<br />
• Fill small gaps to increase core areas<br />
• Stabilize dunes<br />
• Re-vegetate recharge areas<br />
• Restore under-represented natural landscapes and communities<br />
• Protect emerging coastal corridor and encourage natural area restoration of coastal<br />
communities<br />
• Enhance aquatic habitat<br />
Watercourses Protection Hierarchy<br />
• Protect/enhance in-situ<br />
• Maintain as open; realignment possible<br />
• Eliminate as necessary; subject to function replication<br />
Stormwater Management<br />
• Conceptual location of facilities<br />
• Watercourse/floodplain improvements<br />
• Erosion control/stream restoration<br />
Stream Systems<br />
5.2.1 Watercourse System Opportunities<br />
The following is a long-list of watershed-wide opportunities for improvement to the watercourse<br />
systems:<br />
• Increase base flow through enhanced infiltration or ‘leaky’ stormwater facilities.<br />
• Increase base flow due to water imports from Lake <strong>Erie</strong> and Municipal water supply.<br />
• Reduce temperature of water leaving stormwater management facilities through cooling<br />
trenches and shading.<br />
March 2008 147 <strong>Fort</strong> <strong>Erie</strong> <strong>Creeks</strong> <strong>Watershed</strong> <strong>Plan</strong><br />
General Report (105116)
• Maintain existing shading vegetation.<br />
• Restore altered watercourses.<br />
• Restore or enhance the riparian zones along watercourses (also affects water temperature)<br />
• Reduce the amount of sediment washed from fields to reduce contaminants and nutrients<br />
that are often most mobile when attached to soil particles.<br />
• Enhance riparian vegetation buffers to reduce contaminant inputs to watercourses.<br />
• Remove existing barriers to fish movement and migration.<br />
• Restore or enhance the straightened watercourse reaches with due consideration of<br />
proposed development and changes to flow regime.<br />
• Restore or enhance a portion of low order watercourse as open systems (e.g. swale).<br />
• Maintain or “mimic” upstream sources of sediment where possible.<br />
• Strategically alter the development standard (from urban curb and gutter to roadside<br />
swales); protect existing swales where possible through appropriate land use<br />
designations.<br />
It is acknowledged that conservation work and the remediation of municipal drains in <strong>Fort</strong> <strong>Erie</strong><br />
has been conducted, however, it is encouraged that natural channel processes be implemented in<br />
the municipal drains where appropriate. This would be accomplished through additional areas of<br />
municipal drain naturalization. This involves designing a cross-section with the appropriate<br />
dimensions (low width to depth ratio) matched with a suitable planform and profile to efficiently<br />
convey flow and sediment. The channel would still provide all the benefits of the drain, but with<br />
reduced deposition. There may be the need for some grading and earthworks to create a nested<br />
set of channels and floodplain area, which would reduce the risk of entrenchment and greatly add<br />
to the long-term stability of the municipal drain. Through municipal drain naturalization, the cost<br />
in remediation work and the impact on the channel systems may be reduced.<br />
Aquatic Biology<br />
Buffers<br />
Some watercourses within the study area have largely retained their natural attributes. When<br />
development occurs within designated areas (ref. Official <strong>Plan</strong>), these should be protected with<br />
adequate buffers, reflecting the sensitivity of the resource.<br />
Regeneration<br />
Many watercourses within the study area have been altered (deepened and/or straightened) to<br />
drain land for agriculture or to facilitate the construction of transportation routes and other urban<br />
infrastructure. It appears that many of the past attempts to create viable agricultural lands in the<br />
poorly drained riparian areas surrounding the main creek channels have failed, and throughout<br />
the study area these former swamps are regenerating, which has likely resulted in an overall<br />
improvement in aquatic habitat over the last fifty years or more. Establishing environmental<br />
protection areas with adequate riparian buffers within these regenerating areas, and allowing the<br />
regeneration to continue, would ensure that these aquatic habitats will continue to naturalize over<br />
time. In some instances where watercourses have been straightened, but the original meandering<br />
channels still exist, it may be feasible to re-establish the watercourse within these old channels to<br />
provide more aquatic habitat within a natural channel, and to help facilitate regeneration.<br />
March 2008 148 <strong>Fort</strong> <strong>Erie</strong> <strong>Creeks</strong> <strong>Watershed</strong> <strong>Plan</strong><br />
General Report (105116)
Restoration<br />
The remaining watercourses are mostly situated within active agricultural land or urban use land.<br />
Many of these may have been dug for drainage purposes or, if natural, have been deepened<br />
and/or straightened. Where feasible, buffers should be encouraged, as well as promoting<br />
landowner stewardship. When land use changes occur, likely during urban development,<br />
watercourses considered viable fish habitat should be reconstructed using natural channel design.<br />
Watercourses such as agricultural swales and ditches, that may provide very marginal or no fish<br />
habitat, could be either restored and enhanced, where appropriate, or they could be reconstructed<br />
in the context of urban development, so that they continue to perform the important role of<br />
providing water and appropriate levels of dissolved and suspended materials downstream.<br />
Summary<br />
<strong>Watershed</strong> management strategies for the study area should include the following:<br />
‣ Encourage the establishment of appropriately sized vegetative riparian buffers where they<br />
currently do not exist or are inadequate.<br />
‣ Where development results in the relocation of a degraded watercourse that contains fish<br />
habitat, appropriate watercourse rehabilitation measures should be undertaken.<br />
‣ Where development occurs adjacent to a watercourse containing fish habitat,<br />
appropriately sized vegetative riparian buffers should be established.<br />
‣ Stewardship for the watercourses and riparian buffers.<br />
5.2.2 Natural Heritage System Opportunities<br />
Natural heritage systems complement stormwater and watercourse systems. Wetlands and the<br />
slough mosaic landscape can retain stormwater to moderate floods. Natural areas can be<br />
valuable in maintaining healthy watercourses by filtering contaminants. Natural heritage<br />
systems are essential both for habitat and for green infrastructure that can help ease the scale and<br />
expense of built infrastructure.<br />
<strong>Watershed</strong>-wide opportunities for natural heritage systems include:<br />
a) The Regional Municipality of <strong>Niagara</strong>’s Environmental Policies (2005) and the Town of<br />
<strong>Fort</strong> <strong>Erie</strong>’s Official <strong>Plan</strong> (2006) each have policies that provide an excellent basis for a<br />
watershed-level natural heritage plan. Their policies protect the most significant sites<br />
(Environmental Protection Areas) and provide flexibility for ecologically responsible<br />
planning of sites of more moderate significance (Environmental <strong>Conservation</strong> Areas).<br />
b) Given the extent of natural area, time alone can encourage succession toward a more<br />
climax forest.<br />
c) Restoration of slough mosaic micro-topography, where there are opportunities in<br />
appropriate sites, can both boost biodiversity and natural area’s flood-moderation and<br />
water quality protection roles without having to expand natural area extent.<br />
Opportunities might include use (expansion and blockage) of artificial surface drainage<br />
patterns in abandoned areas.<br />
March 2008 149 <strong>Fort</strong> <strong>Erie</strong> <strong>Creeks</strong> <strong>Watershed</strong> <strong>Plan</strong><br />
General Report (105116)
d) Restoration of the slough mosaic in the impermeable soils by creation of small closed<br />
depressions can help isolate sloughs from drains, both Municipal and farm-specific, to<br />
improve natural area functioning while remaining compatible with the drain maintenance<br />
essential to the agricultural community. The landscape may also be conducive to the use<br />
of simple constructed wetlands to treat non-point source runoff before it discharges to<br />
streams.<br />
e) With slough mosaic pattern enhancement where there are opportunities in feasible (e.g.,<br />
easy access) and appropriate (e.g., levelled poorly drained lacustrine clay; low current<br />
significance; downstream flooding) existing natural area, <strong>Fort</strong> <strong>Erie</strong> watersheds could add<br />
considerable value to its current green infrastructure, an improvement that will help<br />
protect the area from the effects of increased storm intensity and soil erosion associated<br />
with climate change. These opportunities may help reduce climate change-induced<br />
expenditures in engineered flood protection.<br />
f) Restoration of a small hectarage of new natural area could make a large difference in the<br />
functioning of corridors and interior forest.<br />
g) The <strong>Fort</strong> <strong>Erie</strong> area has the potential to play a role in the potential adaptation to climate<br />
change. Its strategic location for biota migration to bypass the Great Lakes barriers,<br />
combined with its extensive natural cover including the Important Bird Area corridor,<br />
makes it a likely northern migration route for terrestrial species. The alternative of the<br />
Essex County funnel, at 4% woodland and scrubland (Larsen et al, 1998), is notably<br />
lacking in the necessary natural area. For some species, the opportunity will be<br />
constrained by the barrier to northward shift of species presented by the built-up area of<br />
Buffalo; coordination with American agencies via the Remedial Action <strong>Plan</strong> linkages<br />
could lead to improved cross-boundary corridors.<br />
h) The area has unique opportunities to restore its globally significant coastal communities.<br />
• Protection and management of the gradually exposed coastal corridor could allow<br />
restoration without affecting existing property (assuming provision of water<br />
access opportunities). Models for a wide range of climate scenarios all project a<br />
decrease in Lake <strong>Erie</strong> levels for 2050 relative to 1961 to 1990 baseline (Mortsch<br />
et al., 2006). Protection could include protection boundaries that remain fixed as<br />
lake levels decline; management of road allowance access points to prevent ATV<br />
access and encourage native shoreline community restoration while providing<br />
low-impact walking access; development of strategies in anticipation of increased<br />
demand for lakefront access from people in nearby cities as summer temperatures<br />
and gas prices rise.<br />
• The many large lots along the lake shoreline present opportunities for restoration<br />
for property owners excited by the prospect of owning a globally significant<br />
community. NPCA could provide: accessible information explaining significance<br />
and suggested actions; and technical advice.<br />
i) The unique features present economic opportunities:<br />
• Large savings from green infrastructure (natural cover providing hydrological and<br />
microclimate services) instead of built infrastructure.<br />
• Current forms of agriculture can be improved through drainage while restoring<br />
sloughs and natural area functioning.<br />
• The hydro power heritage of the region could be expanded to make the area a hub<br />
for green energy. Possible options include:<br />
March 2008 150 <strong>Fort</strong> <strong>Erie</strong> <strong>Creeks</strong> <strong>Watershed</strong> <strong>Plan</strong><br />
General Report (105116)
• Alternate agriculture options that work with the landscape capability and avoid<br />
off-site drainage and agricultural run-off effects could include low-input ethanol<br />
production from willow, switchgrass or Virginia Mallow.<br />
• Wind energy generation that may have potential for farm properties and habitat<br />
restoration/management areas near the lake.<br />
• Potential income from sustainable use of natural areas: e.g., timber.<br />
• Tourism and recreation could build on the green theme.<br />
• The flat natural landscape, existing routes and quiet paved roads offer potential<br />
for the area to be a cycling mecca for seniors and families.<br />
j) The sense of community could be a foundation for broad-based stewardship efforts and<br />
for cost-sharing by downstream beneficiaries. Indeed, given the role the area may play<br />
for southern Ontario and the rest of the Carolinian Zone, there may be an opportunity for<br />
beneficiaries outside the watershed study area to pay compensation for <strong>Fort</strong> <strong>Erie</strong> area<br />
stewardship costs. The Alternative Land Use Services (ALUS) model used in Norfolk<br />
County could be investigated for applicability.<br />
k) It may be possible to build on the uniqueness of the natural area extent to create a green<br />
branding for the area, one that extends to lifestyles, conservation, green roofs etc. – Keen<br />
to be Green.<br />
Options for control of invasive exotic species include:<br />
– promoting and using locally sourced native plants<br />
– training to recognize invasive species for early control<br />
– preparing brief information brochures on control of local priority species<br />
– identifying priority sites for management<br />
– staying current with research on control methods and species of concern<br />
– liaising with local media and landscape industry<br />
– placing information signs along popular walking trails.<br />
In summary, the main natural heritage strength of the <strong>Fort</strong> <strong>Erie</strong> watersheds is the natural cover’s<br />
high total area. The main weakness is partial loss of biodiversity and of flood protection because<br />
of shoreline development and slough levelling.<br />
Other major threats, common to the rest of southern Ontario and the planet, include climate<br />
change and lack of public awareness of human effects on the ecosystem. Ironically, adapting to<br />
climate change is linked to some of the opportunities: a widening shoreline corridor and the<br />
possible restoration of globally significant communities if lake levels drop; the northward<br />
expansion of species; and the vital role of enhanced natural areas in mitigating worsening<br />
flooding, erosion and associated costs. A number of ecologically sustainable economic<br />
opportunities are also possible.<br />
The general opportunities are:<br />
‣ Preservation for subwatersheds with good quality habitat and services, few threats and<br />
good current protection<br />
‣ Protection for subwatersheds with good quality habitat and services but subject to some<br />
threats and low current protection<br />
March 2008 151 <strong>Fort</strong> <strong>Erie</strong> <strong>Creeks</strong> <strong>Watershed</strong> <strong>Plan</strong><br />
General Report (105116)
‣ Enhancement for subwatersheds where natural area is present but of lower quality and<br />
where improved services would be beneficial.<br />
‣ Restoration for subwatersheds where there is inadequate natural area as well as a need for<br />
ecological services.<br />
Opportunities will be considered for each subwatershed appropriate to its unique characteristics,<br />
in the following Section 5.3.<br />
5.2.3 Stormwater Management (Quality and Quantity) System Opportunities<br />
Reduce Impact of Stormwater Runoff from Developing Areas on Pollutant Loading:<br />
• Provide stormwater quality treatment facilities (wet ponds, wetlands, hybrids) prior to<br />
discharge to receiving watercourses.<br />
• Maximize infiltration to reduce wash off and transport of pollutants<br />
Reduce Nutrient Loading and Concentrations in <strong>Creeks</strong>, Lake <strong>Erie</strong> and <strong>Niagara</strong> River:<br />
• Changes in land use and stormwater management could reduce nutrient loading;<br />
consideration for Low Impact Development form (LID).<br />
• Increased shading from riparian vegetation could reduce biologic plant growth within the<br />
watercourses (e.g. algae), reducing the diurnal oxygen fluctuations created by the<br />
biological organisms.<br />
• Expanded riparian buffers could help filter nutrients<br />
• Reductions in water temperatures could increase dissolved oxygen solubility and<br />
concentration within the water.<br />
• Simple, constructed wetlands could help treat rural non-point source runoff before<br />
discharge to creeks<br />
• Increased efficiency of treatment facilities<br />
Enhance Groundwater:<br />
• Introduction of potable municipal water to greenfield development areas typically<br />
increases water balance due to lawn watering.<br />
• Enhanced infiltration in centralized stormwater management facilities.<br />
• Potential source infiltration through appropriate passive lot infiltration facilities.<br />
• Utilization of manmade wetlands for stormwater could enhance infiltrating groundwater<br />
quality and quantity.<br />
• Tertiary treatment of septic systems.<br />
Mitigate Flooding impact of Stormwater Runoff from Development on Peak Flow Rates:<br />
• Provide stormwater quantity storage facilities to attenuate stormwater runoff prior to<br />
discharge to receiving watercourses.<br />
• Enhance functioning of immature, levelled lowland lacustrine Environmental<br />
<strong>Conservation</strong> Areas by restoring the slough mosaic landscape where feasible, appropriate<br />
opportunities.<br />
• Maximize infiltration at source to reduce runoff volumes.<br />
March 2008 152 <strong>Fort</strong> <strong>Erie</strong> <strong>Creeks</strong> <strong>Watershed</strong> <strong>Plan</strong><br />
General Report (105116)
• Improve conveyance (watercourses and culverts).<br />
• Flood proof flood vulnerable areas<br />
Reduce Impact of Stormwater Runoff from Developing Areas on in-stream Erosion Potential:<br />
• Provide stormwater quantity storage to attenuate peak flow to non-erosive flow rates<br />
• Maximize infiltration at source to reduce runoff volumes (through the use of stormwater<br />
Best Management Practices and Low Impact Development form).<br />
• Enhance functioning of immature, levelled lowland lacustrine ECA’s by restoring<br />
swale/slough landscape where feasible, appropriate opportunities.<br />
5.3 Area-Specific Management Opportunities<br />
The development of the <strong>Watershed</strong> Strategy has been separated into two parts: watershed-wide<br />
recommendations, and area-specific recommendations. The first represents a collection of highlevel<br />
recommendations that are to be applied broadly, and consist largely of policies and non<br />
site-specific actions, such as stewardship.<br />
The second set of recommendations suggests specific actions to deal with specific issues or<br />
problems, within each of the subwatersheds (i.e. the entire <strong>Fort</strong> <strong>Erie</strong> <strong>Creeks</strong> <strong>Watershed</strong> <strong>Plan</strong><br />
study area has been divided in to eleven subwatershed areas. In a few locations, the<br />
subwatershed boundaries used for natural heritage mapping are slightly different from those used<br />
in the stormwater analysis: the difference has no effect on the recommended actions.) This<br />
process of generating a list of recommendations, and a prioritization of the actions on the list,<br />
will enable the agencies and associated stakeholders to structure their programs around the key<br />
recommendations. The listing of the site-specific recommendations will also help make the<br />
actions clear and implementable.<br />
Prior to generating the list of area-specific recommendations for management opportunities, the<br />
watercourses have been classified according to their sensitivity to change, and a constraint rating<br />
has been developed for each reach. The purpose of this rating is to guide the implementation of<br />
future actions, whether or not they include development or restoration works that directly impact<br />
the watercourses.<br />
5.3.1 Integrated Rating of Watercourse Systems<br />
Table 5.3.1 summarizes, on a watercourse basis, organized by reach, the integrated constraint<br />
rating for the respective reaches, based on discipline-specific input related to each discipline.<br />
The proposed actions or each watercourse in the study area must consider the results of the net<br />
rating for each reach.<br />
Each of the watercourses in the <strong>Fort</strong> <strong>Erie</strong> <strong>Creeks</strong> study area has been assessed on the basis of the<br />
various environmental factors and considerations, as outlined in the following:<br />
Watercourses<br />
The majority of the channels within the study area fall under a medium stream morphology<br />
constraint rating. This means that channel enhancement would benefit the overall function form<br />
March 2008 153 <strong>Fort</strong> <strong>Erie</strong> <strong>Creeks</strong> <strong>Watershed</strong> <strong>Plan</strong><br />
General Report (105116)
and value of the stream system. These reaches are generally widening or aggrading, have poor<br />
sediment conveyance and lack any bed morphology. There is only one reach of the reaches<br />
investigated that has been defined as a high constraint from a strictly geomorphological<br />
perspective: Reach FRC-3. Reach FRC-3 is a stable reach with pronounced pool-riffle<br />
sequences, vegetated banks and a well-defined channel corridor. This reach would not require<br />
channel enhancement works. There are three reaches identified as low constraints. These<br />
reaches were agricultural, straightened channels, with no significant impact to the channel<br />
system.<br />
Fisheries<br />
The <strong>Fort</strong> <strong>Erie</strong> <strong>Creeks</strong> watershed plan fisheries classifications ratings are defined as follows:<br />
MNR Type 1:<br />
Areas that limit the overall productive capacity (i.e. if these areas are harmfully altered the<br />
productive capacity of the area would be reduced). Sensitive fish species (part or all of their life<br />
cycle) and/or habitats are present (including springs, seeps, upwelling areas, seasonally<br />
inundated spawning habitats, refugia, nursery areas, over-wintering areas, and ephemeral pools).<br />
These areas require a high degree of protection, however may also be enhanced with care, and<br />
can achieve a high potential for habitat compensation.<br />
These habitats provide an important ecological function that would potentially be difficult to<br />
replicate. They have a low potential to benefit from rehabilitation, as they require none.<br />
Generally, these habitats are natural and have a correspondingly diverse fish community. They<br />
may contain critical habitat, and may contain a rare fish species or community.<br />
MNR Type 2:<br />
This habitat is important but below its productive capacity and is ideal for enhancement or<br />
restoration projects. Sensitive species may or may not be present part or all of the time. Fish<br />
community is below potential due to habitat related issues, however, may be increased if the<br />
limiting factors are reversed.<br />
These habitats provide an ecological function that can likely be replicated or enhanced if<br />
alterations are undertaken appropriately. Generally, these habitats are degraded and thus they<br />
have a high potential to benefit from rehabilitation. Their fish communities vary in diversity and<br />
complexity. This category also includes marginal habitat that provides an important linkage to<br />
upstream habitats.<br />
MNR Type 3:<br />
Areas with low productive capacity, where common species may or may not be present, and no<br />
sensitive species and/or specialized habitat are present (incidental exceptions of fish presence<br />
may occur in some locations, e.g. the Welland Shipping Canal). Areas can negatively affect<br />
downstream, down-drift or connected fish habitats, and should not be considered for<br />
compensation opportunities.<br />
March 2008 154 <strong>Fort</strong> <strong>Erie</strong> <strong>Creeks</strong> <strong>Watershed</strong> <strong>Plan</strong><br />
General Report (105116)
These habitats provide a simple ecological function (i.e. downstream contributions) that can<br />
likely be replicated or enhanced. They will not benefit much, if any, from rehabilitation, as their<br />
potential is severely limited by base conditions (usually lack of water flow). Generally, these<br />
habitats are swales and other ephemeral drainage features that are dry most of the time, and do<br />
not support fish, although in some situations a few individuals of one or two tolerant species<br />
such as brook stickleback or fathead minnow may be temporarily present.<br />
These classifications provide guidance for how watercourses may potentially be treated in future<br />
planning, whether in the context of development (urban, agricultural, transportation, etc.), or in<br />
identifying candidate habitats that would most benefit from limited habitat restoration funds.<br />
Their purpose is to help achieve an overall net gain in fish habitat and productivity within the<br />
<strong>Fort</strong> <strong>Erie</strong> <strong>Creeks</strong> watershed. Application of the recommended treatments will result in the higher<br />
quality natural habitats being retained or enhanced in-place, and the lower quality degraded<br />
habitats being improved through natural channel design and habitat enhancement and creation.<br />
The classification inherently acknowledges that there are some drainage features that do not<br />
contribute directly to fish productive capacity.<br />
Terrestrial Resources<br />
Terrestrial resource constraints relate to the presence in, or near, the watercourse riparian zone of<br />
high or medium constraint/value features, such as woodlots and wetlands.<br />
The first rating is for vegetation adjacent to the creek and riparian zone. High corresponds to a<br />
vegetated Environmental Protection Area or Locally Significant Area along greater than 25% of<br />
the reach length; Moderate is vegetated Environmental Protection Area or Locally Significant<br />
Area along 1% to 25% of the reach OR vegetated Environmental <strong>Conservation</strong> Area along<br />
greater than 25% of the reach; and Low is the remainder.<br />
The second rating is of the wetland rating associated with the creek itself and its immediate bank<br />
area: High is Provincially Significant Wetland (PSW) along greater than 25% of reach length;<br />
Moderate is PSW along 1% to 25% of the reach; and Low is no PSW.<br />
Stream Morphology<br />
Stream Morphology morphological constraints relate to the drainage density, erosion<br />
susceptibility, and/or stability of the channel form (aggradation/degradation).<br />
Flooding/Conveyance<br />
Flooding constraints are considered “high” if the reach is a natural watercourse, and has a<br />
floodplain associated with it, has structures identified in the floodplain, and the conveyance<br />
capacity cannot be replicated artificially. If there are no identified hazards such as structures or<br />
roadway overtopping, then the constraint is considered “medium”.<br />
Flooding constraints are also considered “medium” if the reach is a Municipal Drain, and has a<br />
registered floodplain associated with it, however the conveyance capacity can be replicated<br />
artificially.<br />
March 2008 155 <strong>Fort</strong> <strong>Erie</strong> <strong>Creeks</strong> <strong>Watershed</strong> <strong>Plan</strong><br />
General Report (105116)
If there is no registered floodplain, the constraint rating has been left blank.<br />
Summary<br />
Table 5.3.1 has been organized by subwatershed. Constraints have been defined as H-High,<br />
M-Medium, L-Low, and fish habitat as Type 1, 2, or 3 (MNR). Subwatersheds not listed do not<br />
have any defined watercourses in the area (e.g. <strong>Fort</strong> <strong>Erie</strong> and Lakeshore which are mostly<br />
urbanized areas, and <strong>Niagara</strong> River #20, #21, and #22, and Lake <strong>Erie</strong> 1).<br />
A semi-quantitative net rating of watercourse sensitivity has been established by combining the<br />
four component ratings, and by calculating a High, Medium, or Low preference rating based on<br />
the following formulae:<br />
High: must have at least 2 components scored “High” or Type 1 fish habitat, and none<br />
scored “Low”<br />
Low: must have at least 2 components scored “Low”, no more than 2 scored<br />
“Medium”, none scored “High”, and cannot be Type 1 fish habitat<br />
Medium: all other combinations of criteria scoring<br />
High: if the second part of the watercourse terrestrial rating (watercourse greater than<br />
25 % in a PSW) was high, the net rating would automatically be high.<br />
High: if the fisheries habitat is Type 1, the net rating would automatically be high.<br />
Note that a blank indicates a lack of any identified aquatic, terrestrial, stream morphology or<br />
flooding/conveyance constraint. Also, in some of the more isolated headwater reaches, and<br />
Municipal Drains in particular, the stream morphologic assessment was not conducted.<br />
March 2008 156 <strong>Fort</strong> <strong>Erie</strong> <strong>Creeks</strong> <strong>Watershed</strong> <strong>Plan</strong><br />
General Report (105116)
TABLE 5.3.1:<br />
INTEGRATED WATERCOURSE CONSTRAINT RATING<br />
Terrestrial<br />
Reach ID<br />
Fisheries/Habitat<br />
Resources 1 Stream Morphology Flooding/Conveyance Net Rating<br />
Black Creek Subwatershed<br />
BLC-1 Type 1 H/H M H H<br />
BLC-2 Type 1 H/H M H H<br />
BLC-3 Type 1 M/H M H H<br />
BLC-4 Type 1 H/H M H H<br />
BLC-5 Type 1 H/H M H H<br />
BLC-6 Type 1 M/H M H H<br />
BLC-7 Type 1 H/H M H H<br />
BLC-8 Type 1 H/H M H H<br />
BLC-9 Type 1 H/H M H H<br />
BLC-10 Type 1 M/H M H H<br />
BLC-11 Type 1 H/H M H H<br />
BLC-12 Type 1 H/H M H H<br />
BLC-13 Type 1 H/L M H H<br />
BLC-14 Type 1 M/H M H H<br />
BLC-15 Type 1 L/L M H H<br />
BLC-17 Type 1 M/H M H H<br />
BLC-18 Type 2 L/H M H H<br />
BLC-19 Type 2 H/H M H H<br />
BLC-20 Type 2 M/H M H H<br />
BLC-21 Type 2 M/H M H H<br />
BLC-22 Type 2 M/H M H H<br />
BLC-23 Type 2 H/H M H<br />
BLC-24 Type 2 L/L M M<br />
BLC-25 Type 2 L/L M M<br />
BLC-26 Type 2 M/L M M<br />
BLC-27 Type 2 L/L M M<br />
BLC-28 Type 2 L/L M L<br />
BLC-29 Type 2 L/L M L<br />
BLC-30 Type 2 L/L L L<br />
BLC-31 Type 2 L/L L L<br />
BLC-32 Type 1 L/L H<br />
BLC-NT-1 Type 1 H/H H<br />
BLC-NT-2 Type 1 H/H H<br />
BLC-NT-3 Type 1 L/L H<br />
BLC-NT-4 Type 1 L/L H<br />
BLC-NT-5 Type 1 L/L H<br />
MD-1 Type 1 H/H M H<br />
MD-2 Type 1 L/H M H<br />
MD-3 Type 1 H/H M H<br />
MD-4 Type 2 H/H M H<br />
MD-5 Type 2 L/H M H<br />
MD-6 Type 2 L/L M L<br />
MD-7 Type 2 H/H M H<br />
MD-8 Type 2 M/L H M<br />
MD-9 Type 2 L/L L<br />
HD-1 Type 2 L/L M L<br />
HD-2 Type 2 M/L M M<br />
HD-3 Type 2 M/L M M<br />
RD-1 Type 2 M/L M M<br />
RD-2 Type 2 L/L M L<br />
RD-3 Type 2 L/L H M<br />
SJMD-1 Type 1 H/H M H<br />
SJMD-2 Type 1 H/H M H<br />
SJMD-3 Type 1 H/H M H<br />
SJMD-4 Type 1 H/H M H<br />
SJMD-5 Type 1 H/H M H<br />
SJMD-6 Type 1 H/H M H<br />
SD-1 Type 2 H/H M H<br />
SD-2 Type 2 H/L M M<br />
SD-3 Type 2 M/L M M<br />
SD-4 Type 2 M/L M<br />
March 2008 157 <strong>Fort</strong> <strong>Erie</strong> <strong>Creeks</strong> <strong>Watershed</strong> <strong>Plan</strong><br />
General Report (105116)
TABLE 5.3.1:<br />
INTEGRATED WATERCOURSE CONSTRAINT RATING<br />
Terrestrial<br />
Reach ID<br />
Fisheries/Habitat<br />
Resources 1 Stream Morphology Flooding/Conveyance Net Rating<br />
BLC-ST-1 Type 1 H/H M H H<br />
BLC-ST-2 Type 1 H/H M M H<br />
BLC-ST-3 Type 1 H/H M M H<br />
BLC-ST-4 Type 1 H/H M M H<br />
BLC-ST-5 Type 1 L/L M M H<br />
BLC-ST-6 Type 1 M/H M M H<br />
BLC-ST-7 Type 1 H/H M M H<br />
BLC-ST-8 Type 1 H/M M H<br />
BLC-ST-9 Type 1 L/L M H<br />
BLC-ST-10 Type 1 M/H M H<br />
BLC-ST-11 Type 1 L/L M H<br />
BLC-ST-12 Type 1 M/L M H<br />
BLC-ST-13 Type 1 L/L M H<br />
Beaver Creek Subwatershed<br />
BVC-1 Type 1 H/H M M H<br />
BVC-2 Type 1 H/H M H H<br />
BVC-3 Type 1 M/H M M H<br />
BVC-4 Type 1 H/H M M H<br />
BVC-5 Type 1 H/H M H H<br />
BVC-6 Type 1 H/H M M H<br />
BVC-7 Type 1 H/H M M H<br />
BVC-8 Type 1 H/H M M H<br />
BVC-9 Type 1 H/H M M H<br />
BVC-10 Type 1 H/H M M H<br />
BVC-11 Type 1 H/H M M H<br />
BVC-12 Type 1 H/H M M H<br />
BVC-13 Type 1 H/H M M H<br />
BVC-14 Type 1 H/H M M H<br />
BVC-15 Type 1 H/H M M H<br />
BVC-16 Type 1 H/H M M H<br />
OD-1 Type 1 L/L M H<br />
OD-2 Type 1 L/L M H<br />
BVC-17 Type 1 H/H M M H<br />
BVC-18 Type 1 L/H M M H<br />
BVC-18A Type 3 L/H L M H<br />
BVC-19 Type 1 H/H M M H<br />
BVC-20 Type 1 H/H M M H<br />
BVC-21 Type 1 H/H M M H<br />
BVC-22 Type 1 M/H M M H<br />
BVC-23 Type 1 H/H M M H<br />
BVC-24 Type 1 L/H M M H<br />
BVC-25 Type 1 M/H M M H<br />
Baker Creek<br />
BKC-1 Type 1 H/H M H H<br />
BKC-2 Type 1 H/H M H H<br />
BKC-3 Type 1 H/M M H H<br />
Miller Creek<br />
MLC-1 Type 1 H/H M H H<br />
MLC-2 Type 1 H/H M H H<br />
MLC-3 Type 1 H/H M H H<br />
MLC-4 Type 1 H/H M H H<br />
MLC-5 Type 1 H/H M H H<br />
MLC-6 Type 1 H/H M H H<br />
MLC-7 Type 1 H/H M H H<br />
MLC-8 Type 1 H/H M H H<br />
HWB-1 Type 1 H/H H<br />
HWB-2 Type 1 M/H H<br />
HWB-3 Type 1 L/L H<br />
Frenchman’s Creek<br />
FRC-1 Type 1 H/H M M H<br />
FRC-2 Type 1 H/H M M H<br />
FRC-3 Type 1 H/H H M H<br />
FRC-4 Type 1 H/H M M H<br />
March 2008 158 <strong>Fort</strong> <strong>Erie</strong> <strong>Creeks</strong> <strong>Watershed</strong> <strong>Plan</strong><br />
General Report (105116)
TABLE 5.3.1:<br />
INTEGRATED WATERCOURSE CONSTRAINT RATING<br />
Terrestrial<br />
Reach ID<br />
Fisheries/Habitat<br />
Resources 1 Stream Morphology Flooding/Conveyance Net Rating<br />
FRC-5 Type 1 M/H M M H<br />
FRC-6 Type 1 M/H M M H<br />
FRC-7 Type 1 H/H M H H<br />
FRC-8 Type 1 M/H M M H<br />
FRC-9 Type 1 H/H M M H<br />
FRC-10 Type 1 H/H M M H<br />
FRC-11 Type 1 L/H M M H<br />
FRC-12 Type 1 M/H M M H<br />
FRC-13 Type 1 H/H M H H<br />
FRC-14 Type 1 H/H M M H<br />
FRC-15 Type 1 M/M M M H<br />
Kraft Drain<br />
KFD-1 Type 3 H/H M H H<br />
KFD-2 Type 3 H/H M H H<br />
KFD-3 Type 3 H/H M H H<br />
KFD-4 Type 3 H/H M H H<br />
KFD-5 Type 3 H/H L H *H<br />
Bertie Bay Drain<br />
BBD-1 Type 2 L/L M L<br />
BBD-2 Type 2 H/L M M<br />
Six Mile Creek<br />
SMC-1 Type 1 H/H M H H<br />
SMC-2 Type 1 H/H M H H<br />
SMC-3 Type 1 H/H M H H<br />
SMC-4 Type 1 H/H M H H<br />
SMC-5 Type 1 H/H M H H<br />
SMC-6 Type 1 H/H M H *H<br />
SMC-7 Type 1 L/L M H H<br />
SMC-8 Type 1 H/L M H H<br />
SMC-9 Type 1 H/H M H H<br />
SMC-10 Type 1 M/M M H H<br />
SMC-11 Type 1 M/L M H H<br />
MND-1 Type 1 H/L M H H<br />
MND-2 Type 1 H/M M H H<br />
MND-3 Type 1 H/L M H H<br />
MND-4 Type 1 M/M M H H<br />
MND-5 Type 1 H/L M H H<br />
MND-6 Type 1 H/L M H H<br />
<strong>Niagara</strong> River #19<br />
DR1,2 Type 3 H/H H<br />
Note: a blank indicates a lack of any aquatic, terrestrial, stream morphology or flooding/conveyance constraint. Also, in some of the more<br />
isolated headwater reaches, and Municipal Drains in particular, the stream morphologic assessment was not conducted.<br />
* These watercourses have been straightened, but the original meandering planform exists on the floodplain, it may be possible to re-establish the<br />
watercourse within these old channels to provide aquatic habitat within a natural channel.<br />
1. The first rating is for the adjacent floodplain; the second one is for wetland presence in the creek itself or the immediate bank area.<br />
The integrated net constraint rating used in this study (High, Medium and Low constraint) and<br />
the MNR fish habitat classification system (Type 1, Type 2, and Type 3 habitat) are both<br />
intended to guide the treatment of watercourses when confronted by development, land use<br />
changes, or opportunities for protection or rehabilitation. The principal differences between the<br />
two systems are as follows:<br />
1. The integrated net constraint rating used in this report is applied at the subwatershed<br />
scale, and is not based on detailed, site-specific information of the sort that is required to<br />
identify ‘critical’ habitats, as defined in the MNR system.<br />
2. The system used in this study addresses the potential for watercourses to benefit from<br />
alteration, based largely on the assumption that fish communities in degraded channels<br />
are likely to benefit from alterations that restore natural features, whereas fish<br />
March 2008 159 <strong>Fort</strong> <strong>Erie</strong> <strong>Creeks</strong> <strong>Watershed</strong> <strong>Plan</strong><br />
General Report (105116)
communities in natural channels with good quality habitat are less likely to benefit, and<br />
are more likely to be harmed, by alterations.<br />
It should be noted that while some reaches have a low integrated net constraint rating, they may<br />
still contain Type 2 habitat, and as such are considered ideal for enhancement or restoration<br />
projects. The net rating is important as a relative ranking tool, to compare all of the reaches.<br />
In the course of any project that has the potential to impact upon a watercourse, an appropriately<br />
detailed site-specific study will be required to address the concerns and requirements of DFO,<br />
MNR and the NPCA.<br />
5.3.2 Integrated Rating of Terrestrial Natural Heritage Systems<br />
Tables 5.3.4 to 5.3.14 summarize by subwatershed the terrestrial natural heritage status and<br />
targets, context, implications for natural heritage function and key issues. The wetland data is<br />
current as of June 2005; the natural cover data is current as of 2002; the EPA data uses the June<br />
2005 wetland data. (As MNR updates wetland boundaries, current status percentages for both<br />
wetlands and EPA may change.) Minimum guidelines for wetland, treed cover, riparian cover<br />
and interior forest are by percentage of the subwatershed and, along with largest forest patch,<br />
refer to Environment Canada (2004a) guidelines. Given the large extent of original wetland, the<br />
minimum guideline of 10% of the watershed as wetland is used over 6% of each subwatershed.<br />
The 18% guideline for protected area (EPA plus ECA) is the threshold for an “excellent” rating<br />
set by the <strong>Niagara</strong> Region Report Card. Guidelines for distribution of natural landscape types<br />
and slough mosaic among the 2002 natural areas use the proportions within the pre-settlement<br />
natural areas specific to each subwatershed. Targets were assigned as the additions to the<br />
2002/2005 status – both as percentage and hectares - needed to meet the guidelines; urban<br />
subwatersheds had some leniency to allow for infill development that helps maintain the natural<br />
areas in the nearby rural subwatersheds. The interior forest guideline for forest further than 200<br />
m from the forest edge was omitted because the road grid density makes this guideline<br />
unrealistic.<br />
It is strongly emphasized that all the guidelines are minimum generic guidelines for ecosystem<br />
function. The very high extent of pre-settlement wetland in the study area suggests that optimum<br />
functioning for this landscape will require considerably more than the 10% minimum guideline.<br />
Exceedance of the minimum guideline should not be interpreted as surplus wetland. All<br />
wetlands play important roles and should be protected. Protection is far easier, cheaper and more<br />
supportive of well-functioning systems than restoration once they have been converted.<br />
March 2008 160 <strong>Fort</strong> <strong>Erie</strong> <strong>Creeks</strong> <strong>Watershed</strong> <strong>Plan</strong><br />
General Report (105116)
TABLE 5.3.4:<br />
INTEGRATED RATING OF TERRESTRIAL NATURAL HERITAGE SYSTEMS<br />
BLACK CREEK<br />
Natural Area Form Minimum Guideline 2002/2005* Status Target Target area (ha)<br />
% wetland<br />
10<br />
15.5 OK<br />
% original wetland**<br />
Min. 32; Max 79.6<br />
% natural cover<br />
29.3<br />
- Aquatic<br />
- Beach/dunes<br />
- Prairie<br />
653 ha forest, largely<br />
- Shrub/Meadow or<br />
Marsh<br />
8.8<br />
covered by maturing<br />
shrub/meadows<br />
- Treed 30<br />
20.4 +9.5%<br />
Slough Mosaic 65.7 % (original %) 13.6% (loss of 79.2%) +54.5% of natural 1097 ha<br />
Largest Forest Patch 200 ha 2805+ OK<br />
% Forest Interior<br />
- > 100 m from edge<br />
- > 200 m from edge<br />
10%<br />
3.0<br />
+7% +481 ha<br />
5%<br />
0.5<br />
% riparian cover (30 m either<br />
side)<br />
75% 42.9 +32.1 186.3 ha<br />
i.e., 62.1 km (1-side)<br />
or 31 km (2-side)<br />
% Regional EPA 18%<br />
12.0 OK<br />
% Regional ECA<br />
11.5 OK<br />
Natural Landscapes<br />
Target (original) distribution<br />
73.6 fine soil lowland<br />
18.3 fine soil mesic<br />
4.8 alluvial<br />
0.7 Shallow mesic<br />
1.3 Shallow upland<br />
Tr Coarse mesic<br />
1.2 Organic<br />
79.9<br />
7.9<br />
8.3<br />
0.1<br />
0.9<br />
Tr<br />
2.8<br />
More fine soil mesic –<br />
though may happen via<br />
climate change<br />
Subwatershed Form<br />
Area<br />
Outfall<br />
Shape<br />
Topography<br />
Alterations since Settlement<br />
Shore<br />
Natural Area Distribution<br />
Function<br />
Habitat<br />
Water Protection<br />
Other<br />
Key Natural Heritage Issues<br />
Description<br />
6872.3 ha<br />
<strong>Niagara</strong> River<br />
Oval<br />
Flat with slight slopes at river valley. Very gentle east/west slope south of Humberstone Marsh<br />
Clearance for agriculture. Gradual addition of drains. Small built-up areas at Stevensville and Douglastown.<br />
Some natural areas mature, others relatively recent.<br />
None<br />
Well-distributed with large area at headwaters.<br />
Implications of Form on Function<br />
Good extent and better forest as matures. Needs more connections.<br />
Moderate. Some riparian. Good headwaters cover. Loss of much of slough mosaic flow moderation<br />
function.<br />
Fragmentation reducing habitat value<br />
Levelled slough mosaic reduces both diversity and flow moderation capacity<br />
Artificial drainage changed hydrology of some areas<br />
Lack of riparian buffers reduces corridors and raises susceptibility to pollution reaching streams<br />
Farm runoff causes sedimentation and nutrient loading to floodplain areas.<br />
Other Issues<br />
Numerous potential flood areas. A few erosion prone reaches.<br />
Increasing imperviousness at Stevensville.<br />
Critical fish habitat in lower portion, important in upper.<br />
* June 2005 for wetlands; December 2005 for Regional EPA and ECA; 2003 for Natural Cover; 2002 for Forest.<br />
** Maximum is sum of original lowland, alluvial and organic landscapes (where soil data). Minimum is sum of<br />
40% of original lowland + 40% of original alluvial landscape + 100% of original organic landscape to account for<br />
slough mosaic that is not all wetland.<br />
March 2008 161 <strong>Fort</strong> <strong>Erie</strong> <strong>Creeks</strong> <strong>Watershed</strong> <strong>Plan</strong><br />
General Report (105116)
TABLE 5.3.5:<br />
INTEGRATED RATING OF TERRESTRIAL NATURAL HERITAGE SYSTEMS<br />
BEAVER CREEK<br />
Natural Area Form<br />
Minimum Guideline<br />
2002/2005*<br />
Status<br />
Target<br />
Target area (ha)<br />
% wetland<br />
10<br />
14.5 OK<br />
% original wetland**<br />
Max. 50.2; Min. 20.1<br />
% natural cover<br />
29.7<br />
- Aquatic<br />
- Beach/dunes<br />
- Prairie<br />
- Shrub/Meadow or<br />
Marsh<br />
5.9<br />
- Treed 30<br />
23.9 +6.1 +212<br />
Slough Mosaic 16.0% (original %) 3.4 (loss of 79.1%) +12.3% of natural + 127<br />
Largest Forest Patch 200 ha 94.4 (without roads, OK<br />
>200 ha)<br />
% Forest Interior<br />
- > 100 m from edge 10%<br />
1.9<br />
+8.1% +282<br />
- > 200 m from edge 5%<br />
0.1<br />
% riparian cover (30 m either<br />
side)<br />
75% 51.3 +23.7% 70.2 ha<br />
i.e., 23.4 km (1-side)<br />
or 11.7 km (2-side)<br />
% Regional EPA 18% 11.7 OK, with ECA<br />
% Regional ECA 12.2 OK<br />
Natural Landscapes<br />
Subwatershed Form<br />
Area<br />
Outfall<br />
Shape<br />
Topography<br />
Alterations since Settlement<br />
Shore<br />
Natural Area Distribution<br />
Function<br />
Habitat<br />
Water Protection<br />
Other<br />
Key Natural Heritage Issues<br />
Target (original)<br />
Distribution<br />
40.1 fine soil lowland<br />
33.5 fine soil mesic<br />
10.1 alluvial<br />
5.9 Shallow mesic<br />
10.4 Shallow upland<br />
0.1 Coarse soil upland<br />
Description<br />
3478.9 ha<br />
Into Black Creek<br />
44.3<br />
18.1<br />
22.9<br />
5.8<br />
9.8<br />
0.0<br />
More mesic – though<br />
may happen via<br />
climate change<br />
Long and narrow, widening in the headwaters<br />
Bedrock ridge along east side and rise south of Hwy 3 at the golf course. Flat in south headwaters and<br />
downstream of tracks. Very gentle slopes elsewhere.<br />
Clearance and slough mosaic levelling. Drains especially at headwaters. More mature forest along middle<br />
reaches and in south headwaters. Agriculture is important.<br />
NA<br />
Good<br />
Implications of Form on Function<br />
Good creek corridor and linkage of Frenchman’s and Black across Beaver’s narrow point. Low potential for<br />
interior forest extension without farmland intrusion.<br />
Good riparian buffers for main stem. Some upper drains and tributaries not buffered. Areas shallow over<br />
bedrock have scattered coverage.<br />
Fragmentation reducing habitat value<br />
Levelled slough mosaic reducing both diversity and flow moderation capacity<br />
Farm runoff causing sediment and nutrient loading in floodplain areas<br />
Other Issues<br />
Flood potential in headwaters Outlet Drain. Erosion in headwaters. Spreading imperviousness in headwaters<br />
Critical fish habitat<br />
* June 2005 for wetlands; December 2005 for Regional EPA and ECA; 2003 for Natural Cover; 2002 for Forest.<br />
** Maximum is sum of original lowland, alluvial and organic landscapes (where soil data). Minimum is sum of<br />
40% of original lowland + 40% of original alluvial landscape + 100% of original organic landscape to account for<br />
slough mosaic that is not all wetland<br />
March 2008 162 <strong>Fort</strong> <strong>Erie</strong> <strong>Creeks</strong> <strong>Watershed</strong> <strong>Plan</strong><br />
General Report (105116)
TABLE 5.3.6:<br />
INTEGRATED RATING OF TERRESTRIAL NATURAL HERITAGE SYSTEMS<br />
BAKER CREEK<br />
Natural Area Form Minimum Guideline 2002/2005* Status Target Target area (ha)<br />
% wetland<br />
10%<br />
39.8 OK -<br />
% original wetland**<br />
Max. 80.9; Min. 32.4<br />
% natural cover<br />
72.7<br />
- Aquatic<br />
- Beach/dunes<br />
- Prairie<br />
- Shrub/Meadow or<br />
Marsh<br />
25.5<br />
- Treed 30%<br />
47.2 OK -<br />
Slough Mosaic 75.1 % (original %) 8.3 ( loss of 88.9%) +66.8% of natural +221<br />
Largest Forest Patch 200 ha 98.3 ha. Without roads, OK<br />
>200 ha<br />
% Forest Interior<br />
- > 100 m from edge 10%<br />
9.2<br />
+0.8% +3.6<br />
- > 200 m from edge 5%<br />
0.8<br />
% riparian cover (30 m either 75% 78.8 OK<br />
side)<br />
% Regional EPA 18%<br />
33.3 OK<br />
% Regional ECA<br />
21.3 OK<br />
Natural Landscape<br />
Target (original)<br />
Distribution<br />
82.5%<br />
OK<br />
78.9% fine soil lowland<br />
19.1% fine soil mesic<br />
2.0% alluvial<br />
15.8%<br />
1.8 %<br />
Subwatershed Form<br />
Description<br />
Area<br />
455.0 ha<br />
Outfall<br />
<strong>Niagara</strong> River<br />
Shape<br />
Oval<br />
Topography<br />
Flat, slight slope in north east<br />
Alterations since Settlement Levelled slough mosaic, drains including reversing a stream originally into Miller.<br />
Older forest in headwaters, more recent in lower basin and along creek<br />
Shore<br />
NA<br />
Natural Area Distribution Very good<br />
Function<br />
Implications of Form on Function<br />
Habitat<br />
High value, though lost some diversity where slough mosaic levelled<br />
Water Protection<br />
High value<br />
Other<br />
Potentially significant biota migration corridor for climate change adaptation. IBA<br />
Key Natural Heritage Issues Proposed golf course will possibly affect wetlands & interrupt important corridor. OMB will assess<br />
Other Issues<br />
Flood potential at mouth. Spread of imperviousness in east drain.<br />
Critical fish habitat. Natural Areas Inventory found unevaluated wetland.<br />
* June 2005 for wetlands; December 2005 for Regional EPA and ECA; 2003 for Natural Cover; 2002 for Forest.<br />
** Maximum is sum of original lowland, alluvial and organic landscapes (where soil data). Minimum is sum of<br />
40% of original lowland + 40% of original alluvial landscape + 100% of original organic landscape to account for<br />
slough mosaic that is not all wetland.<br />
March 2008 163 <strong>Fort</strong> <strong>Erie</strong> <strong>Creeks</strong> <strong>Watershed</strong> <strong>Plan</strong><br />
General Report (105116)
TABLE 5.3.7:<br />
INTEGRATED RATING OF TERRESTRIAL NATURAL HERITAGE SYSTEMS<br />
MILLER CREEK<br />
Natural Area Form Minimum Guideline 2002/2005* Status Target Target area (ha)<br />
% wetland<br />
10<br />
22.3 OK<br />
% original wetland**<br />
Max. 60.3; Min. 24.1<br />
% natural cover<br />
46.0<br />
- Aquatic<br />
- Beach/dunes<br />
- Prairie<br />
- Shrub/Meadow or<br />
17.1<br />
Marsh<br />
OK with shrub<br />
- Treed 30<br />
28.8<br />
succession<br />
Slough Mosaic 53.9% (original %) 9.7% (loss of 82.0%) 44.2% of natural +162 ha<br />
Largest Forest Patch 200 ha 98.0 200 ha + 102 ha<br />
% Forest Interior<br />
- > 100 m from edge<br />
- > 200 m from edge<br />
10%<br />
5.6<br />
+4.4% + 35 ha<br />
5%<br />
0.5<br />
% riparian cover (30 m either side) 75% 62.9 + 12.1% +11 ha<br />
i.e., 3.5 km (1-side) or<br />
1.7 km (2-side)<br />
% Regional EPA 18%<br />
20.5 OK<br />
% Regional ECA<br />
20.1 OK<br />
Natural Landscapes<br />
Target (original)<br />
Distribution<br />
57.8 fine soil lowland<br />
18.7 fine soil mesic<br />
2.5 alluvial<br />
64.1<br />
20.8<br />
4.6<br />
More shallow mesic –<br />
though may happen via<br />
climate change<br />
14.9 Shallow mesic<br />
3.6 Shallow upland<br />
1.2 Coarse soil mesic<br />
1.2 Coarse soil upland<br />
5.0<br />
3.6<br />
0.9<br />
1.0<br />
Subwatershed Form<br />
Description<br />
Area<br />
795.5 ha<br />
Outfall<br />
<strong>Niagara</strong> River<br />
Shape<br />
Very broad arc<br />
Topography<br />
Alterations since Settlement<br />
Shore<br />
Natural Area Distribution<br />
Function<br />
Habitat<br />
Water Protection<br />
Other<br />
Key Natural Heritage Issues<br />
Flat at headwaters and lower portions. Very gently sloping across mid section around RR.<br />
Cleared and slough mosaic levelled for agriculture. For decades, crossed by QEW, RR and hydro. A<br />
tributary was altered to flow to Baker Creek. Little development. Some forests are more mature, others<br />
regenerated in last few decades.<br />
No lake shore<br />
Headwaters have less<br />
Implications of Form on Function<br />
Good habitat with potential to improve still more<br />
Good riparian cover. Little cover of recharge areas.<br />
Areas in lower subwatershed part of potentially important <strong>Niagara</strong> R. corridor<br />
Levelled slough mosaic<br />
QEW bisects subwatershed.<br />
Auto wrecker and dump<br />
Other Issues<br />
Several potential flood damage areas. Erosion in mid reaches<br />
Increasing imperviousness<br />
Critical fish habitat<br />
* June 2005 for wetlands; December 2005 for Regional EPA and ECA; 2003 for Natural Cover; 2002 for Forest.<br />
** Maximum is sum of original lowland, alluvial and organic landscapes (where soil data). Minimum is sum of<br />
40% of original lowland + 40% of original alluvial landscape + 100% of original organic landscape to account for<br />
slough mosaic that is not all wetland.<br />
March 2008 164 <strong>Fort</strong> <strong>Erie</strong> <strong>Creeks</strong> <strong>Watershed</strong> <strong>Plan</strong><br />
General Report (105116)
TABLE 5.3.8:<br />
INTEGRATED RATING OF TERRESTRIAL NATURAL HERITAGE SYSTEMS<br />
NIAGARA RIVER SHORE<br />
Natural Area Form Minimum Guideline 2002/2005* Status Target Target area (ha)<br />
% wetland<br />
10<br />
15.8 OK<br />
% original wetland**<br />
Max. 72; Min. 28.8<br />
% natural cover<br />
49.0<br />
- Aquatic<br />
- Beach/dunes<br />
- Prairie<br />
- Shrub/Meadow or<br />
21.7<br />
Marsh<br />
OK with shrub<br />
- Treed 30<br />
27.4<br />
succession<br />
Slough Mosaic 54.1% (original %) 14.5% (loss of 73.3%) + 39.6% of natural + 68 ha<br />
Largest Forest Patch 200 ha 85.5 OK – hard to expand<br />
given elongated shape<br />
% Forest Interior<br />
- > 100 m from edge<br />
- > 200 m from edge<br />
% riparian cover (30 m either<br />
side)<br />
10%<br />
5%<br />
3.1<br />
0.1<br />
OK – hard to expand<br />
given elongated shape<br />
75% 51.6 23.4% 7 ha<br />
i.e., 2.2 km (1 side)<br />
or 1.1 km (2-side)<br />
18%<br />
37.8 OK<br />
% Regional EPA 12.0 OK<br />
% Regional ECA<br />
Natural Landscapes<br />
Target (original)<br />
Distribution<br />
71.6 fine soil lowland 85.1<br />
28.1 fine soil mesic<br />
14.6<br />
0.4 alluvial<br />
0.3<br />
Subwatershed Form<br />
Area<br />
Outfall<br />
Shape<br />
Topography<br />
Alterations since Settlement<br />
Shore<br />
Natural Area Distribution<br />
Function<br />
Habitat<br />
Water Protection<br />
Other<br />
Key Natural Heritage Issues<br />
Other Issues<br />
More fine soil mesic<br />
areas – though may<br />
happen via climate<br />
change<br />
Description<br />
349.4 ha<br />
<strong>Niagara</strong> River – several very small streams<br />
Long, narrow and irregular along River.<br />
Flat<br />
Cleared for agriculture and slough mosaic levelled. In recent decades, gradual spread of both forest<br />
regeneration and riverside residences.<br />
No lake shore (though long River shore)<br />
Fairly well distributed. Most natural area in <strong>Niagara</strong> 19 but it’s also the biggest.<br />
Implications of Form on Function<br />
Good.<br />
Moderate. Good “inland” riparian coverage.<br />
Part of the potentially important <strong>Niagara</strong> River corridor<br />
Levelled slough mosaic<br />
Most areas separated from River connection by Parkway and strip of houses.<br />
Important fish habitat in <strong>Niagara</strong> 19. Natural Areas Inventory found unevaluated wetlands.<br />
* June 2005 for wetlands; December 2005 for Regional EPA and ECA; 2003 for Natural Cover; 2002 for Forest.<br />
** Maximum is sum of original lowland, alluvial and organic landscapes (where soil data). Minimum is sum of<br />
40% of original lowland + 40% of original alluvial landscape + 100% of original organic landscape to account for<br />
slough mosaic that is not all wetland.<br />
March 2008 165 <strong>Fort</strong> <strong>Erie</strong> <strong>Creeks</strong> <strong>Watershed</strong> <strong>Plan</strong><br />
General Report (105116)
% wetland<br />
% original wetland**<br />
TABLE 5.3.9:<br />
INTEGRATED RATING OF TERRESTRIAL NATURAL HERITAGE SYSTEMS<br />
FRENCHMAN’S CREEK<br />
Natural Area Form Minimum Guideline 2002/2005* Status Target Target area (ha)<br />
10<br />
18.8 OK<br />
Max. 67.6; Min. 27 (coarse<br />
estimates, much missing<br />
data)<br />
% natural cover<br />
- Aquatic<br />
- Beach/dunes<br />
- Prairie<br />
- Shrub/Meadow or<br />
Marsh<br />
- Treed 30<br />
36.5<br />
13.8<br />
126 ha forest largely<br />
covered by maturing<br />
shrub/meadows<br />
22.6 +7.3%<br />
Slough Mosaic 28.2 % (original %) 8.5% (loss of 69.8%) +20% of natural 126 ha<br />
Largest Forest Patch 200 ha 117.4 ha 200 ha +82 ha: if let shrub<br />
mature & ignore roads,<br />
very little new area<br />
needed<br />
% Forest Interior<br />
- > 100 m from edge 10%<br />
6.2<br />
+3.8% +65 ha, possible as<br />
- > 200 m from edge 5%<br />
1.8<br />
shrub matures<br />
% riparian cover (30 m either<br />
side)<br />
75% 58.3 +16.7% 24.0 ha<br />
i.e., 8 km (1-side) or<br />
4 km (2-side)<br />
% Regional EPA 18%<br />
16.6 OK<br />
% Regional ECA<br />
20.0 OK<br />
Natural Landscapes<br />
Target (original)<br />
Distribution<br />
61.6 fine soil lowland<br />
20.1 fine soil mesic<br />
64.1<br />
19.8<br />
Add to coarse soil<br />
upland<br />
6.0 alluvial<br />
0.8 Shallow lowland<br />
6.9 Shallow mesic<br />
2.2 Shallow upland<br />
2.3 Coarse soil upland<br />
10.1<br />
0.5<br />
2.7<br />
2.4<br />
0.5<br />
Subwatershed Form<br />
Description<br />
Area<br />
1723.5 ha<br />
Outfall<br />
<strong>Niagara</strong> River<br />
Shape<br />
Sideways L<br />
Topography<br />
Flat headwaters. Base of L has some gentle slopes esp. along creek valley<br />
Alterations since Settlement Clearing for agriculture. Drain extensions in headwaters. Development and golf courses in corner of the L.<br />
Quarry in headwaters pumping water.<br />
Shore<br />
No lake shore<br />
Natural Area Distribution Well-distributed. Less at L corner. More near mouth.<br />
Function<br />
Implications of Form on Function<br />
Habitat<br />
Good habitat especially as mature though lost some diversity where slough mosaic levelled.<br />
Water Protection<br />
Good though lost some flow moderation capacity where slough mosaic levelled.<br />
Other<br />
Lower watershed part of potentially significant corridor for biota migration in response to climate change.<br />
IBA<br />
Key Natural Heritage Issues Levelled slough mosaic<br />
QEW bisects subwatershed.<br />
Urban expansion in corner of L.<br />
Other Issues<br />
Erosion along reaches below quarry and below tracks.<br />
Main stem is critical fish habitat<br />
* June 2005 for wetlands; December 2005 for Regional EPA and ECA; 2003 for Natural Cover; 2002 for Forest.<br />
** Maximum is sum of original lowland, alluvial and organic landscapes (where soil data). Minimum is sum of<br />
40% of original lowland + 40% of original alluvial landscape + 100% of original organic landscape to account for<br />
slough mosaic that is not all wetland.<br />
March 2008 166 <strong>Fort</strong> <strong>Erie</strong> <strong>Creeks</strong> <strong>Watershed</strong> <strong>Plan</strong><br />
General Report (105116)
TABLE 5.3.10:<br />
INTEGRATED RATING OF TERRESTRIAL NATURAL HERITAGE SYSTEMS<br />
FORT ERIE<br />
Natural Area Form Minimum Guideline 2002/2005* Status Target Target area (ha)<br />
% wetland<br />
10<br />
0 OK: urban<br />
% original wetland**<br />
Inadequate data<br />
% natural cover<br />
3.2<br />
- Aquatic<br />
- Beach/dunes<br />
0.1<br />
- Prairie<br />
- Shrub/Meadow or<br />
Marsh<br />
2.2<br />
- Treed 30<br />
1.0 OK: urban<br />
Slough Mosaic<br />
Inadequate data<br />
Largest Forest Patch 200 ha 7.1 OK: urban<br />
% Forest Interior<br />
- > 100 m from edge 10%<br />
0<br />
OK: urban<br />
- > 200 m from edge 5%<br />
0<br />
% riparian cover (30 m either 75% NA NA<br />
side)<br />
% Regional EPA 18%<br />
0 OK: urban<br />
% Regional ECA<br />
5.5 OK: urban<br />
Natural Landscapes<br />
Target (original)<br />
Distribution<br />
83.5 fine soil lowland 79.5<br />
OK<br />
16.5 fine soil mesic 20.5<br />
Subwatershed Form<br />
Description<br />
Area<br />
397.5 ha<br />
Outfall<br />
No clear streams but runoff to <strong>Niagara</strong> River<br />
Shape<br />
Oblong<br />
Topography<br />
Some moderate slopes down to the river but largely gently sloping<br />
Alterations since Settlement Complete natural area removal for built-up.<br />
Shore<br />
No lake shore.<br />
Natural Area Distribution<br />
Very scattered<br />
Function<br />
Implications of Form on Function<br />
Habitat<br />
Very little habitat<br />
Water Protection<br />
Very little water protection, though not a critical need other than for <strong>Niagara</strong> River<br />
Other<br />
Very little microclimate moderation<br />
Key Natural Heritage Issues Natural area absence. Intensified built-up in <strong>Fort</strong> <strong>Erie</strong> area, however, helps maintain natural area in other<br />
subwatersheds.<br />
* June 2005 for wetlands; December 2005 for Regional EPA and ECA; 2003 for Natural Cover; 2002 for Forest.<br />
** Maximum is sum of original lowland, alluvial and organic landscapes (where soil data). Minimum is sum of<br />
40% of original lowland + 40% of original alluvial landscape + 100% of original organic landscape to account for<br />
slough mosaic that is not all wetland.<br />
March 2008 167 <strong>Fort</strong> <strong>Erie</strong> <strong>Creeks</strong> <strong>Watershed</strong> <strong>Plan</strong><br />
General Report (105116)
TABLE 5.3.11:<br />
INTEGRATED RATING OF TERRESTRIAL NATURAL HERITAGE SYSTEMS<br />
LAKESHORE<br />
Natural Area Form<br />
Minimum<br />
Guideline<br />
2002/2005* Status Target Target area (ha)<br />
% wetland<br />
10<br />
10.8 OK<br />
% original wetland**<br />
Max. 96.7;<br />
Min. 38.7<br />
(very coarse<br />
estimates,<br />
much missing<br />
data)<br />
% natural cover<br />
23.9<br />
- Aquatic<br />
- Beach/dunes<br />
4.6<br />
- Prairie<br />
- Shrub/Meadow or Marsh<br />
1.8<br />
- Treed<br />
30<br />
22.9 OK for urban<br />
Slough Mosaic<br />
Inadequate<br />
data<br />
Largest Forest Patch 200 ha 39.1 OK for urban<br />
% Forest Interior<br />
- > 100 m from edge 10%<br />
0.7<br />
OK for urban<br />
- > 200 m from edge 5%<br />
0<br />
% riparian cover (30 m either side) 75% 36.3 but very little OK for urban<br />
streams<br />
% Regional EPA 18% 5.5 OK, with ECA<br />
% Regional ECA 26.7 OK<br />
Natural Landscapes<br />
Target<br />
(original)<br />
Distribution 98.5<br />
OK<br />
96.6 fine soil<br />
lowland<br />
0.1 alluvial<br />
3.3 Coarse soil<br />
upland<br />
0<br />
1.5<br />
Subwatershed Form<br />
Description<br />
Area 364.4<br />
Outfall<br />
Lake <strong>Erie</strong> but little stream length<br />
Shape<br />
Broad arc<br />
Topography<br />
Flat inland. Short slopes near shore<br />
Alterations since Settlement<br />
Cleared for fort and agriculture. In last 4 decades both some development and forest regeneration.<br />
Shore<br />
Approx. 5 km<br />
Natural Area Distribution<br />
Concentrated.<br />
Function<br />
Implications of Form on Function<br />
Habitat<br />
Good for an urban area.<br />
Water Protection<br />
Minor role<br />
Other<br />
Microclimate moderation for residents<br />
Key Natural Heritage Issues<br />
Development – esp. scattered, low density – increases fragmentation and spreads adverse effects.<br />
Shoreline development removes rare coastal habitats.<br />
Differing wetland estimates<br />
* June 2005 for wetlands; December 2005 for Regional EPA and ECA; 2003 for Natural Cover; 2002 for Forest.<br />
** Maximum is sum of original lowland, alluvial and organic landscapes (where soil data). Minimum is sum of<br />
40% of original lowland + 40% of original alluvial landscape + 100% of original organic landscape to account for<br />
slough mosaic that is not all wetland.<br />
March 2008 168 <strong>Fort</strong> <strong>Erie</strong> <strong>Creeks</strong> <strong>Watershed</strong> <strong>Plan</strong><br />
General Report (105116)
TABLE 5.3.12:<br />
INTEGRATED RATING OF TERRESTRIAL NATURAL HERITAGE SYSTEMS<br />
KRAFT DRAIN<br />
Natural Area Form Minimum Guideline 2002/2005* Status Target Target area (ha)<br />
% wetland<br />
10<br />
38.2 OK<br />
% original wetland**<br />
Max. 77.1; Min. 30.8<br />
% natural cover<br />
62.7<br />
- Aquatic<br />
- Beach/dunes<br />
- Prairie<br />
- Shrub/Meadow or<br />
Marsh<br />
19.9<br />
- Treed 30<br />
42.8 OK<br />
Slough Mosaic 41.4 % (original %) 0.9% (loss of 97.8%) + 40.5% of natural + 141 ha<br />
Largest Forest Patch 200 ha 103.7 OK for near-urban area<br />
% Forest Interior<br />
- > 100 m from edge 10%<br />
11.8<br />
OK<br />
- > 200 m from edge 5%<br />
1.9<br />
% riparian cover (30 m either 75% 91.7 OK<br />
side)<br />
% Regional EPA 18%<br />
27.4 OK<br />
% Regional ECA<br />
24.7 OK<br />
Natural Landscapes<br />
Subwatershed Form<br />
Area<br />
Outfall<br />
Shape<br />
Topography<br />
Alterations since Settlement<br />
Shore<br />
Natural Area Distribution<br />
Function<br />
Habitat<br />
Water Protection<br />
Other<br />
Key Natural Heritage Issues<br />
Target (original)<br />
Distribution<br />
71.1 fine soil lowland<br />
22.9 fine soil mesic<br />
6.0 alluvial<br />
Tr Coarse soil upland<br />
Description<br />
554.7 ha<br />
Lake <strong>Erie</strong><br />
Rounded square<br />
73.0<br />
19.5<br />
7.5<br />
0<br />
Flat. A very gentle slope around Garrison Road<br />
Cleared and slough mosaic levelled for agriculture. Regenerated in last few decades. Scattered development.<br />
Drains in last 25 years.<br />
A short extent (approx. 0.5 km)<br />
Well distributed. A little more sparse in north east toward <strong>Fort</strong> <strong>Erie</strong> built-up<br />
Implications of Form on Function<br />
Very good and will improve as matures<br />
Very good<br />
Microclimate moderation for residents<br />
Levelled slough mosaic reduces both diversity and flow moderation capacity<br />
Artificial drainage changed hydrology of some areas<br />
Development – esp. scattered, low density – increases fragmentation and spreads adverse effects.<br />
Shoreline development removes rare coastal habitats.<br />
Other Issues<br />
Both erosion and flood potential<br />
Increasing imperviousness.<br />
Natural Areas Inventory found unevaluated wetlands.<br />
* June 2005 for wetlands; December 2005 for Regional EPA and ECA; 2003 for Natural Cover; 2002 for Forest.<br />
** Maximum is sum of original lowland, alluvial and organic landscapes (where soil data). Minimum is sum of<br />
40% of original lowland + 40% of original alluvial landscape + 100% of original organic landscape to account for<br />
slough mosaic that is not all wetland.<br />
OK<br />
March 2008 169 <strong>Fort</strong> <strong>Erie</strong> <strong>Creeks</strong> <strong>Watershed</strong> <strong>Plan</strong><br />
General Report (105116)
TABLE 5.3.13:<br />
INTEGRATED RATING OF TERRESTRIAL NATURAL HERITAGE SYSTEMS<br />
BERTIE BAY + LAKE ERIE 1<br />
Natural Area Form Minimum Guideline 2002/2005* Status Target Target area (ha)<br />
% wetland<br />
10<br />
15.4 OK<br />
% original wetland**<br />
Max. 58.7; Min. 23.5<br />
% natural cover<br />
42.4<br />
- Aquatic<br />
1.1<br />
- Beach/dunes<br />
- Prairie<br />
0.1<br />
- Shrub/Meadow or<br />
Marsh<br />
16.7<br />
As shrub matures,<br />
more forest will grow<br />
- Treed 30<br />
24.5 OK: urban<br />
Slough Mosaic 29.5% (original %) 1.4 (loss of 95.1%) +28.2% of natural 104 ha<br />
Largest Forest Patch 200 ha 54.5 ha OK for urban and<br />
roads<br />
% Forest Interior<br />
- > 100 m from edge 10%<br />
3.4<br />
+1.6% 14 ha<br />
- > 200 m from edge 5%<br />
0.1<br />
% riparian cover (30 m either side) 75% 83.7 OK<br />
% Regional EPA 18%<br />
1.9 More along shore<br />
% Regional ECA<br />
38.8 OK<br />
Natural Landscapes<br />
Subwatershed Form<br />
Area<br />
Outfall<br />
Shape<br />
Topography<br />
Alterations since Settlement<br />
Shore<br />
Natural Area Distribution<br />
Function<br />
Habitat<br />
Water Protection<br />
Other<br />
Key Natural Heritage Issues<br />
Target (original)<br />
Distribution<br />
57.5 fine soil lowland<br />
17.2 fine soil mesic<br />
1.2 shallow lowland<br />
7.4 Shallow mesic<br />
16.1 Shallow upland<br />
0.5 Coarse soil upland<br />
Description<br />
868.3 ha<br />
Lake <strong>Erie</strong><br />
Triangular with long shoreline<br />
70.5<br />
7.9<br />
1.8<br />
8.0<br />
11.7<br />
0.1<br />
more fine soil mesic,<br />
shallow upland and<br />
coarse soil upland<br />
Very gently sloping towards L. <strong>Erie</strong>. Flat at apex tip and within approx. 1 km of lake except for very steep<br />
dunes along shore.<br />
Almost all cleared and most natural areas are immature recent growth. No obvious natural stream but several<br />
drains including to quarry ponds. Partially built up 70 years ago. Development concentrated in Crescent<br />
Park and shore. Very little agriculture remains.<br />
Important feature. Will extend as lake levels down.<br />
Well-distributed with the exception of Crescent Park and shore<br />
Implications of Form on Function<br />
Moderate due to good extent. Important shore habitats degraded.<br />
Moderate. Drains well protected but relatively short. Some recharge areas protected<br />
Levelled slough mosaic reduces both diversity and flow moderation capacity<br />
Artificial drainage changed hydrology of some areas<br />
Development – esp. scattered, low density – increases fragmentation and spreads adverse effects.<br />
Shoreline development removes rare coastal habitats.<br />
Other Issues<br />
Increasing imperviousness in southwest corner.<br />
Natural Areas Inventory found unevaluated wetlands.<br />
* June 2005 for wetlands; December 2005 for Regional EPA and ECA; 2003 for Natural Cover; 2002 for Forest.<br />
** Maximum is sum of original lowland, alluvial and organic landscapes (where soil data). Minimum is sum of<br />
40% of original lowland + 40% of original alluvial landscape + 100% of original organic landscape to account for<br />
slough mosaic that is not all wetland.<br />
March 2008 170 <strong>Fort</strong> <strong>Erie</strong> <strong>Creeks</strong> <strong>Watershed</strong> <strong>Plan</strong><br />
General Report (105116)
TABLE 5.3.14:<br />
INTEGRATED RATING OF TERRESTRIAL NATURAL HERITAGE SYSTEMS<br />
SIX MILE CREEK<br />
Natural Area Form Minimum Guideline 2002/2005* Status Target Target area (ha)<br />
% wetland<br />
10<br />
13.8 OK<br />
% original wetland**<br />
Max. 56.9; Min. 22.8<br />
% natural cover<br />
39.3<br />
- Aquatic<br />
- Beach/dunes<br />
- Prairie<br />
0.7<br />
- Shrub/Meadow or<br />
15.4<br />
Marsh<br />
OK with shrub succession<br />
- Treed 30<br />
23.1<br />
Slough Mosaic 20.2 % (original %) 1.1% (loss of 94.7%) + 19.1% of natural +136 ha<br />
Largest Forest Patch 200 ha 85.4 OK for urban<br />
% Forest Interior<br />
- > 100 m from edge<br />
- > 200 m from edge<br />
10%<br />
2.2<br />
OK for urban<br />
5%<br />
0<br />
% riparian cover (30 m either<br />
side)<br />
75% 69.4 +5.6% + 12 ha<br />
i.e., 4 km (1-side) or<br />
2 km (2-side)<br />
% Regional EPA 18% 12.0 OK<br />
% Regional ECA 19.7 OK<br />
Natural Landscapes<br />
Target (original) Distribution<br />
43.5 fine soil lowland<br />
21.9 fine soil mesic<br />
8.6 alluvial<br />
4.8 Shallow lowland<br />
9.0 Shallow mesic<br />
12.1 Shallow upland<br />
0.2 Coarse soil upland<br />
47.4<br />
12.3<br />
14.7<br />
7.1<br />
5.9<br />
12.6<br />
tr<br />
More fine soil mesic areas<br />
– though may happen via<br />
climate change<br />
Subwatershed Form<br />
Area<br />
Outfall<br />
Shape<br />
Topography<br />
Alterations since Settlement<br />
Shore<br />
Natural Area Distribution<br />
Function<br />
Habitat<br />
Water Protection<br />
Other<br />
Key Natural Heritage Issues<br />
Other Issues<br />
Description<br />
1813.4 ha<br />
Lake <strong>Erie</strong><br />
Slightly stretched square<br />
Flat through middle. Gentle slopes on either side, esp. to west<br />
Cleared for agriculture. Drains extended gradually. Older developments towards headwaters. Thunder Bay<br />
and near shore areas developed in more recent decades. Gradual spread of regenerating forest in recent<br />
decades.<br />
Approx. 2 ½ km<br />
Moderately well distributed. Gaps in built-up areas and headwaters.<br />
Implications of Form on Function<br />
Good inland habitat but could improve linkage to north and west<br />
Good riparian cover<br />
Artificial drainage changed hydrology of some areas<br />
Development – esp. scattered, low density – increases fragmentation and spreads adverse effects.<br />
Shoreline development removes rare coastal habitats.<br />
Levelled slough mosaic reduces both diversity and flow moderation capacity<br />
Several potential flood damage areas throughout the subwatershed<br />
Increasing imperviousness<br />
Short eroding reaches<br />
Critical fish habitat<br />
* June 2005 for wetlands; December 2005 for Regional EPA and ECA; 2003 for Natural Cover; 2002 for Forest.<br />
** Maximum is sum of original lowland, alluvial and organic landscapes (where soil data). Minimum is sum of<br />
40% of original lowland + 40% of original alluvial landscape + 100% of original organic landscape to account for<br />
slough mosaic that is not all wetland.<br />
March 2008 171 <strong>Fort</strong> <strong>Erie</strong> <strong>Creeks</strong> <strong>Watershed</strong> <strong>Plan</strong><br />
General Report (105116)
5.4 Local Subwatershed Opportunities<br />
Each subwatershed, as depicted on Figures LO (Local Opportunities) 1.1 to 11.1, has been<br />
assessed on the basis of local (physical) constraints and opportunities. These opportunities have<br />
been organized on the basis of various categories, for both urban and non-urban areas. Table<br />
5.4.1 provides a general summary of various opportunities related to generic watershed systems.<br />
Category<br />
TABLE 5.4.1:<br />
SUMMARY OF LOCAL OPPORTUNITIES<br />
Land Use<br />
Urban<br />
Groundwater • Terms of Reference for future studies<br />
• Septic standard upgrade to tertiary treatment<br />
• Minimum lot size for private services<br />
(i.e. 1 acre)<br />
• Manmade wetlands for stormwater<br />
management<br />
• Passive lot infiltration<br />
Watercourses<br />
(erosion, fisheries)<br />
Flooding<br />
(infrastructure,<br />
floodplain)<br />
• Determine stable parameters<br />
• Restoration activities (watercourse form and<br />
habitat, vegetative riparian buffers)<br />
• Remove of barriers to fish movement<br />
• Uses development funding<br />
• Increase capacity of culverts<br />
• Increase capacity of bridges<br />
• Upgrade trunk sewers<br />
• Delineate floodplains; flood-proof damage<br />
centres<br />
Water Quality • Provide water quality treatment to new<br />
development<br />
• Retrofit existing development<br />
• Locate and treat point source pollutant sources<br />
• Educate public regarding nutrient use, such as<br />
fertilizers – note elevated levels of<br />
phosphorous recorded in Black Creek and<br />
Frenchman’s Creek<br />
• Continue to educate public regarding potential<br />
for E. coli pollution<br />
Stormwater Management • Determine and set flooding target/criteria<br />
• Set erosion control targets<br />
• Optimize siting of new and retrofit facilities<br />
• Determine implementation and funding<br />
mechanisms<br />
Natural Heritage System • Protect – EPAs, LSAs, riparian, function of<br />
ECAs.<br />
• Encourage infill development in non-natural<br />
areas, and, if necessary, natural areas that are<br />
not classified as one of the above<br />
• Protect emerging coastal corridor as lake down<br />
• Protection actions specific to Subwatershed<br />
needs<br />
• Enhance: by slough mosaic replacement if<br />
feasible opportunity in non-EPA, immature,<br />
poorly drained, levelled lacustrine site with<br />
potential downstream flooding<br />
• Restore: riparian and lake shoreline sites as<br />
opportunity. Also street plantings, green roofs,<br />
roadside swales<br />
• Investigate options for owners of natural areas<br />
to be compensated for maintaining green<br />
infrastructure<br />
Non-Urban<br />
• Passive lot infiltration<br />
• Innovative source water management<br />
• Septic standard upgrade<br />
• Maintain Municipal drain in an environmentally<br />
sustainable manner<br />
• Farm Best Management Practices<br />
• Stewardship<br />
• Repair degraded creeks, drains<br />
• Remove barriers to fish movement<br />
• Improve water quality<br />
• Restoration opportunities (watercourse form and habitat,<br />
vegetative riparian buffers)<br />
• Stewardship involvement, including Non-Government<br />
organizations<br />
• Delineate floodplains; flood-proof damage centres<br />
• Prevent future development in hazard lands<br />
• Locate and treat point source pollutant generators<br />
• Educate public regarding nutrient use, such as fertilizers<br />
– note elevated levels of phosphorous recorded in Black<br />
Creek and Frenchman’s Creek<br />
• Continue to educate public regarding potential for E.<br />
coli pollution<br />
• Improve agricultural drainage<br />
• Maintain Municipal drain in an environmentally<br />
sustainable manner<br />
• Preserve: where very high natural area extent and<br />
function and low level of concern for issues (e.g., Baker)<br />
• Protect – discourage urban uses and if development<br />
occurs, encourage cluster development and avoid EPAs ,<br />
ECAs and LSAs<br />
• Protect emerging coastal corridor if lake draws down<br />
due to climate change<br />
• Protection actions specific to subwatershed needs<br />
• Enhance: by slough mosaic replacement if feasible<br />
opportunity in immature, non-EPA, poorly drained,<br />
levelled lacustrine site with potential downstream<br />
flooding. Priority near drains or high % levelled<br />
• Restore along corridors, riparian areas, steep slopes,<br />
dunes, vulnerable recharge areas, irregular gaps – all<br />
avoiding best farmland with the exception of compact<br />
riparian buffers and site options beyond the watershed<br />
plan’s resolution.<br />
• Investigate growing willow for ethanol, on non-natural<br />
areas<br />
March 2008 172 <strong>Fort</strong> <strong>Erie</strong> <strong>Creeks</strong> <strong>Watershed</strong> <strong>Plan</strong><br />
General Report (105116)
The local management opportunities related to each primary category have been developed on<br />
the following premises:<br />
Groundwater Management<br />
In order to refine hydrogeological characteristics on a local scale, as compared to the current<br />
more regional and intermediate scale assessment, detailed site specific groundwater studies will<br />
be required to be carried out for site specific developments by the proponent’s consultant. These<br />
studies would confirm or refine the existing hydrogeological sensitivity within the context of the<br />
regional understanding. More specifically these studies would refine, on a site-specific scale, the<br />
groundwater flow system with respect quantity and location of recharge, subsurface flow and<br />
linkages of the groundwater to the aquatic (i.e. discharge) and terrestrial systems, and aquifer<br />
sensitivity with respect to private and municipal use. These site-specific studies would provide<br />
the technical information for specific design of locally-based BMP’s to provide appropriate<br />
levels of groundwater quality and quantity protection (i.e. maintaining or enhancing baseflow,<br />
providing acceptable quality recharge) or provide direction to refine the overall site specific<br />
development density and/or design.<br />
Generic Terms of Reference and guidelines for these site-specific hydrogeological studies are<br />
offered in Appendix ‘SW-E’.<br />
Watercourse Systems<br />
Those watercourses which due to their existing or potential significance are deemed important,<br />
have been defined as remaining open. Where realignment opportunities exist, this process has<br />
not defined any alternatives due to the lack of any locally-specific land use directives at this time<br />
or lack of sufficient topographic detail.<br />
It is expected that subsequent planning processes (i.e. Secondary <strong>Plan</strong>s and Tertiary land use<br />
plans) will provide the necessary input to direct where, and to what extent, watercourse<br />
realignment (both vertically and horizontally) will be required.<br />
Where watercourse works are proposed, the natural storage-discharge relationship of the<br />
watercourse must be replicated (or exceeded) as closely as possible.<br />
A Table has been prepared for each Subwatershed to describe:<br />
a) Stable stream beltwidth<br />
b) Existing watercourse slope<br />
c) An estimate of the existing 2-year and 100-year Regulatory flow to establish an<br />
approximate floodplain width for planning purposes (notwithstanding, reaches where the<br />
Regulatory floodline mapping has been prepared and would govern).<br />
Fisheries<br />
Many of the watercourses within the study area have largely retained their natural attributes, due<br />
mainly to the flat topography and poorly drained soil conditions that result in swampy conditions<br />
surrounding them, which has discouraged agricultural and residential encroachment. These same<br />
March 2008 173 <strong>Fort</strong> <strong>Erie</strong> <strong>Creeks</strong> <strong>Watershed</strong> <strong>Plan</strong><br />
General Report (105116)
ase conditions have almost eliminated the incidence of barriers to fish movement. The drying<br />
of watercourses during the summer months is also not an important issue within the study area.<br />
Some localized degradation of fish habitat within the study area can reasonably be attributed to<br />
the historical alteration of watercourses (deepened and/or straightened) to either drain land for<br />
agriculture or to facilitate the construction of transportation routes. In some areas this has also<br />
resulted in a lack of appropriate riparian vegetation.<br />
With these existing conditions, the opportunities for fish habitat improvement within each<br />
subwatershed area mainly focus upon the rehabilitation of degraded channels and the<br />
enhancement or establishment of appropriate vegetative buffers. These are:<br />
• Where watercourses have been straightened but the original meandering channels still<br />
persist, an opportunity exists to re-establish the watercourse within these old channels to<br />
provide more aquatic habitat within a natural channel.<br />
• Other straightened watercourses can be rehabilitated using natural channel design<br />
principles. This will likely happen concurrently with the development of adjacent lands,<br />
but may be the result of government, NGO, or private initiatives aimed at habitat<br />
restoration.<br />
• Riparian vegetative buffers should be established or enhanced where they are presently<br />
inadequate.<br />
Natural Heritage System<br />
The Natural Heritage System is presented on Figure NH8. The figure is intended for general and<br />
broad-scale illustration purposes only. More site-specific planning should: refer to any data<br />
updates, follow the protection designations and policies of the Regional and Municipal Official<br />
<strong>Plan</strong>s, be compatible with provincial policy, <strong>Niagara</strong> Parks Commission mandate and any<br />
applicable provincial plans.<br />
The map shows the main strategy for each natural area and options for natural area restoration:<br />
• Protection areas are areas that have been identified as providing important features and<br />
services. Natural areas in Protection class are to be maintained and protected from<br />
adverse impacts. They correspond with Environmental Protection Areas and policies of<br />
the Regional and municipal Official <strong>Plan</strong>s. A few Protection areas have no natural areas<br />
(e.g., valley lands and floodplains) and are options for natural area restoration.<br />
• The <strong>Conservation</strong>/Enhancement class applies to other areas with regionally or<br />
municipally identified natural areas functions. These functions should be maintained<br />
where possible. There may also be opportunities to enhance their functioning.<br />
• Other Natural Area/Enhancement class covers the remainder of the existing natural areas.<br />
They too can have opportunities for enhancement.<br />
• Restoration Options class applies to areas without natural cover that could potentially<br />
provide valuable ecological services if restored to natural cover. Services include filling<br />
gaps in corridors and riparian buffers, bulking up core areas, and protecting potentially<br />
vulnerable groundwater recharge areas.<br />
• Slough Mosaic Restoration Options class applies to the above three classes where it is<br />
estimated the original landscape supported a slough mosaic. If opportunities arise within<br />
these areas that prove practical and with net ecological benefits, slough restoration could<br />
March 2008 174 <strong>Fort</strong> <strong>Erie</strong> <strong>Creeks</strong> <strong>Watershed</strong> <strong>Plan</strong><br />
General Report (105116)
add many biological and hydrological services to the areas while complementing drain<br />
requirements.<br />
• The Lake <strong>Erie</strong> Shoreline Band of Restoration Opportunity is a swath within which<br />
recommendations for shoreline community restoration could apply where conditions are<br />
suitable.<br />
Given the high natural area extent within the settlement area, emphasis should be on protection<br />
and enhancement rather than on natural area restoration. Infill and high-density cluster<br />
development can allow growth while protecting natural areas. Natural area trails and walkable<br />
communities can offer outdoors access. If infill requires incursion into a natural area, EPA’s<br />
should be avoided in favour of removing areas with relatively low natural area function,<br />
following procedures set out in the Official <strong>Plan</strong>.<br />
Two zones are exceptions to the de-emphasis of natural area restoration in the Settlement Area:<br />
• The Baker – Miller – <strong>Niagara</strong> River Shore – Lower Frenchman’s Creek watersheds<br />
corridor as playing a possible important role in biota migration for climate change<br />
adaptation. Here, protection and enhancement (e.g., slough mosaic creation where<br />
feasible and appropriate opportunities) can be supplemented by restoration to improve the<br />
corridor linkage still further; and<br />
• The Lake <strong>Erie</strong> shoreline for its current and potential highly significant communities and<br />
biota. Restoration efforts could boost the extent and diversity of these important<br />
communities and the wildlife they support.<br />
The Agricultural Area has both less natural area and less development pressure than the<br />
Settlement Area. Restoration can be added to the strategy, especially for riparian buffers,<br />
corridor linkage, core enhancement, and protection of potentially vulnerable groundwater<br />
recharge areas. Where restoration for green infrastructure beneficial to all of society, some<br />
compensation from beneficiaries to providers could be considered. The Natural Heritage plan<br />
presented on Map NH8 excludes broad-scale natural area restoration options from Class 1 and 2<br />
agricultural capability soils to minimize conflicts with agriculture. Beyond the map’s resolution,<br />
however, at the site level, some smaller-scale natural area restoration would be beneficial on<br />
these lands. Riparian buffers and small constructed wetlands would reduce non-point source<br />
impacts that can be generated by intensively farmed areas. Opportunities for corridor linkages<br />
could also be considered.<br />
In many areas throughout the study area, opportunity-based enhancement of lower-significance<br />
natural areas by restoration of the natural slough mosaic pattern could boost both biodiversity<br />
and flood moderation values of the areas.<br />
The watershed plan is broad-scale. Official <strong>Plan</strong> requirements for more detailed studies must<br />
precede development in or affecting natural areas. Development proposals will require specific<br />
studies to:<br />
a) Identify site-specific features including the presence and requirements of species-at-risk<br />
using any plans and up-to-date information available from MNR;<br />
b) Identify significant wildlife habitat;<br />
March 2008 175 <strong>Fort</strong> <strong>Erie</strong> <strong>Creeks</strong> <strong>Watershed</strong> <strong>Plan</strong><br />
General Report (105116)
c) Confirm and/or refine wetland boundaries. Any revisions should consult with MNR<br />
representatives to develop a consensus on changes;<br />
d) Identify reliance of features on local overland flows and groundwater conditions;<br />
e) Identify stressors specific to the site;<br />
f) Establish protection of the features and functions using buffers, development setbacks<br />
and other site specific management approaches in accordance with the principles and<br />
suggested approaches in the present study;<br />
g) Identify practical opportunities to enhance natural area function, e.g., sites with relatively<br />
easy access for slough mosaic re-establishment, with soils where there was a presettlement<br />
mosaic pattern, where there would be no disruption of significant natural<br />
features and that would benefit from valuable improvement in diversity and flood control;<br />
h) Identify locations for compensation, augmentation, or restoration of natural cover to<br />
offset identified impacts or inadequacies, and improve habitat connectivity and ecosystem<br />
functions after development; and<br />
i) Identify suitable locations and standards for trails and infrastructure (e.g. utilization of<br />
boardwalks and ‘soft’ engineering approaches to protect woodland and wetland<br />
functions).<br />
Stewardship can be encouraged by government, business, organizations and individuals<br />
implementing opportunities to:<br />
a) Raise citizen awareness of the role of green infrastructure in the functioning of their local<br />
subwatershed, the uniqueness of its natural areas, the issues affecting them and remedial<br />
actions,<br />
b) Minimize nuisance wildlife and invasive exotics<br />
c) Maintain drains with best practices to minimize erosion and with a focus of slough<br />
mosaic restoration in abutting natural areas<br />
d) Encourage options for rural income based on sustainable use of natural heritage<br />
e) Promote agency-private-NGO partnerships and coordinate information sharing, cost<br />
sharing among beneficiaries and actions towards common goals<br />
f) Increase public access to natural areas and shorelines<br />
g) Develop participatory monitoring with highly accessible and meaningful output.<br />
The NPCA currently oversees a stewardship program within the study area.<br />
Stormwater Management<br />
For the purpose of establishing/addressing watershed and subwatershed level targets related to<br />
erosion, flooding, baseflow and water quality, a system of distributed stormwater management<br />
facilities has been advanced for each subwatershed area with developing areas. While the<br />
specific orientation or even number of facilities are subject to refinement through subsequent<br />
study, the concept advanced for each subwatershed area has been premised on the following<br />
principles:<br />
(a)<br />
(b)<br />
Where possible, integrate stormwater management facilities into or adjacent to open<br />
space areas, or natural systems including proposed linkage corridors and watercourses.<br />
Adopt a philosophy of ‘natural’ wetland SWMP’s for those facilities cites in (a), and wet<br />
pond SWMP’s for those facilities located in more urban settings.<br />
March 2008 176 <strong>Fort</strong> <strong>Erie</strong> <strong>Creeks</strong> <strong>Watershed</strong> <strong>Plan</strong><br />
General Report (105116)
(c)<br />
(d)<br />
(e)<br />
(f)<br />
Generally locate communal stormwater management facilities at or near changes in land<br />
use and outlets at watercourses to be maintained.<br />
Minimize the number of stormwater management facilities when possible by maximizing<br />
drainage area capture to 40 to 80 ha +/-.<br />
Recognize the inherent economic complexity associated with crossing major utility<br />
corridors and roads.<br />
The Municipality has a combination of urban drainage systems (curb/gutter/storm<br />
sewers), and rural drainage systems (ditches). In several locations, due to localized<br />
topographic constraints, sump pumps connected to the storm sewer, foundation drain<br />
collection (FDC) systems, and sump pump discharging to surface, may be considered, as<br />
noted in the Town of <strong>Fort</strong> <strong>Erie</strong>’s “Subdivision Control Guidelines for Development of<br />
New Subdivisions & Application Form”, 2004. Other Alternative Development<br />
Standards (ADS) such as reduced lot grading, are not covered in the Guidelines.<br />
Flooding<br />
For flooding and infrastructure improvements, the impact assessment has determined that there<br />
are twenty-five potential flood damage centres, with the number of structures involved ranging<br />
from one to approximately twenty-five.<br />
There are typically four different opportunities to mitigate the flood potential:<br />
(a)<br />
(b)<br />
(c)<br />
(d)<br />
Storage – reduce peak flows and floodplain depths downstream<br />
Conveyance improvements – reduce floodplain depths<br />
Local flood-proofing – e.g. berming, raising structures, or dry flood-proofing (no<br />
openings below the 100 year level)<br />
Acquisition of land/regulate the floodplain – typically only applied to areas where the<br />
first three opportunities are not feasible.<br />
The majority of the potential flood damage centres involve one structure, and the<br />
recommendation for those would be local flood-proofing.<br />
Where there is widespread flooding that involves a cluster of structures, storage and conveyance<br />
improvements may be more economical than local flood proofing or acquisition.<br />
There are eight potential damage centres with multiple structures on the Black Creek, one on<br />
Beaver Creek, one on Frenchman’s Creek, one on Kraft Drain, and five on the Six Mile Creek:<br />
• Black Creek at Switch Road, east of the QEW, both sides of the creek<br />
• Black Creek at the Glenney Drain<br />
• Black Creek south of Townline Road<br />
• Black Creek tributary along Netherby Road west the QEW<br />
• Black Creek at the confluence with Beaver Creek, College Street<br />
• Black Creek at Stevensville, Main Street<br />
• Black Creek at Netherby Road<br />
• Black Creek at Point Abino Road<br />
• Beaver Creek u/s of the confluence, Eagle Road<br />
• Frenchman’s Creek at Industrial Drive<br />
March 2008 177 <strong>Fort</strong> <strong>Erie</strong> <strong>Creeks</strong> <strong>Watershed</strong> <strong>Plan</strong><br />
General Report (105116)
• Kraft Drain north of Dominion Road<br />
• Six Mile Creek, Bethune Avenue and Shirley Road<br />
• Six Mile Creek (Mann Drain), Dominion Road and Burleigh Road<br />
• Six Mile Creek at Dominion and Centralia<br />
• Six Mile Creek at Bernard Avenue and Nigh Road; and on Bernard Avenue<br />
The Black and Beaver <strong>Creeks</strong> have larger drainage areas and flows, and the potential for storage<br />
and conveyance improvements being a feasible/economical opportunity is not as likely. Local<br />
flood-proofing or acquisition may be the recommended opportunity.<br />
Storage is typically proposed in either a retrofit location, or a new centralized system which<br />
optimizes the contributing drainage area and control point in combination with topography and<br />
available lands.<br />
The Six Mile Creek has five culverts identified that overtop during the 100 year event, and some<br />
which would cause a backwater increase of 0.4 m or greater. This suggests that conveyance<br />
improvements would at least help mitigate some of the potential for flooding of these structures.<br />
Local flood-proofing may be required for the balance.<br />
In addition to the watercourses listed, the NPCA has developed hazard land mapping along the<br />
Lake <strong>Erie</strong> and <strong>Niagara</strong> River shorelines.<br />
5.4.1 Summary of Local Subwatershed Opportunities<br />
Each of the following tables represents a specific listing of the identified opportunities in each<br />
subwatershed, based on the format/structure of the generic opportunities offered in Table 5.4.1.<br />
Following each table is a list of the reaches in the subwatershed, together with the stream<br />
physical parameters and flow rates. This is primarily for planning and management purposes,<br />
should the reach need to be restored or realigned in the future.<br />
Following the tables are two figures for each subwatershed: the watercourse and stormwater<br />
management opportunities on the first figure, and the natural heritage strategy on the second<br />
figure (Figures LO 1.1, 1.2 through LO 11.1, 11.2).<br />
March 2008 178 <strong>Fort</strong> <strong>Erie</strong> <strong>Creeks</strong> <strong>Watershed</strong> <strong>Plan</strong><br />
General Report (105116)
Watercourses<br />
(erosion, fisheries)<br />
TABLE 5.4.2:<br />
SUMMARY OF LOCAL OPPORTUNITES<br />
BLACK CREEK<br />
Element Urban Non-Urban<br />
• Riparian buffer zone enlargement (BK-1-5 )<br />
• Erosion control (BLC11-15) – bank protection<br />
• Golf course – riparian buffer zone<br />
• Removal of on-line pond (BLC-ST-9)<br />
• Bed morphology enhancement<br />
• SWM – Erosion control enhancement<br />
• Establish appropriate natural vegetation riparian<br />
buffers where they are inadequate or do not exist<br />
(i.e. Reaches BLC-1, BLC-2, BLC-3, BLC-4, BLC-<br />
9, BLC-10, BLC-11, and BLC-12)<br />
Flooding<br />
(infrastructure,<br />
floodplain)<br />
Stormwater<br />
Management<br />
• Remediate approximately 11potential flood-prone<br />
structures in Stevensville (BLK 205, floodplain<br />
Sheet 6), through local flood-proofing<br />
• Peak flow and volume control required in<br />
Stevensville, subcatchment BLK 205.<br />
• Erosion control required on identified susceptible<br />
reaches<br />
• Retrofit existing development with SWM<br />
• Riparian buffer zone enlargement<br />
• Stabilization of livestock access (BLC-24-30)<br />
• Municipal drains - naturalization<br />
• Enhance bed morphology<br />
• Removal of in stream structures (BLC-26 – weir)<br />
• Removal of on-line ponds (BLC-ST-1)<br />
• Establish appropriate natural vegetation riparian<br />
buffers where they are inadequate or do not exist<br />
(i.e. Reaches BLC-5, BLC-8, BLC-15, BLC-18,<br />
BLC-23, BLC-24, BLC-25, BLC-26, BLC-27,<br />
BLC-28, BLC-29, BLC-30, BLC-31, MD-5, and<br />
SD-2).<br />
• Rehabilitate straightened watercourse sections using<br />
natural channel design when the opportunity arises<br />
during future development<br />
• Remediate 7 potential flood damage centres through<br />
local flood-proofing:<br />
• 2-3 d/s of the QEW at Switch Rd.<br />
• 20 trailers in the park west of the QEW south<br />
of Netherby<br />
• At the Glenney Drain<br />
• South of Townline Rd.<br />
• College St.<br />
• 2 on St. John’s drain south of Netherby<br />
• 1 on Schil drain west of Point Abino Rd<br />
• upgrade 2 culverts that create significant backwater<br />
during the 100 year event (House Road on Main<br />
Branch, and Bowen Road on south Tributary)<br />
Water Quality • potential point source contaminant loading<br />
identified at waster lagoons (QEW), auto wrecker<br />
(Neff south of 2’nd C, and Bowen east of Ott), and<br />
dump (2’nd C west of Wilhelm).<br />
• Educate public regarding nutrient use, given the<br />
consistently elevated Total Phosphorous levels<br />
• Educate public regarding potential sources of E. coli<br />
contamination<br />
Natural Heritage<br />
System<br />
• Main opportunity: Protection<br />
• Protect EPA’s; conserve ECA’s & LSA’s<br />
according to OP & to support broad IBA<br />
corridor through Douglastown<br />
• Extend trees and parkland along the creek<br />
• Street trees, roadside swales, green roofs could<br />
improve runoff, moderate microclimate.<br />
• Where opportunities exist, intensify new<br />
development to save areas elsewhere<br />
• Where feasible, appropriate opportunity in<br />
natural area outside EPA’s, enhance by slough<br />
mosaic replacement<br />
• Main Opportunity: Restoration of corridors,<br />
esp. riparian ones (both shown on map &<br />
unmapped narrower ones). Include slough<br />
mosaic restoration where possible<br />
• Protect EPA’s , conserve ECA’s and LSA’s<br />
according to OP<br />
• Enhance by slough mosaic restoration in<br />
existing areas where feasible, appropriate<br />
opportunity and need for more biodiversity or<br />
flow moderation<br />
• Enhance by drain naturalization. E.g.,<br />
Humberstone Marsh<br />
• Consider naturalizing the South Brookfield<br />
Road clearing in Humberstone Marsh<br />
March 2008 179 <strong>Fort</strong> <strong>Erie</strong> <strong>Creeks</strong> <strong>Watershed</strong> <strong>Plan</strong><br />
General Report (105116)
REACH<br />
NAME<br />
TABLE 5.4.3:<br />
PLANNING LEVEL BELT WIDTH CORRIDORS AND GRADIENT<br />
FOR THE MAIN REACHES WITHIN THE BLACK CREEK<br />
BELT<br />
WIDTH (m) Gradient (%) Q 2 (m 3 /s) Q 100 (m 3 /s)<br />
REACH<br />
NAME<br />
BELT<br />
WIDTH<br />
(m)<br />
Gradient (%) Q 2 (m 3 /s) Q 100 (m 3 /s)<br />
BLC-1 115 0.01 9.62 110.53 BLC-26 58 0.07<br />
BLC-2 95 0.01 BLC-27 38 0.19<br />
BLC-3 95 0.04 9.04 106.93 BLC-28 35 0.17<br />
BLC-4 185 0.01 6.74 66.91 BLC-29 35 0.12<br />
BLC-5 185 0.01 5.93 60.38 BLC-30 60 0.20<br />
BLC-6 191 0.01 5.67 57.96 BLC-31 110 0.14<br />
BLC-7 60 0.03 BLC-ST-1 60 0.06 1.38 11.90<br />
BLC-8 77 0.01 BLC-ST-2 25 0.08<br />
BLC-9 95 0.01 4.29 46.08 BLC-ST-3 29 0.17<br />
BLC-10 64 0.02 BLC-ST-4 56 0.08<br />
BLC-11 143 0.01 BLC-ST-5 47 0.27<br />
BLC-12 93 0.08 4.18 45.47 BLC-ST-6 43 0.07<br />
BLC-13 57 0.15 BLC-ST-7 90 0.06<br />
BLC-14 56 0.44 BLC-ST-8 42 0.37<br />
BLC-15 80 0.28 1.85 22.03 BLC-ST-9 35 0.17<br />
BLC-16 115 0.09 BLC-ST-10 48 0.26<br />
BLC-17 71 0.06 BLC-ST-11 38 0.61<br />
BLC-18 57 0.06 BLC-ST-12 38 0.26<br />
BLC-19 46 0.08 1.39 17.96 BLC-ST-13 38 0.26<br />
BLC-20 46 0.13<br />
BLC-21 59 0.07 BLC-NT-1 30 0.48<br />
BLC-22 39 0.08 BLC-NT-2 40 0.48<br />
BLC-23 39 0.06 BLC-NT-3 37 0.23<br />
BLC-24 39 0.11 0.79 11.48 BLC-NT-4 38 0.07<br />
BLC-25 50 0.05 BLC-NT-5 38 0.22<br />
March 2008 180 <strong>Fort</strong> <strong>Erie</strong> <strong>Creeks</strong> <strong>Watershed</strong> <strong>Plan</strong><br />
General Report (105116)
Watercourses<br />
(erosion, fisheries)<br />
TABLE 5.4.4:<br />
SUMMARY OF LOCAL OPPORTUNITES<br />
BEAVER CREEK<br />
Element Urban Non-Urban<br />
• Golf course (BVC-1) – riparian buffer zone<br />
• Riparian buffer zone enlargement (BVC-22 )<br />
• Erosion control (BVC-21-25) – bank<br />
protection<br />
• SWM – Erosion control enhancement<br />
• Bed morphology enhancement<br />
Flooding<br />
(infrastructure, floodplain)<br />
• Riparian buffer zone enlargement<br />
• Erosion control – (BVC 5-16) – bank enhancement<br />
• Municipal drains - naturalization<br />
• Enhance bed morphology (BVC-10)<br />
• Remediate 2 potential flood damage centres:<br />
• 3 on Eagle Rd near the confluence with Black<br />
Creek (floodplain sheet 3)<br />
• the golf course clubhouse near the confluence<br />
• 1 north of Garrison (floodplain sheet 21)<br />
• upgrade culvert that create significant backwater<br />
during the 100 year event (Stevensville Road)<br />
Stormwater Management • Retrofit existing development with SWM • Peak flow and volume control required in Ridgeway,<br />
subcatchments BEV 202, 203, 204, 2020.<br />
• Erosion control required.<br />
• Flood control or mitigation required in existing damage<br />
centres.<br />
Water Quality • PS potential contaminant loading identified at<br />
decommissioned landfill on Winger north of the creek.<br />
Natural Heritage System • Main Opportunity: Protection<br />
• Protect EPAs; conserve ECAs & LSAs<br />
according to OP<br />
• Street trees, roadside swales, green roofs<br />
could improve runoff and moderate<br />
microclimate.<br />
• Where opportunities exist, intensify new<br />
development to save areas elsewhere<br />
• Main Opportunity: Restoration to fill out riparian<br />
corridors<br />
• Add buffers to upper tributaries. Naturalize valleyland<br />
EPAs where not yet natural<br />
• If opportunities, restore: on shallow over bedrock areas<br />
(potentially vulnerable recharge areas) especially in<br />
headwaters, & along old RR<br />
• Enhancement: when feasible, appropriate opportunity,<br />
restore slough mosaic.<br />
• Protect EPAs; conserve ECAs & LSAs according to<br />
OP.<br />
REACH<br />
NAME<br />
TABLE 5.4.5:<br />
PLANNING LEVEL BELT WIDTH CORRIDORS AND GRADIENT<br />
FOR THE MAIN REACHES WITHIN THE BEAVER CREEK<br />
BELT<br />
WIDTH (m) Gradient (%) Q 2 (m 3 /s) Q 100 (m 3 /s)<br />
REACH<br />
NAME<br />
BELT<br />
WIDTH<br />
(m)<br />
Gradient (%) Q 2 (m 3 /s) Q 100 (m 3 /s)<br />
BVC-1 82 0.03 2.44 40.66 BVC-15 70 0.21 1.33 15.21<br />
BVC-2 82 0.22 BVC-16 67 0.09<br />
BVC-3 70 0.03 BVC-17 58 0.14 1.25 13.55<br />
BVC-4 70 0.10 BVC-18 58 0.15<br />
BVC-5 70 0.04 BVC-19 70 0.04<br />
BVC-6 70 0.03 1.90 32.31 BVC-20 64 0.12 1.65 22.29<br />
BVC-7 58 0.06 BVC-21 90 0.17<br />
BVC-8 54 0.03 BVC-22 86 0.17<br />
BVC-9 65 0.03 BVC-23 70 0.13 1.41 13.90<br />
BVC-10 67 0.15 1.87 26.53 BVC-24 34 0.11 1.34 13.40<br />
BVC-11 56 0.07 BVC-25 49 0.12<br />
BVC-12 110 0.04 1.55 19.88 BVC-26 46 0.18<br />
BVC-13 50 0.15 OD-1 55 NA 0.89 7.93<br />
BVC-14 40 0.34 OD-2 54 NA<br />
March 2008 181 <strong>Fort</strong> <strong>Erie</strong> <strong>Creeks</strong> <strong>Watershed</strong> <strong>Plan</strong><br />
General Report (105116)
TABLE 5.4.6:<br />
SUMMARY OF LOCAL OPPORTUNITES<br />
BAKER CREEK<br />
Element Urban Non-Urban<br />
Watercourses<br />
(erosion, fisheries)<br />
Flooding<br />
(infrastructure,<br />
floodplain)<br />
Stormwater<br />
Management<br />
• Erosion control (BKC-2) – bank improvements<br />
• Riparian buffer zone (BKC-1 – proposed golf<br />
course)<br />
• Culvert improvement (BKC-3) – larger structures<br />
• Rehabilitate straightened watercourse sections using<br />
natural channel design when the opportunity arises<br />
during future development.<br />
• Peak flow and volume control required in<br />
subcatchment BAK 200.<br />
• Erosion control required.<br />
Water Quality • PS potential contaminant loading identified at<br />
lagoon south of Townline Road.<br />
Natural Heritage System • Main Opportunity: Preservation – maintain this very<br />
high functioning area.<br />
• Protect EPAs; conserve ECAs & LSAs according to<br />
OP<br />
• Enhancement: when feasible, appropriate<br />
opportunity, restore slough mosaic with priority to<br />
east drain subwatershed. As ECA shrub and<br />
meadow areas mature, forest interior targets will be<br />
met.<br />
• Restoration: The corridor linkage needs reinforcing<br />
– consider expanding corridor along hydro ROW<br />
and, if the golf course is developed, that it be<br />
designed to avoid the south west corner including<br />
the creek and wetlands. For restored areas on<br />
lowland lacustrine soils, include slough mosaic<br />
restoration.<br />
TABLE 5.4.7:<br />
PLANNING LEVEL BELT WIDTH CORRIDORS AND GRADIENT<br />
FOR THE MAIN REACHES WITHIN THE BAKER CREEK<br />
REACH NAME BELT WIDTH (m) Gradient (%) Q 2 (m 3 /s) Q 100 (m 3 /s)<br />
BKC-1 66 0.08 0.83 7.07<br />
BKC-2 55 0.05<br />
BKC-3 59 0.05 0.49 4.60<br />
March 2008 182 <strong>Fort</strong> <strong>Erie</strong> <strong>Creeks</strong> <strong>Watershed</strong> <strong>Plan</strong><br />
General Report (105116)
TABLE 5.4.8:<br />
SUMMARY OF LOCAL OPPORTUNITES<br />
MILLER CREEK<br />
Element Urban Non-Urban<br />
Watercourses • Erosion Control – bank enhancements • Removal of on-line pond (MLC-7)<br />
(erosion, fisheries)<br />
• Bed morphology enhancement<br />
• Erosion control – bank stabilization<br />
• Establish appropriate natural vegetation riparian<br />
buffers where they are inadequate or do not exist.<br />
• Reach MLC-6: rehabilitate straightened channel<br />
with natural channel design.<br />
• Reach MLC-7: rehabilitate straightened channel by<br />
re-establishing flow in original natural channel, and<br />
any remaining straightened sections with natural<br />
channel design.<br />
Flooding<br />
(infrastructure,<br />
floodplain)<br />
Stormwater<br />
Management<br />
• Peak flow and volume control required in<br />
subcatchments MIL 100,101.<br />
• Erosion control required.<br />
Water Quality • PS potential contaminant loading identified at, auto<br />
wrecker, and landfill.<br />
Natural Heritage System • Main Opportunity: Protection<br />
• Protect EPAs; conserve ECAs & LSAs according to<br />
OP<br />
• Extend trees and buffers along creeks as opportunity<br />
arises.<br />
• Street trees, roadside swales, industrial green roofs<br />
could improve runoff and moderate microclimate.<br />
• Where opportunities exist, intensify new<br />
development to save areas elsewhere<br />
• Main Opportunity: Protection<br />
• Protect EPAs; conserve ECAs & LSAs according to<br />
OP; protect large block at mouth and improve its<br />
linkages<br />
• Enhancement: when feasible, appropriate<br />
opportunity arises, restore slough mosaic. As ECA<br />
shrub and meadow areas mature, forest and forest<br />
interior targets can be met.<br />
• Restoration: Reinforce links to Baker and<br />
Frenchman’s watersheds. Extend riparian and, in<br />
headwaters, restore some natural area -<br />
REACH<br />
NAME<br />
TABLE 5.4.9:<br />
PLANNING LEVEL BELT WIDTH CORRIDORS AND GRADIENT<br />
FOR THE MAIN REACHES WITHIN THE MILLER CREEK<br />
BELT<br />
WIDTH (m) Gradient (%) Q 2 (m 3 /s) Q 100 (m 3 /s)<br />
REACH<br />
NAME<br />
BELT<br />
WIDTH<br />
(m)<br />
Gradient (%) Q 2 (m 3 /s) Q 100 (m 3 /s)<br />
MLC-1 60 0.06 1.69 14.71 MLC-5 51 0.16<br />
MLC-2 57 0.05 MLC-6 48 0.12<br />
MLC-3 55 0.17 MLC-7 35 0.25<br />
MLC-4 51 0.13 1.18 11.80 MLC-8 33 0.30 0.92 8.46<br />
March 2008 183 <strong>Fort</strong> <strong>Erie</strong> <strong>Creeks</strong> <strong>Watershed</strong> <strong>Plan</strong><br />
General Report (105116)
TABLE 5.4.10:<br />
SUMMARY OF LOCAL OPPORTUNITES<br />
NIAGARA RIVER SHORE<br />
Element Urban Non-Urban<br />
Watercourses<br />
• Naturalize river shoreline when opportunities arise.<br />
(erosion, fisheries)<br />
Flooding<br />
• N/A<br />
(infrastructure,<br />
floodplain)<br />
Stormwater<br />
• Local treatment where opportunities arise<br />
Management<br />
Water Quality<br />
Natural Heritage System • Main Opportunity: Protection of EPAs, LSAs and<br />
ECAs, especially in <strong>Niagara</strong> R. 19<br />
• Protect EPAs; conserve ECAs & LSAs according to<br />
OP<br />
• Enhancement: when feasible, appropriate<br />
opportunity exists, restore slough mosaic As ECA<br />
shrub and meadow areas mature, forest targets can<br />
be met.<br />
• Restoration: Connect corridor through <strong>Niagara</strong> R.<br />
16 to beyond study area. Extend riparian buffers.<br />
Watercourses<br />
(erosion, fisheries)<br />
TABLE 5.4.11:<br />
SUMMARY OF LOCAL OPPORTUNITES<br />
FRENCHMAN’S CREEK<br />
Element Urban Non-Urban<br />
• Golf course – riparian zone enhancement<br />
• Channel straightening near QEW and Thompson<br />
Road – natural channel design<br />
• Erosion control (MLC4-6) – bank protection,<br />
• SWM – Erosion control enhancement<br />
• Establish appropriate natural vegetation riparian<br />
buffers where they are inadequate or do not exist.<br />
• Remove barriers to fish migration. Specifically,<br />
mitigate fish movement issues at the dam and<br />
associated pond at the downstream end of the<br />
Bridgewater Golf and CC, upstream of Thompson<br />
Rd.<br />
Flooding<br />
(infrastructure,<br />
floodplain)<br />
Stormwater<br />
Management<br />
• Riparian buffer zone enlargement<br />
• Stabilization of livestock access (FRC-14)<br />
• Establish appropriate natural vegetation riparian<br />
buffers where they are inadequate or do not exist.<br />
• Reaches FRC-5 and FRC-9: establish natural<br />
riparian vegetation buffer along watercourse within<br />
the golf courses.<br />
• Reaches FRC-7, FRC-8 and FRC-11: rehabilitate<br />
using natural channel design and establish natural<br />
riparian vegetation buffer along watercourse.<br />
• Remedial flood damage centre at Industrial Dr. • One potential flood damage centre d/s of Sunset Dr.:<br />
• Retrofit existing development with SWM • Erosion control required.<br />
• Flood control or mitigation required in existing<br />
damage centres.<br />
Water Quality • PS potential contaminant loading identified at auto<br />
wrecker on Thompson.<br />
• Educate public regarding nutrient use, given the<br />
consistently elevated Total Phosphorous levels<br />
• Educate public regarding potential sources of E. coli<br />
contamination<br />
Natural Heritage System • Main Opportunity: Protection<br />
• Extend trees and parkland along the creek as<br />
opportunity arises.<br />
• Street trees, roadside swales, green roofs on<br />
industrial buildings could improve runoff and<br />
moderate microclimate.<br />
• Where opportunities exist, intensify new<br />
development to save areas elsewhere<br />
• Where opportunity (outside EPAs), restore slough<br />
mosaic<br />
• Main Opportunity: Protection<br />
• Protect EPAs; conserve ECAs & LSAs according to<br />
OP; Protect large block at mouth and improve its<br />
links<br />
• Enhancement: when feasible, appropriate<br />
opportunity arises, restore slough mosaic. As ECA<br />
shrub and meadow areas mature, forest interior<br />
targets will be met.<br />
• Restoration: The corridor linkage needs reinforcing<br />
– join to Miller Creek natural areas and extend<br />
riparian buffers. Target coarse upland soils &<br />
headwaters.<br />
• Investigate habitat potential of post-closure quarries<br />
to assist forward planning<br />
March 2008 184 <strong>Fort</strong> <strong>Erie</strong> <strong>Creeks</strong> <strong>Watershed</strong> <strong>Plan</strong><br />
General Report (105116)
REACH<br />
NAME<br />
TABLE 5.4.12:<br />
PLANNING LEVEL BELT WIDTH CORRIDORS AND GRADIENT<br />
FOR THE MAIN REACHES WITHIN THE FRENCHMAN’S CREEK<br />
BELT<br />
WIDTH (m) Gradient (%) Q 2 (m 3 /s) Q 100 (m 3 /s)<br />
REACH<br />
NAME<br />
BELT<br />
WIDTH<br />
(m)<br />
FRC-1 109 0.04 N/A 24.65 FRC-9 66 0.22<br />
FRC-2 85 0.02 FRC-10 54 0.31<br />
Gradient (%) Q 2 (m 3 /s) Q 100 (m 3 /s)<br />
FRC-3 74 0.12 FRC-11 54 0.07 N/A 11.56<br />
FRC-4 73 0.17 FRC-12 58 0.08<br />
FRC-5 53 0.09 FRC-13 48 0.06<br />
FRC-6 37 0.18 N/A 19.74 FRC-14 53 0.07<br />
FRC-7 37 0.18 FRC-15 43 0.40<br />
FRC-8 39 0.14<br />
TABLE 5.4.13:<br />
SUMMARY OF LOCAL OPPORTUNITES<br />
FORT ERIE<br />
Element Urban Non-Urban<br />
Watercourses • Naturalize river shoreline when opportunities arise.<br />
(erosion, fisheries)<br />
Flooding • Relief storm infrastructure<br />
(infrastructure,<br />
floodplain)<br />
• Coastal barriers<br />
Stormwater<br />
Management<br />
• Adhere to Town guidelines for new development<br />
and infills<br />
• Retrofit existing development with SWM<br />
Water Quality • PS potential contaminant loading in urban centre,<br />
treatment plants.<br />
• Retrofit CSO’s<br />
Natural Heritage System • Main Opportunity: Restoration appropriate to urban<br />
setting<br />
• Extend trees and parkland along the river as<br />
opportunity exists – contribute to migratory<br />
corridor.<br />
• Encourage owners near river to plant trees<br />
• Street trees, roadside swales, green roofs could<br />
improve runoff to <strong>Niagara</strong> River and moderate<br />
microclimate.<br />
• Where opportunities exist, intensify new<br />
development to save areas elsewhere<br />
March 2008 185 <strong>Fort</strong> <strong>Erie</strong> <strong>Creeks</strong> <strong>Watershed</strong> <strong>Plan</strong><br />
General Report (105116)
TABLE 5.4.14:<br />
SUMMARY OF LOCAL OPPORTUNITES<br />
LAKESHORE<br />
Element Urban Non-Urban<br />
Watercourses • Naturalize river shoreline when opportunities arise.<br />
(erosion, fisheries)<br />
Flooding • Shoreline Protection<br />
(infrastructure,<br />
floodplain)<br />
Stormwater<br />
Management<br />
• Adhere to Town guidelines for new development<br />
and infills<br />
• Retrofit existing development with SWM<br />
Water Quality • PS potential contaminant loading in urban centre,<br />
treatment plants<br />
• Retrofit CSO’s<br />
Natural Heritage System • Main Opportunity: Protection<br />
• Protect EPA’s; conserve ECA’s & LSA’s according<br />
to OP, checking for wetland<br />
• Protect shoreline if lake levels decline and current<br />
natural inland linkage from shore<br />
• Encourage intensified development<br />
• Encourage shoreline owners to restore coastal<br />
habitats<br />
• Federal government restore on their lands<br />
TABLE 5.4.15:<br />
SUMMARY OF LOCAL OPPORTUNITES<br />
KRAFT DRAIN<br />
Element Urban Non-Urban<br />
Watercourses<br />
(erosion, fisheries)<br />
Flooding<br />
(infrastructure,<br />
floodplain)<br />
Stormwater<br />
Management<br />
• Erosion control (KFD1-5) – bank protection,<br />
• SWM – Erosion control enhancement threshold<br />
values<br />
• Natural Channel Design (KFD-5)<br />
• Flow that is presently directed through Reach KFD-<br />
5 should be re-established into existing original<br />
bypassed Reaches KFD-2, KFD-3 and KFD-4.<br />
• Existing groundwater inputs should be maintained<br />
and enhanced where feasible.<br />
• Reach KFD-1: rehabilitate hardened watercourse<br />
edge in downstream half of reach<br />
• Remediate 1 potential flood damage centre through<br />
local flood-proofing:<br />
• up to 3 flood-prone structures near the<br />
headwaters<br />
• Retrofit existing development with SWM<br />
• Upgrade 4 culverts that create significant backwater<br />
during the 100 year event (Dominion, Kraft)<br />
• Peak flow and volume control required in<br />
potentially all subcatchments.<br />
• Erosion control required.<br />
Water Quality • Potential point source contaminant loading<br />
identified at auto wrecker on Kraft and chemical<br />
plant on Helena.<br />
Natural Heritage System • Main Opportunity: Enhancement<br />
• Enhance existing natural areas through slough<br />
mosaic reestablishment if feasible, appropriate<br />
opportunity<br />
• Intensify development.<br />
• Protect EPAs; conserve ECAs & LSAs according<br />
to OP<br />
• Protect Shoreline if lake levels decline<br />
• Encourage shoreline owners to restore coastal<br />
habitats<br />
• Restore opportunities for corridors to Frenchman’s<br />
subwatershed (and toward the creek crossing of the<br />
QEW) via top end of Bertie Bay subwatershed<br />
March 2008 186 <strong>Fort</strong> <strong>Erie</strong> <strong>Creeks</strong> <strong>Watershed</strong> <strong>Plan</strong><br />
General Report (105116)
TABLE 5.4.16:<br />
PLANNING LEVEL BELT WIDTH CORRIDORS AND GRADIENT<br />
FOR THE MAIN REACHES WITHIN THE KRAFT DRAIN<br />
REACH NAME BELT WIDTH (m) Gradient (%) Q 2 (m 3 /s) Q 100 (m 3 /s)<br />
KFD-1 1.25 15.51<br />
KFD-2<br />
KFD-3<br />
KFD-4 0.71 9.23<br />
Watercourses<br />
(erosion, fisheries)<br />
TABLE 5.4.17:<br />
SUMMARY OF LOCAL OPPORTUNITES<br />
BERTIE BAY DRAINS & LAKE ERIE 1<br />
Element Urban Non-Urban<br />
• Erosion control– bank protection,<br />
• SWM – Erosion control enhancement threshold<br />
values<br />
• Natural Channel Design<br />
• Reach BBD-2: rehabilitate straightened channel by<br />
re-establishing flow in the existing original natural<br />
channel.<br />
• Maintain and enhance existing groundwater inputs.<br />
• Remove culvert at mouth of watercourse that is<br />
presently a barrier to fish migration<br />
Flooding • Shoreline protection<br />
(infrastructure,<br />
floodplain)<br />
Stormwater<br />
Management<br />
• Retrofit existing development with SWM • Peak flow and volume control required in<br />
subcatchment BER 102.<br />
• Erosion control required.<br />
Water Quality • Crescent Park, Dominion Road CSO<br />
Natural Heritage System • Main Opportunity: Protection<br />
• Protect EPAs; conserve ECAs & LSAs according to<br />
OP<br />
• Where feasible opportunity outside EPA and<br />
appropriate landscape (see map NH8) and<br />
communities, enhance existing natural areas through<br />
slough mosaic reestablishment<br />
• Where opportunities exist, intensify new<br />
development to save areas elsewhere<br />
• Main Opportunity: Protection<br />
• Protect shoreline if lake levels decline<br />
• Protect EPAs; conserve ECAs & LSAs according to<br />
OP<br />
• Investigate if the EPAs in the southwest corner<br />
should be expanded to accommodate the priority<br />
flagged by the Great Lakes <strong>Conservation</strong> Blueprint<br />
(Henson and Brodribb, 2005)<br />
• Enhance existing natural areas through slough<br />
mosaic reestablishment, if feasible, appropriate<br />
opportunity<br />
• Encourage shoreline owners to restore coastal<br />
habitats<br />
• Restore where opportunities for filling corridors or<br />
protecting recharge (shallow over bedrock) areas<br />
March 2008 187 <strong>Fort</strong> <strong>Erie</strong> <strong>Creeks</strong> <strong>Watershed</strong> <strong>Plan</strong><br />
General Report (105116)
Watercourses<br />
(erosion, fisheries)<br />
TABLE 5.4.18:<br />
SUMMARY OF LOCAL OPPORTUNITES<br />
SIX MILE CREEK<br />
Element Urban Non-Urban<br />
• Erosion control– bank protection,<br />
• SWM – Erosion control enhancement<br />
• Enhance bed morphology<br />
• Removal of on-line ponds (MND-2, MND-5)<br />
• SWM – Erosion control enhancement Enhanced bed<br />
morphology<br />
Flooding<br />
(infrastructure,<br />
floodplain)<br />
Natural Heritage<br />
System<br />
• Remediate 4 potential flood damage centres, through<br />
conveyance improvements, and potentially local floodproofing:<br />
• up to 25 flood-prone structures near the<br />
intersection of Bethune and Shirley<br />
• 3 on Centralia (sheets 2,4)<br />
• 1 at Bernard and Nigh<br />
• 16 at Dominion and Burleigh, on the Mann drain<br />
• shoreline protection<br />
• upgrade 10 culverts that create significant backwater<br />
during the 100 year event<br />
• retrofit existing development with SWM<br />
• Erosion control required<br />
• Reach SMC-6: rehabilitate straightened channel by<br />
re-establishing flow in the existing original natural<br />
channel.<br />
• Reach MND-1: establish natural riparian vegetation<br />
buffer along watercourse.<br />
• Rehabilitate straightened channels (Reaches SMC-7,<br />
SMC-8, MND-2, MND-3, MND-4, MND-5, and<br />
MND-6) as part of potential future urban or<br />
residential development.<br />
Stormwater<br />
Management<br />
• Peak flow and volume control required in central<br />
and upper subcatchments, and MAN102.<br />
Water Quality • PS potential contaminant loading identified at. Auto<br />
wrecker on Stonemill south of Garrison Road<br />
• Main Opportunity: Protection<br />
• Main Opportunity: Protection<br />
• Protect EPAs; conserve ECAs & LSAs according to • Protect Shoreline if lake levels decline<br />
Official <strong>Plan</strong><br />
• Protect EPAs; conserve ECAs & LSAs according to<br />
• Street trees, roadside swales, green roofs could<br />
OP<br />
improve runoff and moderate microclimate.<br />
• Enhance existing natural areas through slough<br />
• Where feasible opportunities exist, intensify new<br />
mosaic reestablishment, if feasible, appropriate<br />
development to save areas elsewhere<br />
opportunity<br />
• Where opportunity outside EPA and appropriate • Encourage shoreline owners to restore coastal<br />
landscape (see map NH8) and communities, enhance habitats<br />
existing natural areas through slough mosaic<br />
• Extend corridor linkages northward and westward<br />
reestablishment<br />
and along creeks<br />
REACH<br />
NAME<br />
TABLE 5.4.19:<br />
PLANNING LEVEL BELT WIDTH CORRIDORS AND GRADIENT<br />
FOR THE MAIN REACHES WITHIN THE SIX MILE CREEK<br />
BELT<br />
WIDTH (m) Gradient (%) Q 2 (m 3 /s) Q 100 (m 3 /s)<br />
REACH<br />
NAME<br />
BELT<br />
WIDTH<br />
(m)<br />
Gradient (%) Q 2 (m 3 /s) Q 100 (m 3 /s)<br />
SMC-1 82 0.07 4.82 47.40 SMC-10 43 0.34<br />
SMC-2 46 0.08 SMC-11 40 0.51<br />
SMC-3 44 0.07 MND-1 38 NA<br />
SMC-4 46 0.09 MND-2 38 NA 1.52 15.31<br />
SMC-5 52 0.08 2.50 25.36 MND-3 29 NA 1.06 8.13<br />
SMC-6 30 0.14 MND-4 35 NA<br />
SMC-7 30 0.19 MND-5 28 NA 0.77 7.50<br />
SMC-8 30 0.16 0.96 7.68 MND-6 28 NA<br />
SMC-9 42 0.35 0.77 9.40<br />
March 2008 188 <strong>Fort</strong> <strong>Erie</strong> <strong>Creeks</strong> <strong>Watershed</strong> <strong>Plan</strong><br />
General Report (105116)
6. IMPLEMENTATION<br />
In section 5, a list of site-specific and local opportunities has been generated. These<br />
recommendations form part of the <strong>Watershed</strong> <strong>Plan</strong>. The list has had a priority assigned to each<br />
recommendation (high, or medium) which is provided in Table 6.1.1 to 6.1.11.<br />
The information has been reviewed in detail by the Steering Committee, and comments have<br />
been provided by the NPCA, Town, MNR, and <strong>Niagara</strong> Parks Commission.<br />
6.1 Priority List of Recommendations<br />
The area-specific recommendations, which fall into the general urban areas and non-urban areas<br />
categories, have been reviewed with stakeholders and the Steering Committee in order to<br />
confirm the important factors for establishing priority. These factors include human health,<br />
safety, risk, cost, social impacts, environmental significance, and other related factors. The<br />
priority list will become an important administrative and communication tool.<br />
Watercourses<br />
For watercourses, a high priority has been assigned to the removal of barriers to fish migration,<br />
removal of on-line ponds, and restoration of severely modified reaches of the watercourses (e.g.<br />
anthropogenic modifications).<br />
General restoration, stabilization, erosion protection and reinstatement of historical flows have<br />
been assigned a medium priority.<br />
Natural Heritage System<br />
Protection of existing natural areas and their functions is a high priority and well covered by<br />
Official <strong>Plan</strong>s. Medium priority recommendations are actions toward improving habitat,<br />
hydrologic and microclimate functions and addressing the key issues identified for each subwatershed<br />
area: restoration/enhancement of slough mosaic micro-topography, corridor<br />
reinforcement including extension of riparian buffers, and coastal community restoration and<br />
stewardship. Consistent with Provincial Policy and directives, it is assumed that urban<br />
development will incorporate green infrastructure (e.g., street trees, roadside swales, green roofs)<br />
and strive for relatively dense forms to avoid sprawl over natural areas.<br />
Stormwater Management<br />
For stormwater management, a high priority has been assigned to providing management for new<br />
development. In the existing urban areas, a medium priority has been assigned to providing<br />
retrofit treatment to existing development. A medium priority has also been assigned to<br />
identifying and addressing point source pollutants.<br />
Tables 6.1.1 to 6.1.11 list all of the prioritized local actions that have been recommended in the<br />
<strong>Watershed</strong> <strong>Plan</strong>:<br />
March 2008 189 <strong>Fort</strong> <strong>Erie</strong> <strong>Creeks</strong> <strong>Watershed</strong> <strong>Plan</strong><br />
General Report (105116)
In addition to the priority assigned to each action, there is an entry for land ownership,<br />
proponency, cost assumptions, and estimated cost. These elements of the table are discussed in<br />
more detail in the following sections.<br />
Land Ownership<br />
The majority of the lands in question are within private ownership, and include the watercourses<br />
that pass through private and public lands. Where culvert upgrades are required/recommended,<br />
the road may be either private or public (Town, Region). Several of the identified potential sites<br />
for Point source pollution are also public.<br />
Proponency<br />
The NPCA are the primary proponent of the <strong>Watershed</strong> <strong>Plan</strong>, and would be joined in a large<br />
number of recommended actions by the public through stewardship, stakeholders, and the<br />
landowners. Stormwater management for new development remains the responsibility of the<br />
developer (however, the facilities have been included in the total costing exercise).<br />
Cost Assumptions<br />
Watercourse treatment costing has been based on the broad assumptions that: erosion<br />
stabilization (structural and bio-engineering) will be required on both banks and on 50% of the<br />
total length of the reach in question. Riparian buffers would consist of primarily vegetation and<br />
minor grading would be conducted on 100% of the reach length and on both sides. Livestock<br />
controlled areas would be constructed along 50% of the reach length, and on both sides. The<br />
proposed unit rates are conservative and based on the Study Team’s experience on similar<br />
projects over the past 10-20 years.<br />
The flood proofing and culvert replacement costing has been done as part of the flood damage<br />
assessment (red. Appendix ‘SW-F’). The flood proofing costing is based on berming and<br />
landscaping, plus meetings with the private landowners and survey of the potentially affected<br />
lands. As noted in the flooding assessment, some of the potentially affected (and hence costed)<br />
structures may turn out not to be within the 100 year floodplain.<br />
The Natural Heritage System enhancement will be subject to further study to determine the<br />
extent and conditions of site options; hence the estimates of area involved are preliminary. For<br />
the slough mosaic restoration, the grading and planting would be selective and not as dense as a<br />
reforestation exercise. For the proposed vegetation between adjacent natural areas or along the<br />
shorelines, a more-densely vegetated unit rate has been proposed. Restoration includes some<br />
compensation for land; near-urban rates are higher. Area estimates factor in subwatershed:<br />
natural area target areas, extent of site options available (Figure NH8), flooding, imperviousness,<br />
and population requiring ecological services.<br />
March 2008 190 <strong>Fort</strong> <strong>Erie</strong> <strong>Creeks</strong> <strong>Watershed</strong> <strong>Plan</strong><br />
General Report (105116)
TABLE 6.1.1:<br />
SUMMARY OF PRIORITIZED LOCAL ACTIONS<br />
BLACK CREEK<br />
Element Urban Non-Urban Priority Land Ownership Proponency Cost Assumptions Cost ($1,000’s)<br />
Watercourses • Erosion control (BLC11-15) – bank protection H Private NPCA/Private 1000 m x $200/m 200<br />
(erosion, fisheries) • Golf course – riparian buffer zone M Private NPCA/Private 1000 m x $100/m 100<br />
• Removal of on-line pond (BLC-ST-9) H Private NPCA/Private remove, regrade, restore 50<br />
• Establish appropriate natural vegetation riparian buffers where<br />
M Private 3000 m x $100/m 300<br />
they are inadequate or do not exist (i.e. Reaches BLC-1, BLC-2,<br />
BLC-3, BLC-4, BLC-9, BLC-10, BLC-11, and BLC-12)<br />
• Stabilization of livestock access (BLC-24-30) M Private NPCA/Private 100 m x $50/m 50<br />
• Removal of in stream structures (BLC-26 – weir) H Private NPCA/Private remove, regrade, restore 25<br />
• Removal of on-line ponds (BLC-ST-1) H Private NPCA/Private remove, regrade, restore 50<br />
• Establish appropriate natural vegetation riparian buffers where<br />
they are inadequate or do not exist (i.e. Reaches BLC-5, BLC-8,<br />
BLC-15, BLC-18, BLC-23, BLC-24, BLC-25, BLC-26, BLC-<br />
27, BLC-28, BLC-29, BLC-30, BLC-31, MD-5, and SD-2).<br />
M Private NPCA 6000 m x $100/m 600<br />
Flooding<br />
(infrastructure,<br />
floodplain)<br />
Stormwater<br />
Management<br />
• Remediate approximately 4 potential flood-prone structures in<br />
Stevensville (BLK 205, floodplain Sheet 6), through local floodproofing<br />
• Peak flow and volume control required in Stevensville,<br />
subcatchment BLK 205.<br />
• Erosion control required on identified susceptible reaches<br />
• Retrofit existing development with SWM<br />
• Remediate 6 potential flood damage centres through local floodproofing:<br />
• 2-3 immediately downstream of the QEW<br />
• 20 trailers in the park west of the QEW south of Netherby<br />
• 1 east of Winger at Main<br />
• 2 on St. John’s drain south of Netherby<br />
• 1 on Schil drain west of Point Abino Rd<br />
• 1 west of Winger on the south tributary<br />
• Upgrade 2 culverts that create significant backwater during the<br />
100 year event (House Road on Main Branch, and Bowen Road<br />
on south Tributary)<br />
Water Quality • Potential point source contaminant loading identified at waste<br />
water lagoons (QEW), auto wrecker (Neff south of 2’nd C, and<br />
Bowen east of Ott), and dump (2’nd C west of Wilhelm).<br />
Natural Heritage<br />
System<br />
• Protect EPA’s; conserve ECA’s & LSA’s according to OP & to<br />
support broad IBA corridor through Douglastown<br />
• Extend trees and parkland along the creek<br />
• Restore corridors, esp. riparian ones, incl. Slough mosaic where<br />
appropriate<br />
H Private NPCA/Town Flood proofing by berming and<br />
vegetating/landscaping<br />
H Private NPCA/Town Flood proofing by<br />
berming/landscaping<br />
M Public Town $100K per culvert 200<br />
H Private Development 2 extended detention control<br />
end-of-pipe facilities (excluding land)<br />
M Public/Private Region 3 site specific studies 30<br />
H Private NPCA/Town Public awareness/stewardship<br />
200 trees @ $50<br />
10<br />
M Private NPCA 220 ha @ $4.5K/ha 990<br />
• Protect EPA’s , conserve ECA’s and LSA’s according to OP H Private NPCA/Town Public awareness/stewardship 10<br />
12<br />
532<br />
400<br />
10<br />
• Enhance by slough mosaic restoration in existing areas where<br />
opportunity and need for more biodiversity or flow moderation<br />
M Private NPCA Regrade, plant 50 ha @ $3.5K/ha 175<br />
• Consider naturalizing the South Brookfield Road clearing in<br />
M Private NPCA <strong>Plan</strong>t 10 ha @ $4K/ha 40<br />
Humberstone Marsh<br />
• Drain naturalization opportunities, e.g., Humberstone Marsh M Public/Private NPCA 20<br />
Subtotal: High $1,299,000.<br />
Subtotal: Medium $2,505,000.<br />
Total $3,804,000.<br />
March 2008 191 <strong>Fort</strong> <strong>Erie</strong> <strong>Creeks</strong> <strong>Watershed</strong> <strong>Plan</strong><br />
General Report (105116)
TABLE 6.1.2:<br />
SUMMARY OF PRIORITIZED LOCAL ACTIONS<br />
BEAVER CREEK<br />
Element Urban Non-Urban Priority Land Ownership Proponency Cost Assumptions Cost ($1,000’s)<br />
Watercourses • Golf course (BVC-1) – riparian buffer zone M Private NPCA/Private 400 x $100/m 40<br />
(erosion, fisheries) • Riparian buffer zone enlargement (BVC-22 ) M Private NPCA/Private 400 x $100/m 40<br />
• Erosion control (BVC-21-25) – bank protection H Private NPCA/Private 2000 x $200/m 400<br />
• Riparian buffer zone enlargement (BVC 2-4) M Private NPCA/Private 1500 x $100/m 150<br />
• Erosion control – (BVC 5-16) – bank enhancement H NPCA/Private 4000 x $200/m 800<br />
• Enhance bed morphology (BVC-10) M Private NPCA/Private 600 x $500/m 300<br />
Flooding<br />
(infrastructure,<br />
floodplain)<br />
• Remediate 2 potential flood damage centres:<br />
• 3 on Eagle Rd near the confluence with Black Creek<br />
(floodplain sheet 3)<br />
• the golf course clubhouse near the confluence<br />
• upgrade culvert that create significant backwater during the 100<br />
year event (Stevensville Road)<br />
H Private NPCA/Town flood proofing by berming/landscaping 49<br />
M Public Town $100K per culvert 100<br />
Stormwater<br />
H Private Development 2 extended detention control<br />
400<br />
• Retrofit existing development with SWM<br />
Management<br />
end-of-pipe facilities (excl. land)<br />
• Peak flow and volume control required in Ridgeway,<br />
H Private Development 2 extended detention control<br />
400<br />
subcatchments BEV 202, 203, 204, 2020.<br />
end-of-pipe facilities (excl. land)<br />
Water Quality • PS potential contaminant loading identified at decommissioned<br />
M Public Region 1 site specific study 10<br />
landfill on Winger north of the creek.<br />
Natural Heritage • Protect EPA’s; conserve ECA’s & LSA’s according to OP H Private NPCA/Town Public awareness/stewardship 10<br />
System<br />
• Add buffers to upper tributaries. Naturalize valleyland EPA’s<br />
M Private NPCA 60 ha @ $4K/ha 240<br />
where not yet natural, along old R.R., headwaters recharge areas<br />
if opportunity<br />
• Enhancement: when opportunity, restore slough mosaic. M Private NPCA 10 ha @ $3.5K/ha 35<br />
• Protect EPA’s; conserve ECA’s & LSA’s according to OP. H Private NPCA/Town Public awareness/stewardship 10<br />
Subtotal: High $2,069,000.<br />
Subtotal: Medium $ 915,000.<br />
Total: $2,984,000.<br />
TABLE 6.1.3:<br />
SUMMARY OF PRIORITIZED LOCAL ACTIONS<br />
BAKER CREEK<br />
Element Urban Non-Urban Priority Land Ownership Proponency Cost Assumptions Cost ($1,000’s)<br />
Watercourses<br />
• Erosion control (BKC-2) – bank improvements H Private NPCA/Private 800 x $200/m 160<br />
(erosion, fisheries)<br />
• Riparian buffer zone (BKC-1 – proposed golf course) H Private NPCA/Private 1000 x $100/m 100<br />
• Culvert improvement (BKC-3) – larger structures M Private NPCA/Private 3 x $100K 300<br />
Flooding<br />
• No structures, culverts Private NPCA/Private<br />
(infrastructure,<br />
floodplain)<br />
Stormwater<br />
• Peak flow and volume control required in subcatchment BAK<br />
H Private Development 1 extended detention control<br />
200<br />
Management<br />
200.<br />
end-of-pipe facilities (excl. land)<br />
Water Quality<br />
• PS potential contaminant loading identified at lagoon south of<br />
M Public Region 10<br />
Townline Road.<br />
Natural Heritage<br />
• Protect EPA’s; conserve ECA’s & LSA’s according to OP<br />
H Private NPCA/Town Public awareness/stewardship 10<br />
System<br />
•<br />
Preserve this high functioning area<br />
Enhancement: when opportunity, restore slough mosaic with<br />
priority to east drain sub-watershed. As ECA shrub and meadow<br />
areas mature, forest interior targets will be met.<br />
M Private NPCA 25 ha @ $3.5K/ha 122.5<br />
• Restoration: The corridor linkage needs reinforcing – consider<br />
expanding corridor along hydro ROW and, if the golf course is<br />
developed, that it be designed to avoid the south west corner<br />
including the creek and wetlands. For restored areas on<br />
lowland lacustrine soils, include slough mosaic restoration.<br />
M Private NPCA 10 Ha @ $4.5K/ha 45<br />
Subtotal: High $470,000.<br />
Subtotal: Medium $477,500.<br />
Total $947,500.<br />
March 2008 192 <strong>Fort</strong> <strong>Erie</strong> <strong>Creeks</strong> <strong>Watershed</strong> <strong>Plan</strong><br />
General Report (105116)
TABLE 6.1.4:<br />
SUMMARY OF PRIORITIZED LOCAL ACTIONS<br />
MILLER CREEK<br />
Element Urban Non-Urban Priority Land Ownership Proponency Cost Assumptions Cost ($1,000’s)<br />
Watercourses • Erosion Control – bank enhancements MLC 8 H Private NPCA/Private 500 @ $200 100<br />
(erosion, fisheries)<br />
• Removal of on-line pond (MLC-7) H Private NPCA/Private 50<br />
• Establish appropriate natural vegetation riparian buffers where<br />
M Private NPCA/Private 2000 @ $100 200<br />
they are inadequate or do not exist. MLC 1-5<br />
• Reach MLC-6: rehabilitate straightened channel with natural<br />
channel design.<br />
M Private NPCA/Private 800 @ $500 400<br />
• Reach MLC-7: rehabilitate straightened channel by reestablishing<br />
M Private NPCA/Private 600 m x $500/m 300<br />
flow in original natural channel, and any remaining<br />
straightened sections with natural channel design.<br />
Flooding<br />
(infrastructure,<br />
floodplain)<br />
• No structures, culverts<br />
Stormwater<br />
Management<br />
• Peak flow and volume control required in subcatchments MIL<br />
100,101.<br />
H Private Development 400<br />
Water Quality • PS potential contaminant loading identified at, auto wrecker, and<br />
M Public/Private Region 2 site specific studies 20<br />
landfill.<br />
Natural Heritage • Protect EPA’s; conserve ECA’s & LSA’s according to OP H Private NPCA/Town 10<br />
System<br />
• Extend trees and buffers along creeks, as opportunity M Private NPCA 400 trees @ $50 20<br />
• Protect EPA’s; conserve ECA’s & LSA’s according to OP;<br />
protect large block at mouth and improve its linkages<br />
• Enhancement: when opportunity arises, restore slough mosaic.<br />
As ECA shrub and meadow areas mature, forest and forest<br />
interior targets can be met.<br />
• Restoration: Reinforce links to Baker and Frenchman’s<br />
watersheds. Extend riparian and, in headwaters, restore some<br />
natural area -<br />
H Private NPCA/Town 10<br />
M Private NPCA 10 ha @ $3.5K/ha 35<br />
M Private NPCA 90 ha @ $4.5K/ha 405<br />
Subtotal: High $ 570,000.<br />
Subtotal: Medium $1,380,000.<br />
Total $1,950,000.<br />
TABLE 6.1.5:<br />
SUMMARY OF PRIORITIZED LOCAL ACTIONS<br />
NIAGARA RIVER SHORE<br />
Element Urban Non-Urban Priority Land Ownership Proponency Cost Assumptions Cost ($1,000’s)<br />
Watercourses<br />
• Naturalize river shoreline when opportunities arise. M Private NPCA/Private 10,000 x $50/m 500<br />
(erosion, fisheries)<br />
Flooding<br />
• No structures, culverts Private<br />
(infrastructure,<br />
floodplain)<br />
Stormwater<br />
M Private NPCA/Private 50<br />
• Local treatment where opportunities arise<br />
Management<br />
Water Quality Private<br />
Natural Heritage<br />
System<br />
• Protect EPA’s; conserve ECA’s & LSA’s according to OP H Private NPCA 10<br />
• Enhancement: when opportunity exists, restore slough mosaic<br />
As ECA shrub and meadow areas mature, forest targets can be<br />
met.<br />
• Restoration: Connect corridor through <strong>Niagara</strong> R. 16 to beyond<br />
study area. Extend riparian buffers.<br />
M Private NPCA 10 ha @ $3.5K/ha 35<br />
M Private NPCA 20 ha @ $4.5K/ha 90<br />
Subtotal: High $ 10,000.<br />
Subtotal: Medium $675,000.<br />
Total: $685,000.<br />
March 2008 193 <strong>Fort</strong> <strong>Erie</strong> <strong>Creeks</strong> <strong>Watershed</strong> <strong>Plan</strong><br />
General Report (105116)
TABLE 6.1.6:<br />
SUMMARY OF PRIORITIZED LOCAL ACTIONS<br />
FRENCHMAN’S CREEK<br />
Element Urban Non-Urban Priority Land Ownership Proponency Cost Assumptions Cost ($1,000’s)<br />
Watercourses • Golf course – riparian zone enhancement M Private NPCA/Private 1000 @ $100 100<br />
(erosion, fisheries) • Channel straightening near QEW and Thompson Road – natural<br />
M Private NPCA/Private 400 @ $500 200<br />
channel design (FRC-10)<br />
• Erosion control (FRC4-6) – bank protection, H Private NPCA/Private 1500 @ 200 300<br />
• Remove barriers to fish migration. Specifically, mitigate fish<br />
H Private NPCA/Private 2 x $50K 100<br />
movement issues at the dam and associated pond at the<br />
downstream end of the Bridgewater Golf and CC, upstream of<br />
Thompson Rd.<br />
• Stabilization of livestock access (FRC-14) M Private NPCA/Private 800 @ $50 40<br />
• Establish appropriate natural vegetation riparian buffers where<br />
M Private NPCA/Private 1600 @ $100 160<br />
they are inadequate or do not exist. (FRC 12-13, 1-3<br />
• Reaches FRC-5 and FRC-9: establish natural riparian vegetation<br />
buffer along watercourse within the golf courses.<br />
M Private NPCA/Private 1000 @ $100 100<br />
• Reaches FRC-7, FRC-8 and FRC-11: rehabilitate using natural<br />
channel design and establish natural riparian vegetation buffer<br />
along watercourse.<br />
M Private NPCA/Private 1500 @ 500 750<br />
Flooding<br />
(infrastructure,<br />
floodplain)<br />
Stormwater<br />
Management<br />
• Thompson Road<br />
H Private NPCA/Town 180<br />
• Industrial Drive (6 structures)<br />
• Sunset Drive<br />
• Retrofit existing development with SWM H Private Development 1 study 200<br />
Water Quality • PS potential contaminant loading identified at auto wrecker on<br />
Thompson.<br />
Natural Heritage<br />
System<br />
• Protect EPA’s; conserve ECA’s & LSA’s according to OP;<br />
Protect large block at mouth and improve its links<br />
• Protect EPA’s; conserve ECA’s & LSA’s according to OP;<br />
Protect large block at mouth and improve its links<br />
• Enhancement: when opportunity arises, restore slough mosaic.<br />
As ECA shrub and meadow areas mature, forest interior targets<br />
will be met.<br />
• Restoration: The corridor linkage needs reinforcing – join to<br />
Miller Creek natural areas and extend riparian buffers. Target<br />
coarse upland soils & headwaters.<br />
M Private Region 1 Site-specific Study 20<br />
H Private NPCA/Town 10<br />
H Private NPCA/Town 10<br />
M Private NPCA 10 ha @ $3.5K/ha 35<br />
M Private NPCA 50 ha @ $4K/ha 200<br />
Subtotal: High $ 800,000.<br />
Subtotal: Medium $1,605,000.<br />
Total: $2,405,000.<br />
TABLE 6.1.7:<br />
SUMMARY OF PRIORITIZED LOCAL ACTIONS<br />
FORT ERIE<br />
Element Urban Non-Urban Priority Land Ownership Proponency Cost Assumptions Cost ($1,000’s)<br />
Watercourses • NA<br />
(erosion, fisheries)<br />
Flooding • Public Awareness re: flooding. hazard M Private NPCA/Private Public awareness/stewardship 10<br />
(infrastructure,<br />
floodplain)<br />
Stormwater • Adhere to Town guidelines for new development and infills H Private Development 1 study 20<br />
Management • Retrofit existing development with SWM H Private Development 1 study 200<br />
Water Quality • PS potential contaminant loading in urban centre, treatment<br />
M Region 10<br />
plants.<br />
• Retrofit CSO’s M Town 1 study 20<br />
Natural<br />
Heritage<br />
System<br />
• Extend trees and parkland along the river as opportunity exists –<br />
contribute to migratory corridor.<br />
M NPCA 4000 @ $50 200<br />
Subtotal: High $220,000.<br />
Subtotal: Medium $240,000.<br />
Total: $460,000.<br />
March 2008 194 <strong>Fort</strong> <strong>Erie</strong> <strong>Creeks</strong> <strong>Watershed</strong> <strong>Plan</strong><br />
General Report (105116)
TABLE 6.1.8:<br />
SUMMARY OF PRIORITIZED LOCAL ACTIONS<br />
LAKESHORE DRAIN<br />
Element Urban Non-Urban Priority Land Ownership Proponency Cost Assumptions Cost ($1,000’s)<br />
Watercourses<br />
(erosion, fisheries)<br />
Flooding<br />
(infrastructure,<br />
floodplain)<br />
Stormwater<br />
•<br />
•<br />
•<br />
N/A<br />
N/A<br />
Adhere to Town guidelines for new development and infills H Private Development 1 facility 200<br />
Management • Retrofit existing development with SWM M Private/Public Town 1 study 20<br />
Water Quality<br />
• PS potential contaminant loading in urban centre, treatment<br />
plants<br />
M Public Region 10<br />
Natural Heritage<br />
System<br />
• Protect EPA’s; conserve ECA’s & LSA’s according to OP,<br />
checking for wetland<br />
H Private NPCA/Town 10<br />
• Protect shoreline and natural linkage to inland M Private NPCA 4000 @ 50 200<br />
• Encourage shoreline owners’ incl. Fed. Government, to restore<br />
M Private/Public NPCA 30 ha @ $3.5K/ha 105<br />
coastal marshes, meadows etc.<br />
Subtotal: High $210,000.<br />
Subtotal: Medium $335,000.<br />
Total: $545,000.<br />
TABLE 6.1.9:<br />
SUMMARY OF PRIORITIZED LOCAL ACTIONS<br />
KRAFT DRAIN<br />
Element Urban Non-Urban Priority Land Ownership Proponency Cost Assumptions Cost ($1,000’s)<br />
Watercourses • Erosion control (KFD1-5) – bank protection, H Private NPCA/Private 1000 @ 100 100<br />
(erosion, fisheries) • Reach KFD-1: rehabilitate hardened watercourse edge in<br />
H Private NPCA/Private 400 @ 500 200<br />
downstream half of reach<br />
Flooding • Remediate 1 potential flood damage centres through local floodproofing:<br />
berming/landscaping<br />
H Private NPCA Flood proofing by<br />
87<br />
(infrastructure,<br />
floodplain)<br />
• up to 3 flood-prone structures near the headwater<br />
Stormwater<br />
Management<br />
Peak flow and volume control required in potentially all<br />
subcatchments<br />
Water Quality • Potential point source contaminant loading identified at auto<br />
wrecker on Kraft and chemical plant on Helena.<br />
Natural Heritage • Enhance existing natural areas through slough mosaic<br />
System<br />
reestablishment<br />
H Private Development 5 @ $100 500<br />
M Public/Private Region 50 ha @ 4K/ha 20<br />
M Private NPCA 10 @ $20 200<br />
• Protect EPA’s; conserve ECA’s & LSA’s according to OP H Private NPCA/Town 10<br />
• Encourage shoreline owners to restore coastal habitats, e.g.,<br />
meadows, marshes<br />
• Restore opportunities for corridors to Frenchman’s subwatershed<br />
(and toward the creek crossing of the QEW) via top<br />
end of Bertie Bay sub-watershed<br />
M Private NPCA 5 ha @ $3.5K/ha 17.5<br />
M Private NPCA 5 ha @ $10K/ha 50<br />
Subtotal: High $ 897,000.<br />
Subtotal: Medium $ 287,500.<br />
Total: $1,184,500.<br />
March 2008 195 <strong>Fort</strong> <strong>Erie</strong> <strong>Creeks</strong> <strong>Watershed</strong> <strong>Plan</strong><br />
General Report (105116)
TABLE 6.1.10:<br />
SUMMARY OF PRIORITIZED LOCAL ACTIONS<br />
BERTIE BAY DRAINS & LAKE ERIE 1<br />
Element Urban Non-Urban Priority Land Ownership Proponency Cost Assumptions Cost ($1,000’s)<br />
Watercourses<br />
(erosion, fisheries)<br />
•<br />
•<br />
Reach BBD-2: rehabilitate straightened channel by reestablishing<br />
flow in the existing original natural channel.<br />
Remove culvert at mouth of watercourse that is presently a<br />
H<br />
H<br />
Private<br />
Private<br />
NPCA/Private<br />
NPCA/Private<br />
400 @ 500 200<br />
50<br />
barrier to fish migration<br />
Flooding<br />
(infrastructure,<br />
floodplain)<br />
Stormwater<br />
•<br />
•<br />
N/A<br />
Retrofit existing development with SWM H Private Town 1 Study 20<br />
Management • Peak flow and volume control required in subcatchment<br />
H Private Development 2 Facilities 400<br />
BER 102.<br />
Water Quality<br />
• Crescent Park, Dominion Pumping station overflow M Public Region 1 site specific study 10<br />
Natural Heritage<br />
System<br />
• Protect EPA’s; conserve ECA’s & LSA’s according to OP H Private NPCA Public awareness/stewardship 10<br />
• Where opportunity outside EPA and appropriate landscape (see<br />
M Private NPCA 10 @ $20<br />
200<br />
map NH8) and communities, enhance existing natural areas<br />
through slough mosaic reestablishment<br />
Regrade and replant 10 ha @ $20K/ha<br />
• Protect EPA’s; conserve ECA’s & LSA’s according to OP H Private NPCA/Town Public awareness/stewardship 10<br />
• Investigate if the EPA’s in the southwest corner should be<br />
expanded to accommodate the priority flagged by the Great<br />
Lakes <strong>Conservation</strong> Blueprint (Henson and Brodribb, 2005)<br />
• Enhance existing natural areas through slough mosaic<br />
reestablishment<br />
M Private NPCA Site specific study 10<br />
M Private NPCA 10 ha @ $3.5K/ha 35<br />
• Encourage shoreline owners to restore coastal habitats • Encourage shoreline owners to restore coastal habitats M Private NPCA 60 ha@ $3.5K/ha 210<br />
• Fill in corridor gaps or restore to protect recharge area, when<br />
opportunity<br />
M Private NPCA 5 ha @ $10/ha 50<br />
Subtotal: High $ 690,000.<br />
Subtotal: Medium $ 515,000.<br />
Total: $1,205,000.<br />
March 2008 196 <strong>Fort</strong> <strong>Erie</strong> <strong>Creeks</strong> <strong>Watershed</strong> <strong>Plan</strong><br />
General Report (105116)
TABLE 6.1.11:<br />
SUMMARY OF PRIORITIZED LOCAL ACTIONS<br />
SIX MILE CREEK<br />
Element Urban Non-Urban Priority Land Ownership Proponency Cost Assumptions Cost ($1,000’s)<br />
Watercourses • Erosion control– bank protection, SMC-S H Private NPCA/Private 500m m $200/m 100<br />
(erosion, fisheries) • Removal of on-line ponds (MND-2, MND-5) H Private NPCA/Private 2 x $50/m 100<br />
• Rehabilitate straightened channels (Reaches SMC M Private NPCA/Private 600 x $500/m 300<br />
Flooding<br />
(infrastructure,<br />
• Remediate 5 potential flood damage centres, through<br />
conveyance improvements, and potentially local flood-proofing:<br />
H Private NPCA/Town 753<br />
floodplain)<br />
• up to 25 flood-prone structures near the mouth, Bethune<br />
and Shirley<br />
• 3 on Centralia (sheets 2,4)<br />
• 1 at Bernard and Nigh<br />
• 16 at Dominion and Burleigh, on the Mann drain<br />
• upgrade 4 culverts that create significant backwater during the<br />
H Public Town 2 culverts @ $200K<br />
700<br />
100 year event<br />
2 culverts @ $150K<br />
Stormwater<br />
• Peak flow and volume control required in central and upper<br />
H Private Development 4 facilities 800<br />
Management<br />
subcatchments, and MAN102<br />
Water Quality • • PS potential contaminant loading identified at. Auto wrecker on<br />
M Private Region 1 site specific study 10<br />
Stonemill south of Garrison Road<br />
Natural Heritage • Protect EPA’s; conserve ECA’s & LSA’s according to Official<br />
H Private NPCA Public awareness/stewardship 10<br />
System<br />
<strong>Plan</strong><br />
• Enhance existing non-EPA natural areas through slough mosaic<br />
M Private NPCA 20 ha @ $3.5K/ha 70<br />
reestablishment, if appropriate opportunity<br />
• Protect EPA’s; conserve ECA’s & LSA’s according to OP H Private NPCA/Town 10<br />
• Enhance existing non-EPA natural areas through slough mosaic<br />
reestablishment, if appropriate opportunity<br />
M Private NPCA 30 ha @ $3.5K/ha 105<br />
• Encourage shoreline owners to restore coastal habitats • Encourage shoreline owners to restore coastal habitats M Private NPCA 70 ha @ $3.5K/ha 245<br />
• Extend corridor linkages northward and westward and along<br />
creeks<br />
M Private NPCA 30 ha @ $10K/ha 300<br />
Subtotal: High $2,473,000.<br />
Subtotal: Medium $1,030,000.<br />
Total: $3,503,000.<br />
March 2008 197 <strong>Fort</strong> <strong>Erie</strong> <strong>Creeks</strong> <strong>Watershed</strong> <strong>Plan</strong><br />
General Report (105116)
Cost Summary<br />
Each of the subwatershed tables has sub-totals for recommended actions, split into High and<br />
Medium priorities. A total of $19,673,000 is the preliminary cost estimate for the recommended<br />
actions.<br />
This can be broken down into the sub-totals for the High priority list: $9,708,000.<br />
Medium priority list: $9,965,000.<br />
Watercourses<br />
6.2 Discussion on Monitoring and Adaptive Management <strong>Plan</strong><br />
The installation of geomorphic control sites established across the study area through the detailed<br />
geomorphic field effort will provide an invaluable tool for future studies to both qualitatively and<br />
quantitatively assess future change within the study area. Monitoring sites have been placed<br />
strategically at key locations within each subwatershed to provide results that are both spatially<br />
representative and indicative of the geomorphic variability within the watershed.<br />
Results of future erosion monitoring can be fed back into the watershed plan, and locations that<br />
are exhibiting above-normal or unexpected rates of erosion can be addressed before all of the<br />
proposed future development proceeds.<br />
Natural Heritage System<br />
The natural heritage monitoring plan should strive for an optimum balance of necessary data and<br />
pragmatism. The latter is essential to ensure the on-going implementation basic to successful<br />
monitoring. Existing monitoring should be used where possible and appropriate. Involvement<br />
of local volunteers can help build ownership to their watershed and a sense of place. Indicators<br />
should link to watershed goals, objectives and targets and include each of Stressor, Ecological<br />
Effect and Human Response aspects to help capture the linkages, resulting progress and<br />
understanding of any necessary adaptations in the management response. Regular progress<br />
reports should be simple and clear for maximum outreach to the residents.<br />
Table 6.1 proposes a set of possible indicators toward meeting the above criteria. Valid<br />
monitoring depends on replication. Each indicator will need clear presentation of what exactly<br />
the measure is, the protocol, endpoint, features (scale, time periods, variability), interpretation,<br />
limitations, illustration, implementation. Indicators with volunteer participation should use<br />
standard methodologies designed for non-experts and for valid comparisons with monitoring<br />
elsewhere. The suggestions are preliminary: monitoring system development will depend on<br />
local capacity and on integration with monitoring of watercourses and stormwater management.<br />
Monitoring results can be used to adjust the watershed plan actions and to ease stressors, where<br />
appropriate and feasible.<br />
March 2008 198 <strong>Fort</strong> <strong>Erie</strong> <strong>Creeks</strong> <strong>Watershed</strong> <strong>Plan</strong><br />
General Report (105116)
TABLE 6.1:<br />
SOME POSSIBLE INDICATORS FOR MONITORING OF TERRESTRIAL NATURAL HERITAGE<br />
Aspect Indicator Approach Frequency Agency<br />
Stressor Area ECAs and LSAs developed Log as occur annual Town<br />
Perimeter of EPAs abutting new development Log as occur annual Town<br />
Building permits within 200 m of lake shore Log as occur annual Town<br />
Population Density<br />
Census years<br />
5 years NPCA<br />
Air photo measured area<br />
Effect % forest, % interior, % riparian Air photos 5 years NPCA<br />
Amphibians species and numbers<br />
FrogWatch or Marsh<br />
annual NPCA with volunteers<br />
Monitoring Program<br />
Fowler’s Toad numbers Check with Recovery <strong>Plan</strong> annual NPCA with volunteers<br />
Date first flowering white trillium, white water <strong>Plan</strong>tWatch annual NPCA with volunteers<br />
lily, wild strawberry<br />
Corridor completeness<br />
% of corridor system with 5 years NPCA<br />
natural cover: air photo<br />
Response Area of slough mosaic landscape restored Log as occur annual NPCA<br />
Area restored within 200 m of lakeshore Log as occur annual NPCA<br />
# <strong>Fort</strong> <strong>Erie</strong> students at outdoor education at least 1<br />
day/year<br />
Log as occur annual Boards of Education<br />
Stormwater Management<br />
Stormwater management monitoring is proposed to be conducted by the development proponent<br />
for the new facilities, to determine whether they are functioning as designed, in terms of<br />
pollutant removal, temperature and other water quality and quantity indicators, prior to<br />
assumption by the Municipality.<br />
6.3 Future Studies<br />
Subsequent to the publication of the <strong>Fort</strong> <strong>Erie</strong> <strong>Creeks</strong> <strong>Watershed</strong> <strong>Plan</strong>, there will be a need for<br />
other secondary level studies to “bridge the gap” between this watershed-scale study and actual<br />
implementation of the recommended works at a local level. These studies may originate with<br />
development, e.g. plans of subdivision or site plans, or the studies may be a part of restoration<br />
initiatives that are brought forward by the NPCA or other Public or Private stakeholders.<br />
Regardless of the proponency, the studies would be subject to various agency approval<br />
requirements.<br />
Normally these studies would consist of:<br />
• Subwatershed <strong>Plan</strong>s<br />
• Master Drainage <strong>Plan</strong>s<br />
• Locally-specific Restoration Initiatives<br />
• Class Environmental Assessments<br />
• Function Stormwater Management Reports<br />
• Environmental Impact Studies, and<br />
• other Private-sector Development Initiatives.<br />
One example of an identified study would be the further detailed assessment of potential flood<br />
damage locations (ref. Watercourse Technical Appendix ‘WC-G’). The NPCA has identified<br />
several locations that will require further detailed study (e.g. ground survey) to determine the<br />
extent of potential damage and a more detailed design of mitigation measures.<br />
March 2008 199 <strong>Fort</strong> <strong>Erie</strong> <strong>Creeks</strong> <strong>Watershed</strong> <strong>Plan</strong><br />
General Report (105116)
In terms of water quality, the NPCA has developed a Draft Restoration Program and Water<br />
Quality Improvement Project (NPCA 2007) which is intended to provide guidance and<br />
information on funding for future studies and projects.<br />
6.4 Implementation Committee<br />
Further specifics with respect to stewardship programs, and other restoration requirements will<br />
be developed after the <strong>Watershed</strong> <strong>Plan</strong> is finalized. The next step proposed by the NPCA is the<br />
formation of Implementation Committees, consisting of representatives from:<br />
‣ NPCA<br />
‣ Town of <strong>Fort</strong> <strong>Erie</strong><br />
‣ Regional Municipality of <strong>Niagara</strong><br />
‣ <strong>Niagara</strong> Parks Commission<br />
‣ Parks Canada<br />
One of the roles of the Implementation Committee is to oversee the implementation of<br />
monitoring; either general monitoring of the watershed, or specific monitoring that is developed<br />
through the future studies. The Implementation Committee will monitor the progress and<br />
success of the <strong>Fort</strong> <strong>Erie</strong> <strong>Creeks</strong> <strong>Watershed</strong> <strong>Plan</strong>, measuring the effectiveness of the implemented<br />
projects in achieving the <strong>Watershed</strong> <strong>Plan</strong> Objectives. Typically, <strong>Watershed</strong> <strong>Plan</strong> would be<br />
reviewed by the NPCA and the Implementation Committee on an annual basis. The <strong>Watershed</strong><br />
<strong>Plan</strong> may be amended from time to time to address changes that occur to the study area,<br />
landowners, agencies, stakeholders, and the NPCA.<br />
It is recommended that the Implementation Committee assess the ongoing monitoring program<br />
conducted by the NPCA. Additional monitoring by other stakeholders (both historic and<br />
proposed) could potentially be reviewed for opportunities to obtain more data.<br />
As a follow-up to the <strong>Watershed</strong> <strong>Plan</strong>, the participating landowners and stakeholders should be<br />
surveyed as part of the future <strong>Watershed</strong> <strong>Plan</strong> review.<br />
The Municipalities in the study area (<strong>Fort</strong> <strong>Erie</strong>, Port Colborne, and <strong>Niagara</strong> Falls) would<br />
potentially be represented on the Implementation Committee, and any updates to their Official<br />
<strong>Plan</strong>s would need to be reviewed in the context of the <strong>Watershed</strong> <strong>Plan</strong>.<br />
March 2008 200 <strong>Fort</strong> <strong>Erie</strong> <strong>Creeks</strong> <strong>Watershed</strong> <strong>Plan</strong><br />
General Report (105116)
7. CONCLUSIONS<br />
The <strong>Fort</strong> <strong>Erie</strong> <strong>Creeks</strong> <strong>Watershed</strong> <strong>Plan</strong> is a proactive document, created co-operatively by<br />
government agencies and the community to manage the water, land/water interactions, aquatic<br />
life, and aquatic resources, to protect the health of the ecosystem as land uses change (<strong>Niagara</strong><br />
<strong>Peninsula</strong> <strong>Conservation</strong> Authority, Terms of Reference, 2005).<br />
The <strong>Fort</strong> <strong>Erie</strong> <strong>Creeks</strong> study area is comprised of a mixture of rural and urban areas, with a large<br />
percentage of agricultural land use. There are numerous watercourses and each reach has been<br />
characterized and assigned an integrated net constraint rating, base on fisheries, wildlife,<br />
wetlands, woodlots, stream morphology, erosion and flooding characteristics, and objectives.<br />
A list of actions in the <strong>Watershed</strong> <strong>Plan</strong> has been developed with the agencies and the public. The<br />
NPCA will oversee the implementation of the <strong>Watershed</strong> <strong>Plan</strong>, together with the other public,<br />
Municipal, and agency representatives on the Implementation Committee. The progress made on<br />
the <strong>Watershed</strong> <strong>Plan</strong> initiatives will be reported by the Implementation Committee. The<br />
<strong>Watershed</strong> <strong>Plan</strong> will allow for the preservation, restoration, and enhancement of the natural<br />
ecosystem within the watershed study area. With the level of public involvement observed<br />
during the preparation of the <strong>Watershed</strong> <strong>Plan</strong>, it is hoped that environmental stewardship will<br />
play an important role in the implementation of the recommended list of actions.<br />
March 2008 201 <strong>Fort</strong> <strong>Erie</strong> <strong>Creeks</strong> <strong>Watershed</strong> <strong>Plan</strong><br />
General Report (105116)
REFERENCES<br />
American Forests, 1999. Regional Ecosystem Analysis Canton-Akron Metropolitan Area:<br />
Calculating the Value of Nature. Final Report 2/9/99 sponsored by the USDA Forest Service.<br />
Cited by Dougan and Associates, 2003.<br />
Austin, M.J.W. and M. S.W. Bradstreet. 1996. The effects of fragmentation on forest birds and<br />
plants in southern Ontario: Recommendations for woodland conservation and restoration. Long<br />
Point Bird Observatory. Port Rowan Ontario. Cited by Environment Canada, 2004.<br />
Argus, G.W., K.M. Pryor, and D.J. White eds. 1987. Atlas of the Rare Vascular <strong>Plan</strong>ts of<br />
Ontario: Part 4. National Museum of Natural Sciences. Ottawa Ontario.<br />
Becker, G.C. 1983. Fishes of Wisconsin. Univ. of Wisconsin Press. Madison, Wisconsin.<br />
Bert Miller Nature Club. 2006. Preliminary Results from the <strong>Fort</strong> <strong>Erie</strong> Agricultural Area Natural<br />
Areas Inventory. Appendix 2 ELC Forms. Town of <strong>Fort</strong> <strong>Erie</strong>, Ontario.<br />
Bird Studies Canada. <strong>Niagara</strong> River Corridor IBA Site Listing.<br />
http://www.bsc-eoc.org/iba/site.jspsiteID=ON002<br />
Bruce, J., T. Dickinson and D. Lean. 2006. <strong>Plan</strong>ning for Extremes – Adapting to Impacts of Soil<br />
and Water from Higher Intensity Rains with Climate Change. Presentation to Soil and water<br />
<strong>Conservation</strong> Society: Ontario Chapter’s 2006 Annual Symposium. Burlington Ontario February<br />
24, 2006.<br />
Brunet, G., S. Enns, and M. Tae. 1987. Summary of Lake <strong>Erie</strong> smallmouth bass spawning<br />
survey, fronting <strong>Fort</strong> <strong>Erie</strong>, <strong>Niagara</strong> District.<br />
Cadman, M.D, P.F.J. Eagles and F.M. Helleiner. 1987. Atlas of the Breeding Birds of Ontario.<br />
Univ.of Waterloo Press. Waterloo ON. Cited by Environment Canada, 2004.<br />
Carolinian Canada. Carolinian. 2004. Species and Habitats.<br />
http://www.carolinian.org/SpeciesHabitats.htm<br />
Carolinian Canada. 2000. The Big Picture: Cores and Connections in Carolinian Canada.<br />
http://www.carolinian.org/<strong>Conservation</strong>Programs_BigPicture.htm<br />
City of Port Colborne. 2005. Draft Official <strong>Plan</strong>.<br />
COSEWIC (Committee on the Status of Endangered Wildlife in Canada). 2005. Canadian<br />
Species at Risk. Committee on the Status of Endangered Wildlife in Canada. Web site:<br />
http://www.cosewic.gc.ca/eng/sct0/rpt/rpt_csar_e.cfm<br />
de Loë, R. and A. Berg. 2006. Mainstreaming Climate Change in Drinking Water Source<br />
Protection <strong>Plan</strong>ning in Ontario. Report for Pollution Probe and Canadian Water Resources<br />
Association. http://www.pollutionprobe.org/Reports/mainstreaming_climate_change_swp.pdf<br />
Department of Fisheries and Oceans (DFO). 1998. Habitat <strong>Conservation</strong> and Protection Guidelines.<br />
Developed from the Policy for the Management of Fish Habitat (1986), Second Edition. 25 pp.<br />
March 2008 202 <strong>Fort</strong> <strong>Erie</strong> <strong>Creeks</strong> <strong>Watershed</strong> <strong>Plan</strong><br />
General Report (105116)
Dillon Consulting, Brook McIlroy Inc., Clara Consulting, Lapointe Consulting Inc. Natural<br />
Environment Issues and Options Background Paper. The Municipality of Port Colborne New<br />
Official <strong>Plan</strong>, <strong>Plan</strong>ning and Development Services.<br />
Dougan and Associates. 2003. Natural Areas Inventory: Town of <strong>Fort</strong> <strong>Erie</strong> Settlement Areas.<br />
Prepared for the <strong>Fort</strong> <strong>Erie</strong> Community <strong>Plan</strong>ning and Development Services.<br />
Energy, Mines and Resources Canada. National Topographic System 30L/14 (Editions 3-7;<br />
Printed 1938, 1973, 1978, 1983, 1996) and 30L/15 (Editions 1-5; Printed 1955, 1974, 1977,<br />
1983, 1994). 1:50,000.<br />
Environment Canada and U.S. EPA (leads), Lake LaMP Work Group. 2006. Lake <strong>Erie</strong> Lakewide<br />
Management <strong>Plan</strong>: 2006 Update http://www.epa.gov/glnpo/lakeerie/2006update/index.html<br />
Environment Canada. 2004a. How Much Habitat is Enough A Framework for Guiding Habitat<br />
Rehabilitation in Great Lakes Areas of Concern. Second Edition. Canadian Wildlife Service,<br />
Downsview, Ontario. ISBN 0-662-35918-6. www.on.ec.gc.ca/wildlife/publications-e.html<br />
Environment Canada. 2004b. The Species at Risk Act in Ontario: Facts. Canadian Wildlife<br />
Service, Downsview Ontario.<br />
Environment Canada, Ontario Ministry of Natural Resources, Federation of Ontario Naturalists,<br />
Nature Conservancy Canada. 2000. Great Lakes Wetlands <strong>Conservation</strong> Action <strong>Plan</strong> Highlights<br />
Report. Canadian Wildlife Service, Downsview Ontario.<br />
Freemark, K. 1988. Landscape ecology of forest birds in the Northeast. Pp. 7-12. In: DeGraaf,<br />
R.M. and W.M. Healy (eds.). United States Department of Agriculture, Northeast Forest<br />
Experimental Station, General Technical Report NE-140. Cited by Environment Canada, 2004.<br />
Garafalo, Albert. Natural Heritage Biologist, Aurora District, Ontario Ministry of Natural<br />
Resources. Bert Miller Nature Club field biologist. Pers. Comm., March 20, 2006.<br />
Gartner Lee Limited, 1987. Water Resources of the <strong>Niagara</strong> Frontier and the Welland River<br />
Drainage Basin (prepared for the Ontario Ministry of the Environment).<br />
Havinga, D. and the Ontario Invasive <strong>Plan</strong>ts Working Group. 2000. Sustaining Biodiversity: A<br />
Strategic <strong>Plan</strong> for Managing Invasive <strong>Plan</strong>ts ion Southern Ontario. City of Toronto, Parks and<br />
Recreation.<br />
Henson, B.L. and K.E. Brodribb. 2005. Great Lakes <strong>Conservation</strong> Blueprint for Terrestrial<br />
Biodiversity. Nature Conservancy of Canada and Natural Heritage Information Centre, Ministry<br />
of Natural Resources. Queen’s Printer. ISBN 0-9695980-6-8.<br />
Hey, D.L. and J.A. Wickencamp. 1996. Effects of wetland on modulating hydrologic regimes in<br />
nine Wisconsin watersheds. The Wetlands Initiative. Chicago, Illinois. Cited by Environment<br />
Canada, 2004.<br />
March 2008 203 <strong>Fort</strong> <strong>Erie</strong> <strong>Creeks</strong> <strong>Watershed</strong> <strong>Plan</strong><br />
General Report (105116)
Kingston, M.S. and E.W. Presant. 1989. The Soils of the Regional Municipality of <strong>Niagara</strong>.<br />
Report No. 60 of the Ontario Institute of Pedology. Guelph Ontario.<br />
Land Care <strong>Niagara</strong>. 1998. Natural Heritage Framework.<br />
http://www.landcareniagara.com/programs/images/framework.pdf<br />
Larsen, B.M., J.L. Riley, E.A. Snell and H.G. Godschalk. 1999. Woodland Heritage of Southern<br />
Ontario: A Study of Ecological Change, Distribution and Significance. Federation of Ontario<br />
Naturalists, Don Mills Ontario.<br />
MacViro, Philips Engineering and CH2MHill, 2002. <strong>Niagara</strong> Water Quality Protection Strategy<br />
(NWQPS) Phase 2: Characterization. A project for the Regional Municipality of <strong>Niagara</strong>,<br />
<strong>Niagara</strong> <strong>Peninsula</strong> <strong>Conservation</strong> Authority and Ontario Ministry of the Environment.<br />
Mortsch, L., E. Snell and J. Ingram. 2006. “Climate Variability and Change Within the Context<br />
of the Great Lakes Basin”. Chapter 2 in Mortsch, L. J. Ingram, A. Hebb and S. Doka (eds.).<br />
2006. Great Lakes Coastal Wetland Communities: Vulnerability of Climate Change and<br />
Response to Adaptation Strategies. Final report submitted to the Climate Change Impacts and<br />
Adaptation Program, Natural Resources Canada. Environment Canada and the Department of<br />
Fisheries and Oceans, Toronto Ontario.<br />
Natural Heritage Information Centre. 2006. http://nhic.mnr.gov.on.ca/nhic_.cfm<br />
<strong>Niagara</strong> <strong>Peninsula</strong> <strong>Conservation</strong> Authority. 2005. <strong>Watershed</strong> Management Information System<br />
and Natural Heritage Database. Geoff Verkade, GIS Department.<br />
<strong>Niagara</strong> <strong>Peninsula</strong> <strong>Conservation</strong> Authority, Ontario Ministry of the Environment and<br />
Environment Canada. <strong>Niagara</strong> River Area of Concern Remedial Action <strong>Plan</strong>.<br />
http://www.on.ec.gc.ca/water/raps/niagara/intro_e.html<br />
Ontario Ministry of Environment and Energy. 1993. Water Management on a <strong>Watershed</strong> Basis:<br />
Implementing an Ecosystem Approach.<br />
Ontario Ministry of Municipal Affairs and Housing. 2005. Provincial Policy Statement.<br />
OMNR (Ontario Ministry of Natural Resources). 2000. Significant Wildlife Habitat Technical<br />
Guide. 151 pp.<br />
OMNR (Ontario Ministry of Natural Resources). 2002. Overview of Ontario’s Forests.<br />
http://ontariosforests.mnr.gov.on.ca/forestoverview.cfm<br />
OMNR (Ontario Ministry of Natural Resources). 2005. Species at Risk in Ontario List. (Issued<br />
by Ontario Ministry of Resources’ Species at Risk Section on December 16, 2005)<br />
http://www.ontarioparks.com/saro-list.pdf<br />
Ontario Ministry of Natural Resources. 2005. Ontario Biodiversity Strategy: Draft.<br />
http://www.mnr.gov.on.ca/mnr/biodiversity/biodiversity_eng.pdf<br />
Ontario Ministry of Natural Resources. 2005. Wetland Evaluations.<br />
March 2008 204 <strong>Fort</strong> <strong>Erie</strong> <strong>Creeks</strong> <strong>Watershed</strong> <strong>Plan</strong><br />
General Report (105116)
Ontario Ministry of Natural Resources (OMNR). 1999. Natural heritage reference manual. For<br />
Policy 2.3 of the Provincial Policy Statement.<br />
Ontario Ministry of Public Infrastructure Renewal. 2006. Places to Grow: Better Choices.<br />
Brighter Future: Growth <strong>Plan</strong> for the Greater Golden Horseshoe.<br />
Regional Municipality of <strong>Niagara</strong>. 2005. New Environmental Policies.<br />
http://www.regional.niagara.on.ca/living/epc/pl_env_policies.aspx<br />
Scott, W.B and E.J. Crossman. 1973. Freshwater fishes of Canada. Fisheries Research Board<br />
of Canada. Bulletin 183. Ottawa, Canada. 966pp.<br />
Snell, E.A. and Astolfo, R. 2006. Wetland Sensitivity to Climate Change Rated by Quaternary<br />
<strong>Watershed</strong>s if Ontario’s Great Lakes Basin: A Lake Ontario Pilot. A project of the Water Use<br />
and Supply Project (WUSP, Environment Canada, Burlington and Ontario Ministry of Natural<br />
Resources, Peterborough.<br />
Snell, E., L. Mortsch and M. Galloway. 2006. “Forward Marsh! Is the Coast Clear: Land Use<br />
<strong>Plan</strong>ning as a Climate Change Adaptation Strategy for Great Lakes Coastal Wetlands.” Section<br />
8.3 of Mortsch, L. J. Ingram, A. Hebb and S. Doka (eds.). 2006. Great Lakes Coastal Wetland<br />
Communities: Vulnerability of Climate Change and Response to Adaptation Strategies. Final<br />
report submitted to the Climate Change Impacts and Adaptation Program, Natural Resources<br />
Canada. Environment Canada and the Department of Fisheries and Oceans, Toronto Ontario.<br />
Snell, E.A., L. Hua and B. McHattie.1998. Wetland Extent Guidelines: Application to the<br />
<strong>Niagara</strong> River Area of Concern. Great Lakes 2000 Cleanup Fund, Burlington Ontario.<br />
Tate, D.P. 1998. Assessment of the Biological Integrity of Forest Bird Communities: A Draft<br />
Methodology and Field Test in the Severn Sound Area of Concern. Severn Sound RAP Technical<br />
Report. Canadian Wildlife Service – Ontario Region. Cited by Environment Canada, 2004.<br />
Town of <strong>Fort</strong> <strong>Erie</strong>. 2006. Proposed Draft Official <strong>Plan</strong> for the Town of <strong>Fort</strong> <strong>Erie</strong>.<br />
http://www.town.forterie.ca/WebSite/tofeweb.nsf/0/C2DD67199E14C62585256FF5004A7935<br />
OpenDocument.<br />
Vlasman, Kara. District Species At Risk Biologist, Guelph District/<strong>Niagara</strong> Area Office,<br />
Vineland Station ON. Pers. comm. with Karl Konze, January 10, 2006.<br />
Waterloo Hydrologic, 2005<br />
March 2008 205 <strong>Fort</strong> <strong>Erie</strong> <strong>Creeks</strong> <strong>Watershed</strong> <strong>Plan</strong><br />
General Report (105116)
GLOSSARY OF TERMS<br />
Alluvial Soil<br />
Sediments deposited by recent flood processes. They are variable textures and drainage but are<br />
usually imperfectly or poorly drained.<br />
Aquatic<br />
Growing in, living in, or dependent upon water.<br />
Aquifer<br />
A water bearing geological formation. An aquifer can consist of sand, gravel, or rock formations<br />
and is capable of storing and conveying water.<br />
Basin<br />
See “<strong>Watershed</strong>”.<br />
Benthic<br />
Any organism or collection of organisms (animals or plants) that live on the bottom of a lake,<br />
river or other waterbody.<br />
Best Management Practice (BMP)<br />
Any management practice, either structural or non-structural, used to address impacts from land<br />
use changes (increased runoff from urban surfaces, agricultural practices, etc.).<br />
Biodiversity<br />
The genetic, taxonomic and ecosystem variety of a given area<br />
Catchment Area<br />
See Drainage Basin.<br />
Conduit<br />
Conduit is any open or close channel used to convey water.<br />
Contaminant<br />
Any chemical and biological substance in air, water or soil that makes it unsuitable for its<br />
intended use or consumption is considered as contaminant. Contaminants could result from<br />
natural or unnatural activities.<br />
Contours<br />
A line on a map joining points of same elevation. See also “Topography”.<br />
Corridor<br />
Elongate, naturally vegetated area that links larger natural areas. Corridors provide for<br />
movement and interchange of plant and animal species necessary for their long-term<br />
maintenance.<br />
Creek<br />
A small stream draining a small drainage basin.<br />
March 2008 206 <strong>Fort</strong> <strong>Erie</strong> <strong>Creeks</strong> <strong>Watershed</strong> <strong>Plan</strong><br />
General Report (105116)
Culvert<br />
Any closed channel or large size pipe use to convey water below ground over a short distance<br />
usually across roadways or railways.<br />
Detention Pond<br />
System to detain stormwater for a specific time and ultimately discharges completely to a<br />
downstream receiver. The purpose of this facility may be to attenuate high peak flows and slowly<br />
release them to downstream waterways.<br />
Discharge Zone<br />
Areas where groundwater meets the surface (Typically in stream) and adds flow in the form of<br />
base flow to the stream from groundwater.<br />
Dissolved oxygen (DO)<br />
Oxygen that is present in water and available for aquatic organism respiration.<br />
Downstream<br />
Is the direction of the flow of a stream or river; (i.e. down river).<br />
Drainage<br />
Removal of excess surface or subsurface ground water from land segments. Removal could be<br />
by naturally or open ditch, stream or subsurface system. Soil characteristics will determine<br />
natural drainage of any land.<br />
Drainage Basin<br />
Drainage basin or catchment area is an area that drains by a stream, creek or any other water<br />
body. The boundary or limits of a drainage basin separate it from neighbouring drainage systems<br />
by heights of land between them. The amount of precipitation, size and physical characteristics<br />
of drainage basin, determine peak flows and amount of water which can reach the end of a<br />
drainage basin.<br />
Dredging<br />
Removal of sediment from the bottom of a waterbody.<br />
Dry Pond<br />
A detention basin (see “Detention Pond”) which does not hold water during non-storm periods<br />
(i.e. it is dry with no permanent pool).<br />
Ecological Services<br />
Benefits that humans derive from ecological functions such as photosynthesis, oxygen<br />
production and water purification.<br />
Ecosystem<br />
A biological community and its interaction with its environment.<br />
E. coli<br />
Abbreviation for Escherichia coli, a disease caused by fecal coliform bacteria.<br />
March 2008 207 <strong>Fort</strong> <strong>Erie</strong> <strong>Creeks</strong> <strong>Watershed</strong> <strong>Plan</strong><br />
General Report (105116)
Enhancement<br />
Strategies and actions to improve the function and health of the ecosystem.<br />
Erosion<br />
Erosion is a physical process by which land is lost by air, water, ice, or gravity processes.<br />
Erosion Hazards<br />
Loss of land due to human or natural processes which may pose a threat to life and property.<br />
Evaluated Wetland<br />
A wetland (see Wetland) that has been visited, mapped and rated using the standard Southern<br />
Ontario Wetland Evaluation System.<br />
Evapotranspiration<br />
It is a combination of two terms Evaporation and Transpiration. Evapotranspiration is a<br />
combined loss of water through evaporation and plant transpiration process. It is commonly used<br />
in agriculture for estimating plant water requirements through its natural growth cycle.<br />
Fecal Coliform Bacteria<br />
A small disease causing, micro-organism present in human and animal feces and is used as an<br />
indicator of other disease causing bacteria. E. coli is one of these micro-organisms.<br />
Fill Line<br />
Fill lines are usually shown as straight lines delineated outside floodplains, following existing<br />
features such as fences, roads, etc. It identifies the area where future development and/or filling<br />
is restricted.<br />
Filter strips (also know as buffer strips)<br />
Some time also called “riparian zones” or “filter strips”. A strip of land along a water body<br />
typically planted with natural vegetation from grasses to small forest. Vegetation filters<br />
stormwater and is a quality control method suitable for low flows, typically recommended for<br />
agricultural and low-density development.<br />
Flood line<br />
Lines marked on map identifying limits of regulatory flooding along a designated river or creeks.<br />
See also “Floodplain”.<br />
Floodplain<br />
Area adjacent to streams or rivers that would be inundated by flooding during a Regulatory<br />
storm (such as Hurricane Hazel Storm (1954) or 100-year event). It has been generally applied to<br />
watercourses that drain areas greater than 125 ha.<br />
Forebay<br />
Forebay is a stormwater Best Management Practice (BMP) that serves as a storage and trap to<br />
incoming coarse particles. Generally it is followed by a secondary treatment system (i.e. wetland<br />
or wet pond) before discharging to receiving waters (i.e. creek, lakes).<br />
March 2008 208 <strong>Fort</strong> <strong>Erie</strong> <strong>Creeks</strong> <strong>Watershed</strong> <strong>Plan</strong><br />
General Report (105116)
Forest Patch<br />
The polygon formed by the mapped outline of the forest.<br />
Fragmentation<br />
The process where natural area clearance for agriculture and urbanization results in decreasing<br />
natural area size, increasing intrusions within and separation among natural areas. It is<br />
considered a serious threat to habitat value and to biodiversity.<br />
Functions (Ecological)<br />
The processes – chemical, physical and biological - within an ecosystem that maintain its<br />
communities and interact with its adjacent ecosystems.<br />
Geographic Information System (GIS)<br />
A system of computer software that is capable to process spatial data. It links tabular information<br />
(charts, databases etc.) with spatial data (maps, aerial photography).<br />
Grassed Swales<br />
Grassed swales are a recognized BMP, usually in the form of ditches with mild slopes often<br />
planted with marshy plants and grasses. Mild slopes encourage ponding of stormwater and<br />
allows for the quality control of stormwater.<br />
Green Infrastructure<br />
Ecological features and processes, both natural and engineered, that directly improve the<br />
functioning of human communities. It includes natural areas, aquatic systems, urban trees, green<br />
roofs etc. that contribute to such roles as flood abatement, water quality protection and<br />
microclimate moderation.<br />
Groundwater<br />
Subsurface water below groundwater table within a saturated water zone. Contrast to “Surface<br />
Water”.<br />
Habitat<br />
Place where a particular type of plant or animal lives. An organism’s habitat must provide all of<br />
the basic requirements for its life.<br />
Herbicide<br />
Chemicals used in agricultural activities to kill unwanted vegetation and weeds.<br />
Hydrology<br />
Science that deals with the water of earth and its cycle. The cycle includes precipitation,<br />
evapotranspiration, surface flows, infiltration, ground water recharge and waterbodies.<br />
Hydrologic cycle<br />
The hydrological cycle renew our fresh water resources. The cycle includes precipitation,<br />
evapotranspiration, surface flows, infiltration, ground water recharge and waterbodies.<br />
Hydrogeology<br />
Science of groundwater, including groundwater movement and its chemistry.<br />
March 2008 209 <strong>Fort</strong> <strong>Erie</strong> <strong>Creeks</strong> <strong>Watershed</strong> <strong>Plan</strong><br />
General Report (105116)
Hydraulics<br />
Science pertaining to flowing or moving water in open channels or close conduits.<br />
Hydrocarbon<br />
A class of substances which consist of carbon and hydrogen. Generally petroleum products are<br />
called hydrocarbons.<br />
Infiltration<br />
Infiltration is the process through which water flows from the soil surface to the subsurface soil.<br />
Also includes the flow of subsurface water to subsurface conduits: like tiles or sewers through<br />
cracks or broken joints.<br />
Inlet<br />
An inlet is an entrance to a storm sewer or other waterbody including a stormwater management<br />
facility.<br />
Interior Forest<br />
The central portion of a forest patch (see above) that is far enough away from the forest edge to<br />
be relatively free of influences of adjoining land uses, better reflecting pre-settlement habitat<br />
conditions.<br />
Lacustrine Soil<br />
Soil developed on sediments deposited in post-glacial lakes.<br />
Landfill<br />
Area of land, pit, or excavation used for the permanent disposal of waste, typically engineered<br />
complete with a leachate management system (see also Old Fill Site).<br />
Leaching<br />
Leaching is the process by which soluble constituents dissolve in water or other solvent and are<br />
carried down through the soil.<br />
Load or Lading<br />
The amount of a material entering a system over a given time interval.<br />
Lowland<br />
An area where poorly drained soils are dominant.<br />
Major System<br />
Term used in hydrology when heavy rain storms cause an overflow of the “minor system” (i.e.<br />
storm sewer) and flow through the “major system”, which could consist of roads and major<br />
drainage channels. Also see “minor system”.<br />
Marsh<br />
Marsh is a wetland overgrown with coarse grasses, sedges, and rushes. It is subject to periodic<br />
flooding and in fact may depend on some natural variation in water level.<br />
March 2008 210 <strong>Fort</strong> <strong>Erie</strong> <strong>Creeks</strong> <strong>Watershed</strong> <strong>Plan</strong><br />
General Report (105116)
Master Drainage <strong>Plan</strong><br />
A comprehensive report/process which defines the method of managing runoff quantity and<br />
quality for existing and future land uses.<br />
Mesic<br />
An intermediate degree of wetness between well drained and poorly drained where imperfectly<br />
drained soils dominate.<br />
Micron<br />
A unit of measurement used for one millionth of a metre.<br />
Micro-organism<br />
Entities that cannot be seen without the aid of a microscope, including bacteria, viruses etc.<br />
Mineral Soil<br />
Soil consisting mainly of clay, silt or sand.<br />
Minor System<br />
The minor system consists of drainage pipes, roadway gutters, enclosed conduits, and roof leader<br />
connections designed to convey runoff from frequent, less intense storms, to eliminate or<br />
minimize inconvenience in the area served.<br />
Municipal Drains<br />
Municipal drains are constructed ditches and close conduits constructed primarily in rural areas,<br />
under the authority of Drainage Act. Their main purpose is to improve drainage of agricultural<br />
lands, it also convey excessive water collected by roadside ditches, residential areas, industrial<br />
area, etc.<br />
National Topographic System (NTS)<br />
Standard topographic maps at the scale of 1:50,000 which cover all of Canada.<br />
Natural Heritage<br />
Terrestrial natural areas including their habitats, species and ecological services.<br />
Nitrification<br />
Is a biochemical process through which ammonium nitrogen is transformed to nitrate nitrogen.<br />
Non-Point Source pollutant (NPS)<br />
Pollutants that discharge to waterbodies from sources other than a specific location or outlet.<br />
Agricultural activities are major source of NPS pollutants, where a large number of chemicals<br />
are used and a portion reach to the water bodies through various physical processes over time.<br />
Nutrient Management <strong>Plan</strong><br />
A plan prepared for a farm to manage and document the plant nutrients (nitrogen, phosphorus<br />
and potassium) from all sources, organic (biosolids, manure, sludge etc), chemical fertilizer,<br />
legume nitrogen fixation and crop residues.<br />
March 2008 211 <strong>Fort</strong> <strong>Erie</strong> <strong>Creeks</strong> <strong>Watershed</strong> <strong>Plan</strong><br />
General Report (105116)
Off-line<br />
Stormwater infrastructure that is located ‘off-line’ from a waterbody such as a creek..<br />
Oil and Grease Traps<br />
Devices used to collect oil and grease from water.<br />
On-line<br />
Stormwater infrastructure that is located ‘on-line’ within a waterbody such as a creek.<br />
Organic Soil<br />
Soil made up of the remains of dead plant material, in accumulations over 40 cm deep.<br />
Outlet<br />
Outlet is a point at which water is discharged from a drainage basin to a stream, river, or channel.<br />
Outfall<br />
Outfall is a point or structure where stream, river, conduit etc discharges to a receiving<br />
waterbody.<br />
Particles<br />
Term generally used for solids (colloids) suspended in water or wastewater, these vary widely in<br />
size, shape, and density.<br />
Peak Oil<br />
Point, some experts predict as soon, when oil production will start to decline rapidly and prices<br />
start to soar, once easily accessible fields are depleted.<br />
Pesticide<br />
Chemical used in agriculture and residential lawn care to kill organisms that are harmful to<br />
cultivated plants and animals.<br />
Point source<br />
Any discernible confined and discrete conveyance, including, but not limited to, any pipe, ditch,<br />
channel, tunnel, conduit, well, container, landfill, vessel or other floating craft, or industry from<br />
which pollutants are or may be discharged from. Contrast to “Non-point source”.<br />
Poorly Drained Soil<br />
Soil that is saturated most or all of the year.<br />
ppm<br />
Parts per million, a unit of concentration. Also replaceable with mg/l.<br />
Precipitation<br />
Precipitation includes any form of rain or snow.<br />
Preservation<br />
Strategies and actions to ensure healthy well-protected natural areas continue that status.<br />
March 2008 212 <strong>Fort</strong> <strong>Erie</strong> <strong>Creeks</strong> <strong>Watershed</strong> <strong>Plan</strong><br />
General Report (105116)
Protection<br />
Where there are some threats, strategies and actions to ensure continued healthy functioning of<br />
natural areas by lowering the risk of those threats to the natural areas.<br />
Quality Control Facility<br />
A depression into which stormwater is temporarily detained during a storm. This facility is<br />
typically permanently wet (e.g. wet pond, wetland etc.) with water tolerant vegetation such as<br />
bulrushes. The treatment process involves filtration through vegetation, sedimentation through<br />
detention and displacement.<br />
Raw Water<br />
Surface or ground water not receiving any kind of treatment.<br />
Reach<br />
Reach is a comparatively short length of a stream or channel with similar characteristics.<br />
Recharge Zones<br />
Areas where water moves downward from the surface and infiltrates into the water table.<br />
Regeneration<br />
The growth of forest on abandoned farmland.<br />
Relative humidity<br />
Relative humidity is an amount of water vapor in the air and is expressed as a percentage of the<br />
maximum amount that the air could hold at the given temperature.<br />
Restoration<br />
Strategies and actions to replace a natural area that has been removed.<br />
Retrofit<br />
A retrofit can be a Best Management Practice (BMP) to address impacts from existing<br />
development either through a modification of existing stormwater management system or new<br />
facility, typically to treat existing stormwater for quality or quantity impacts.<br />
Riparian<br />
Anything connected with or immediately adjacent to the banks of a stream or other body of<br />
water.<br />
Runoff<br />
Water that flows over the land surface into a waterbody.<br />
Saturated Soil<br />
Soil with all its interstices filled with water.<br />
Sediments<br />
Soil, sand, silt, clay or minerals washed off during rain from land to waterbodies. Sediments<br />
accumulate in rivers, reservoirs or other waterbodies.<br />
March 2008 213 <strong>Fort</strong> <strong>Erie</strong> <strong>Creeks</strong> <strong>Watershed</strong> <strong>Plan</strong><br />
General Report (105116)
Settlement Area<br />
In the <strong>Fort</strong> <strong>Erie</strong> Creek watersheds, the area of the Town of <strong>Fort</strong> <strong>Erie</strong> including and surrounding<br />
the built-up portions. It extends several kilometers inland from Lake <strong>Erie</strong> and the <strong>Niagara</strong> River<br />
and also includes Stevensville.<br />
Slough<br />
A small shallow depression characteristic of the unaltered micro-topography of much of the <strong>Fort</strong><br />
<strong>Erie</strong> watersheds’ lacustrine clay plains. These sloughs are very numerous, collect water in the<br />
spring and after heavy storms and, with the network of slightly higher ground, provide a range of<br />
habitats.<br />
Slough Mosaic<br />
A complex pattern of very shallow ridges and closed depressions characteristic of the natural<br />
form of the poorly drained lacustrine clay plains of <strong>Niagara</strong> Region.<br />
Stormwater<br />
Drainage from storm events whether it is overland or within a storm sewer system.<br />
Stormwater Wetland<br />
A constructed facility with shallow water depth and marsh plants. Wetlands provide maximum<br />
pollutant removal through plant uptake, retention, settling, and microbial activity. The design<br />
includes microtopography, pondscaping, and multiple species of wetland trees, shrubs, and<br />
plants, though it will not contain all the ecological functions of a natural wetland.<br />
Surface Water<br />
All water open to the atmosphere (e.g., rivers, streams, creeks, lakes, reservoirs, seas, etc.).<br />
Contrast to “Groundwater”.<br />
Swamp<br />
A treed wetland.<br />
Tile Drain<br />
Subsurface slotted pipe system laid to drain excess water from the soil and transport to nearby<br />
drainage system. Commonly used in agricultural lands where soils are poor in natural drainage to<br />
dry the soil to assist in planting and growth.<br />
Topography<br />
Topography shows relative elevation and physical features of surface areas including natural and<br />
manmade features.<br />
Total Suspended Solids (TSS)<br />
Total amount of particulates in a water sample. TSS is used to determine the quality of water.<br />
Turbidity<br />
Turbidity in water or wastewater is caused by the presence of suspended matter, resulting in the<br />
cloudiness of water. Turbidity can be removed through filtration.<br />
March 2008 214 <strong>Fort</strong> <strong>Erie</strong> <strong>Creeks</strong> <strong>Watershed</strong> <strong>Plan</strong><br />
General Report (105116)
Upland<br />
An area where well or rapidly drained soils dominate.<br />
Virus<br />
Virus is the smallest life form and capable of producing infectious diseases in humans or other<br />
large animals.<br />
Waterbodies<br />
Refers to all forms of surface water from creeks and streams to lakes and reservoirs.<br />
Watercourses<br />
Refers to moving surface water in natural or man-made channels (e.g. creeks, streams, rivers,<br />
canals, etc.)<br />
<strong>Watershed</strong><br />
A region draining to a waterbody such as river, creeks or lakes through a single outlet (ref.<br />
“Drainage Basin”).<br />
Water Table<br />
Subsurface layer below which the ground is completely saturated with water.<br />
Wetland<br />
An area that is saturated with water or has a water table at or near the surface. A wetland has<br />
plant and animal species that are adapted to a wet environment.<br />
Wet Pond<br />
A stormwater best management practice (BMP) employed for treatment of water quantity and<br />
quality. It has a deeper permanent pool of water than a wetland, generally greater than 1.0 m and<br />
less than 3.0 m.<br />
Winter De-icing<br />
The application of various materials (e.g. salts, sand, etc) that reduce the risk of slipping on icy<br />
surfaces.<br />
Acronyms<br />
ADS<br />
ANSI<br />
BAK<br />
BER<br />
BEV<br />
BKC<br />
BLC<br />
BVC<br />
CN<br />
DEM<br />
DFO<br />
Alternative Development Standards<br />
Area of Natural and Scientific Interest<br />
Baker Creek<br />
Bertie Bay Drain<br />
Beaver Creek<br />
Baker Creek<br />
Black Creek<br />
Beaver Creek<br />
Curve Number<br />
Digital Elevation Model<br />
Department of Fisheries and Oceans<br />
March 2008 215 <strong>Fort</strong> <strong>Erie</strong> <strong>Creeks</strong> <strong>Watershed</strong> <strong>Plan</strong><br />
General Report (105116)
ECA<br />
EIS<br />
EMC<br />
END<br />
EPA<br />
FEC<br />
FRC<br />
HEC-RAS<br />
KRD<br />
LaMP<br />
LID<br />
LMA’S<br />
LSA<br />
LSA<br />
MAD<br />
MAN<br />
masl<br />
MIL<br />
MLC<br />
MNR<br />
MOE<br />
NAI<br />
NAI<br />
NGO<br />
NH<br />
NHIC<br />
NPCA<br />
NRVIS<br />
NWQPS<br />
OBBA<br />
OBM<br />
OMMAH<br />
OMNR<br />
OP<br />
OPG<br />
PPS<br />
PSW<br />
RAP<br />
RGA<br />
RSAT<br />
RTD<br />
SARA<br />
SC<br />
SCH<br />
SIX<br />
SMC<br />
SMP<br />
SOLRIS<br />
Environmental <strong>Conservation</strong> Area<br />
Environmental Impact Study<br />
Event Mean Concentration<br />
Endangered<br />
Environmental Protection Agency<br />
<strong>Fort</strong> <strong>Erie</strong> <strong>Creeks</strong><br />
Frenchman’s Creek<br />
Hydrologic Engineering Centre – River Analysis System<br />
Kraft Drain<br />
Lakewide Management <strong>Plan</strong><br />
Low Impact Development<br />
Local Management Areas<br />
Locally Significant Area<br />
Landscape Scale Analysis<br />
Mann Drain<br />
Mann Drain<br />
Metres above sea level<br />
Miller Creek<br />
Miller Creek<br />
Ministry of Natural Resources<br />
Ministry of the Environment<br />
Natural Area’s Inventory<br />
Natural Areas Inventory<br />
Non-Government Organization<br />
Natural Heritage<br />
Natural Heritage Information Centre<br />
<strong>Niagara</strong> <strong>Peninsula</strong> <strong>Conservation</strong> Authority<br />
Natural Resources Values Information System<br />
<strong>Niagara</strong> Water Quality Protection Strategy<br />
Ontario Breeding Bird Atlas<br />
Ontario Base Mapping<br />
Ontario Ministry of Municipal Affairs and Housing<br />
Ontario Ministry of Natural Resources<br />
Official <strong>Plan</strong><br />
Ontario Power Generation<br />
Provincial Policy Statement<br />
Provincially Significant Wetland<br />
Remedial Action <strong>Plan</strong><br />
Rapid Geomorphic Assessment<br />
Rapid Stream Assessment Technique<br />
Roth Drain<br />
Species at Risk Act<br />
Special Concern<br />
Schihl Drain<br />
Six Mile Creek<br />
Six Mile Creek<br />
Shoreline Management <strong>Plan</strong><br />
Southern Ontario Land Resource Information System<br />
March 2008 216 <strong>Fort</strong> <strong>Erie</strong> <strong>Creeks</strong> <strong>Watershed</strong> <strong>Plan</strong><br />
General Report (105116)
STJ<br />
SWH<br />
SWM<br />
SWMHYMO<br />
THR<br />
WSPA<br />
WSEL<br />
YOY<br />
St. John’s Drain<br />
Significant Wildlife Habitat<br />
Stormwater Management<br />
Hydrologic software – StormWater Management HYdrologic MOdel<br />
Threatened<br />
<strong>Watershed</strong> <strong>Plan</strong>ning Area<br />
Water Surface Elevation<br />
Young-of-the-year<br />
March 2008 217 <strong>Fort</strong> <strong>Erie</strong> <strong>Creeks</strong> <strong>Watershed</strong> <strong>Plan</strong><br />
General Report (105116)