Characterization of HgCdTe MWIR Back-Illuminated II-VI-07 ... - Voxtel
Characterization of HgCdTe MWIR Back-Illuminated II-VI-07 ... - Voxtel
Characterization of HgCdTe MWIR Back-Illuminated II-VI-07 ... - Voxtel
- No tags were found...

Create successful ePaper yourself
Turn your PDF publications into a flip-book with our unique Google optimized e-Paper software.
1E-7<br />
10000<br />
Relative Response<br />
1E-8<br />
1E-9<br />
1E-10<br />
V = -5 V<br />
V = 0<br />
Gain, avg = 10.8<br />
163-A1, El 56<br />
λ CO =4.24 µm at 80 K<br />
T=79 K<br />
With filter 1000<br />
FWHM:<br />
210.97 µm at 0 V<br />
214.73 µm at -5 V<br />
∆=3.76 µm<br />
100<br />
10<br />
Ratio<br />
1E-11<br />
1<br />
-250 -200 -150 -100 -50 0 50 100 150 200 250<br />
Distance (µm)<br />
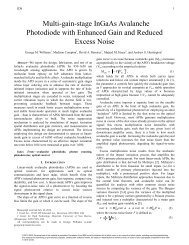
Fig. 9. Spot scan pr<strong>of</strong>iles for a 250×250 µm² unit cell in a 4×4 e-APD array at 79 K, for V=0 and V=-5.0 V.<br />
The ratio <strong>of</strong> the -5.0 V data to the V=0 data is defined as the gain, and is plotted on the right-hand axis. The<br />
gain is spatially uniform in the interior <strong>of</strong> the diode, with an average value <strong>of</strong> 10.8 at -5.0 V. There is<br />
evidence <strong>of</strong> gain enhancement seen at the edges <strong>of</strong> the junction.<br />
5<br />
4<br />
3<br />
163A1, El 80<br />
λ CO =4.06 µm at 160 K<br />
250x250 µm²<br />
T = 196 K<br />
V = -0.1 V to -9.0 V<br />
<strong>Voxtel</strong> data<br />
k=0<br />
k=0.025<br />
El 80<br />
F(M)<br />
2<br />
1<br />
F(M) normailzed to 1 at V=-0.1 V<br />
0<br />
0 20 40 60 80 100 120 140 160<br />
Gain<br />
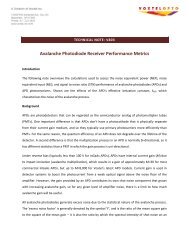
Fig. 10. Data for the excess noise multiplication factor F(M) plotted versus gain, at T=196 K, taken at <strong>Voxtel</strong><br />
Inc. The two solid curves are plots <strong>of</strong> the standard McIntyre equation for F(M).<br />
-27-