- Page 2 and 3: Project 2015 State Agencies Prepare
- Page 4: October 2002 Dear Governor Pataki:
- Page 7 and 8: Office of General Services ........
- Page 9 and 10: INTRODUCTION Following publication
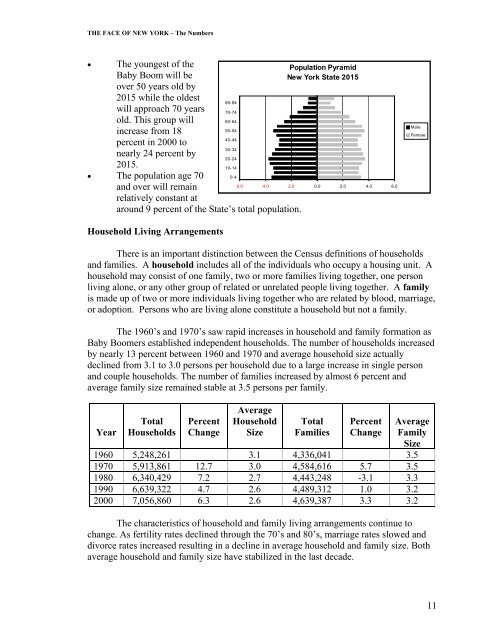
- Page 12 and 13: THE FACE OF NEW YORK - The Numbers
- Page 14 and 15: THE FACE OF NEW YORK - The Numbers
- Page 16 and 17: THE FACE OF NEW YORK - The Numbers
- Page 20: THE FACE OF NEW YORK - The Numbers
- Page 23 and 24: THE FACE OF NEW YORK - The People t
- Page 25 and 26: THE FACE OF NEW YORK - The People g
- Page 28 and 29: ANALYSIS AND SUMMARY OF 36 STATE AG
- Page 30 and 31: ANALYSIS AND SUMMARY OF 36 STATE AG
- Page 32 and 33: ANALYSIS AND SUMMARY OF 36 STATE AG
- Page 34 and 35: ANALYSIS AND SUMMARY OF 36 STATE AG
- Page 36 and 37: ANALYSIS AND SUMMARY OF 36 STATE AG
- Page 38 and 39: ANALYSIS AND SUMMARY OF 36 STATE AG
- Page 40 and 41: ANALYSIS AND SUMMARY OF 36 STATE AG
- Page 42 and 43: ANALYSIS AND SUMMARY OF 36 STATE AG
- Page 44 and 45: ANALYSIS AND SUMMARY OF 36 STATE AG
- Page 46 and 47: ANALYSIS AND SUMMARY OF 36 STATE AG
- Page 48 and 49: ANALYSIS AND SUMMARY OF 36 STATE AG
- Page 50: ANALYSIS AND SUMMARY OF 36 STATE AG
- Page 54 and 55: OFFICE OF ADVOCATE FOR PERSONS WITH
- Page 56 and 57: OFFICE OF ADVOCATE FOR PERSONS WITH
- Page 58 and 59: OFFICE FOR THE AGING I. INTRODUCTIO
- Page 60 and 61: OFFICE FOR THE AGING Current NYSOFA
- Page 62: OFFICE FOR THE AGING on help-line c
- Page 65 and 66: DEPARTMENT OF AGRICULTURE AND MARKE
- Page 67 and 68: DEPARTMENT OF AGRICULTURE AND MARKE
- Page 70 and 71:
OFFICE OF ALCOHOLISM AND SUBSTANCE
- Page 72 and 73:
OFFICE OF ALCOHOLISM AND SUBSTANCE
- Page 74 and 75:
OFFICE OF ALCOHOLISM AND SUBSTANCE
- Page 76 and 77:
BANKING DEPARTMENT I. INTRODUCTION:
- Page 78 and 79:
BANKING DEPARTMENT • Ensuring tha
- Page 80 and 81:
BANKING DEPARTMENT III. ACTIONS AND
- Page 82 and 83:
DIVISION OF THE BUDGET I. INTRODUCT
- Page 84 and 85:
DIVISION OF THE BUDGET impacts of t
- Page 86:
DIVISION OF THE BUDGET Priority Iss
- Page 89 and 90:
COUNCIL ON CHILDREN AND FAMILIES an
- Page 91 and 92:
COUNCIL ON CHILDREN AND FAMILIES to
- Page 93 and 94:
COUNCIL ON CHILDREN AND FAMILIES Id
- Page 96 and 97:
OFFICE OF CHILDREN AND FAMILY SERVI
- Page 98 and 99:
OFFICE OF CHILDREN AND FAMILY SERVI
- Page 100 and 101:
OFFICE OF CHILDREN AND FAMILY SERVI
- Page 102 and 103:
OFFICE OF CHILDREN AND FAMILY SERVI
- Page 104 and 105:
DEPARTMENT OF CIVIL SERVICE I. INTR
- Page 106 and 107:
DEPARTMENT OF CIVIL SERVICE The Dep
- Page 108 and 109:
DEPARTMENT OF CIVIL SERVICE have a
- Page 110 and 111:
CONSUMER PROTECTION BOARD I. INTROD
- Page 112 and 113:
CONSUMER PROTECTION BOARD Increases
- Page 114 and 115:
CONSUMER PROTECTION BOARD Actions:
- Page 116 and 117:
DEPARTMENT OF CORRECTIONAL SERVICES
- Page 118 and 119:
DEPARTMENT OF CORRECTIONAL SERVICES
- Page 120 and 121:
DEPARTMENT OF CORRECTIONAL SERVICES
- Page 122 and 123:
EDUCATION DEPARTMENT I. INTRODUCTIO
- Page 124 and 125:
EDUCATION DEPARTMENT Issue 1: Devel
- Page 126 and 127:
EDUCATION DEPARTMENT Action recomme
- Page 128 and 129:
EMPIRE STATE DEVELOPMENT I. INTRODU
- Page 130 and 131:
EMPIRE STATE DEVELOPMENT Worker ret
- Page 132 and 133:
EMPIRE STATE DEVELOPMENT Priority I
- Page 134 and 135:
GOVERNOR’S OFFICE OF EMPLOYEE REL
- Page 136 and 137:
GOVERNOR’S OFFICE OF EMPLOYEE REL
- Page 138 and 139:
GOVERNOR’S OFFICE OF EMPLOYEE REL
- Page 140 and 141:
DEPARTMENT OF ENVIRONMENTAL CONSERV
- Page 142 and 143:
DEPARTMENT OF ENVIRONMENTAL CONSERV
- Page 144 and 145:
DEPARTMENT OF ENVIRONMENTAL CONSERV
- Page 146 and 147:
OFFICE OF GENERAL SERVICES I. INTRO
- Page 148 and 149:
OFFICE OF GENERAL SERVICES Real Pro
- Page 150 and 151:
OFFICE OF GENERAL SERVICES ‣ Impl
- Page 152 and 153:
DEPARTMENT OF HEALTH I. INTRODUCTIO
- Page 154 and 155:
DEPARTMENT OF HEALTH of surgical sp
- Page 156 and 157:
DEPARTMENT OF HEALTH • DOH has is
- Page 158 and 159:
DEPARTMENT OF HEALTH periodic updat
- Page 160 and 161:
DIVISION OF HOUSING AND COMMUNITY R
- Page 162 and 163:
DIVISION OF HOUSING AND COMMUNITY R
- Page 164 and 165:
DIVISION OF HOUSING AND COMMUNITY R
- Page 166 and 167:
INSURANCE DEPARTMENT I. INTRODUCTIO
- Page 168 and 169:
INSURANCE DEPARTMENT Continuing Car
- Page 170 and 171:
INSURANCE DEPARTMENT Priority Issue
- Page 172 and 173:
INSURANCE DEPARTMENT Action: Instal
- Page 174 and 175:
DEPARTMENT OF LABOR I. INTRODUCTION
- Page 176 and 177:
DEPARTMENT OF LABOR DOES partners w
- Page 178 and 179:
DEPARTMENT OF LABOR Result: • To
- Page 180 and 181:
OFFICE OF MENTAL HEALTH I. INTRODUC
- Page 182 and 183:
OFFICE OF MENTAL HEALTH To summariz
- Page 184 and 185:
OFFICE OF MENTAL HEALTH • Coordin
- Page 186 and 187:
OFFICE OF MENTAL RETARDATION AND DE
- Page 188 and 189:
OFFICE OF MENTAL RETARDATION AND DE
- Page 190 and 191:
OFFICE OF MENTAL RETARDATION AND DE
- Page 192 and 193:
DEPARTMENT OF MOTOR VEHICLES The Ne
- Page 194 and 195:
DEPARTMENT OF MOTOR VEHICLES vice v
- Page 196 and 197:
DEPARTMENT OF MOTOR VEHICLES Action
- Page 198 and 199:
OFFICE OF PARKS, RECREATION AND HIS
- Page 200 and 201:
OFFICE OF PARKS, RECREATION AND HIS
- Page 202 and 203:
PUBLIC SERVICE COMMISSION I. INTROD
- Page 204 and 205:
PUBLIC SERVICE COMMISSION II. PRIOR
- Page 206 and 207:
PUBLIC SERVICE COMMISSION • This
- Page 208 and 209:
COMMISSION ON QUALITY OF CARE FOR T
- Page 210 and 211:
COMMISSION ON QUALITY OF CARE FOR T
- Page 212 and 213:
OFFICE OF REAL PROPERTY SERVICES I.
- Page 214 and 215:
OFFICE OF REAL PROPERTY SERVICES II
- Page 216 and 217:
STATE EMERGENCY MANAGEMENT OFFICE I
- Page 218 and 219:
STATE EMERGENCY MANAGEMENT OFFICE I
- Page 220 and 221:
STATE EMERGENCY MANAGEMENT OFFICE
- Page 222 and 223:
DIVISION OF STATE POLICE I. INTRODU
- Page 224 and 225:
DIVISION OF STATE POLICE An increas
- Page 226 and 227:
DIVISION OF STATE POLICE and review
- Page 228 and 229:
DIVISION OF STATE POLICE Actions: 1
- Page 230 and 231:
STATE UNIVERSITY OF NEW YORK I. INT
- Page 232 and 233:
STATE UNIVERSITY OF NEW YORK Progra
- Page 234 and 235:
STATE UNIVERSITY OF NEW YORK During
- Page 236 and 237:
DEPARTMENT OF STATE I. INTRODUCTION
- Page 238 and 239:
DEPARTMENT OF STATE means there wil
- Page 240 and 241:
DEPARTMENT OF STATE communities ass
- Page 242 and 243:
DEPARTMENT OF TAXATION AND FINANCE
- Page 244 and 245:
DEPARTMENT OF TAXATION AND FINANCE
- Page 246 and 247:
DEPARTMENT OF TAXATION AND FINANCE
- Page 248 and 249:
OFFICE FOR TECHNOLOGY I. INTRODUCTI
- Page 250 and 251:
OFFICE FOR TECHNOLOGY of private in
- Page 252 and 253:
OFFICE FOR TECHNOLOGY Actions • O
- Page 254 and 255:
OFFICE OF TEMPORARY AND DISABILITY
- Page 256 and 257:
OFFICE OF TEMPORARY AND DISABILITY
- Page 258 and 259:
OFFICE OF TEMPORARY AND DISABILITY
- Page 260 and 261:
DEPARTMENT OF TRANSPORTATION I. INT
- Page 262 and 263:
DEPARTMENT OF TRANSPORTATION Highwa
- Page 264 and 265:
DEPARTMENT OF TRANSPORTATION Result
- Page 266 and 267:
DIVISION OF VETERANS’ AFFAIRS I.
- Page 268 and 269:
DIVISION OF VETERANS’ AFFAIRS II.
- Page 270 and 271:
APPENDIX A Project 2015: Lead Conve
- Page 272 and 273:
APPENDIX A Insurance Department Gre
- Page 274 and 275:
Project 2015: Coordinating Team Off
- Page 276 and 277:
APPENDIX C LIST OF RESOURCES FOR AD
- Page 278 and 279:
APPENDIX C Judy, R. and D’Amico,
- Page 280 and 281:
APPENDIX C RAND: Population Matters