CLIMATE ACTION PLAN - City of Urbana
CLIMATE ACTION PLAN - City of Urbana
CLIMATE ACTION PLAN - City of Urbana
- No tags were found...

Create successful ePaper yourself
Turn your PDF publications into a flip-book with our unique Google optimized e-Paper software.
<strong>CLIMATE</strong> <strong>ACTION</strong> <strong>PLAN</strong><br />
PHASE 1: INITIAL STRATEGIES 2013-2015<br />
<strong>City</strong> <strong>of</strong> <strong>Urbana</strong>, Illinois
ACKNOWLEDGEMENTS<br />
<strong>Urbana</strong> Sustainability Advisory Commission<br />
Marya Ryan, Chair<br />
Stephen Wald, Vice-Chair<br />
Gary Cziko<br />
John Marlin<br />
Aaron Petri<br />
Todd Rusk<br />
Rachel Vellenga<br />
Jean Ascoli (former member)<br />
Kirstin Dohrer (former member)<br />
Jennifer Monson (former member)<br />
Amy Ando (former member)<br />
<strong>Urbana</strong> Mayor & <strong>City</strong> Council<br />
Laurel Lunt Prussing, Mayor<br />
Charlie Smyth, Ward 1<br />
Eric Jakobsson, Ward 2<br />
Robert E. Lewis, Ward 3<br />
Brandon Bowersox, Ward 4<br />
Dennis P. Roberts, Ward 5<br />
Heather D. Stevenson, Ward 6<br />
Diane W. Marlin, Ward 7<br />
<strong>City</strong> <strong>of</strong> <strong>Urbana</strong> Staff<br />
Elizabeth H. Tyler, FAICP,<br />
Director <strong>of</strong> Community Development Services<br />
Bill Gray, Director <strong>of</strong> Public Works<br />
Robert Myers, AICP, Planning Manager<br />
Jeff Engstrom, AICP, Planner II<br />
Rebecca Bird, AICP, Planner II<br />
Courtney Rushforth, Recycling Coordinator<br />
Kate L. Brickman, Administrative Assistant<br />
Jason Arrasmith, Environmental Compliance Officer<br />
Anna Hochhalter, Economic Development Intern<br />
Aditi Kambuj, Community Development Intern<br />
Bart Hagston,<br />
Former Environmental Sustainability Manager<br />
Rod Fletcher, Former Environmental Manager<br />
Comments on the <strong>Urbana</strong> Climate Action Plan Phase 1 can be made via:<br />
Mail:<br />
Website:<br />
A completed Public Input Form (Appendix D) can be mailed to<br />
<strong>City</strong> <strong>of</strong> <strong>Urbana</strong>, 400 S Vine Street, <strong>Urbana</strong>, Illinois 61801.<br />
Comments on the Climate Action Plan Phase I can be made at<br />
www.urbanaillinois.us/climateactionplan .<br />
Discuss Climate Action in <strong>Urbana</strong> at:<br />
Facebook:<br />
www.facebook.com/sustainableurbana<br />
<strong>City</strong> <strong>of</strong> <strong>Urbana</strong><br />
2
A MESSAGE FROM THE MAYOR<br />
August 31, 2012<br />
Dear Citizens <strong>of</strong> <strong>Urbana</strong>,<br />
As climate change emerged as an international problem, cities around the world have taken the<br />
lead in finding solutions. Cities act because they recognize that they will deal with the human costs<br />
<strong>of</strong> climate change. National governments still struggle to come to agreement on this issue. Cities<br />
are able to move more quickly. Many cities are reducing greenhouse gases not only in their own<br />
operations but by educating the public about practical action we all can take.<br />
<strong>Urbana</strong> is a small city, so what difference can we make In fact, a few <strong>Urbana</strong> residents have<br />
made a big difference already. The University <strong>of</strong> Illinois, a top research university, brings bright minds<br />
together .<br />
Don Wuebbles, University <strong>of</strong> Illinois climate scientist, and one <strong>of</strong> the recipients <strong>of</strong> the 2007 Nobel Prize<br />
for the international Intergovernmental Panel on Climate Change, helped document the reality <strong>of</strong><br />
climate change and the need to reduce greenhouse gases.<br />
Nick Holonyak, Jr., University <strong>of</strong> Illinois Bardeen pr<strong>of</strong>essor <strong>of</strong> Electrical and Computer Engineering,<br />
invented the LED. Pr<strong>of</strong>essor Holonyak, who lives in <strong>Urbana</strong>, has transformed lighting systems<br />
worldwide. At the C40 Large Cities Climate Summit in Seoul, Korea in 2009 the largest cities on earth<br />
were talking about installing LED lighting and the energy savings they achieved.<br />
At the kind invitation <strong>of</strong> Pr<strong>of</strong>essor Wuebbles and the <strong>City</strong> <strong>of</strong> Seoul, Marya Ryan, Chair <strong>of</strong> <strong>Urbana</strong>’s<br />
Sustainability Advisory Commission, and I attended the 2009 meeting in Seoul (oddly enough, I was<br />
the only American mayor present, although other U.S. cities sent staff). Mayors and <strong>of</strong>ficials from all<br />
over the world-- Beijing, Sydney, Copenhagen, London and many others-- shared ideas. All realize<br />
we face the same challenges and can learn from one another.<br />
The <strong>City</strong> <strong>of</strong> <strong>Urbana</strong> Climate Action Plan is our commitment to streamline municipal operations and to<br />
educate our citizens and others about how we can reduce the threat <strong>of</strong> climate change. Students<br />
come to the University <strong>of</strong> Illinois from around the world. They are the future leaders in their countries.<br />
<strong>Urbana</strong>’s implementation <strong>of</strong> the ideas in this plan can be part <strong>of</strong> their education outside the<br />
classroom. And we can learn from them. So a small city like <strong>Urbana</strong> can have a big impact.<br />
My initial charge to the Sustainability Advisory Commission was to consider conservation <strong>of</strong> both<br />
energy and water. This first report deals only with energy. They plan to deal with water issues next.<br />
All these plans are works in progress that will be modified as we move forward.<br />
Marya Ryan has ably chaired the Sustainability Advisory Commission and wrote an initial draft <strong>of</strong> this<br />
report. We thank her and all who have served on the Commission as well as the staff <strong>of</strong> the city’s<br />
Community Development and Public Works departments for the many months they have spent on<br />
developing this plan.<br />
Laurel Lunt Prussing<br />
<strong>City</strong> <strong>of</strong> <strong>Urbana</strong><br />
3
CONTENTS<br />
Executive Summary .............................................................................................................................. 6<br />
1. BACKGROUND ......................................................................................................................................................................................... 9<br />
1.1 Introduction ................................................................................................................................................................... 10<br />
1.2 Climate Change Concepts .............................................................................................................................................. 12<br />
1.3 Benefits <strong>of</strong> Local Action ................................................................................................................................................. 14<br />
1.4 Development and Emissions .......................................................................................................................................... 15<br />
1.5 A Phased Approach ........................................................................................................................................................ 16<br />
1.6 <strong>City</strong> <strong>of</strong> <strong>Urbana</strong> Sustainability Vision Statement.............................................................................................................. 17<br />
1.7 <strong>City</strong> <strong>of</strong> <strong>Urbana</strong> Climate Action Principles ....................................................................................................................... 18<br />
1.8 Public Engagement ........................................................................................................................................................ 19<br />
1.9 Current Plans ................................................................................................................................................................. 21<br />
1.10 Current Actions .............................................................................................................................................................. 24<br />
A. Community Actions ................................................................................................................................................... 24<br />
B. Recycling in <strong>Urbana</strong> ................................................................................................................................................... 29<br />
C. University <strong>of</strong> Illinois Actions ....................................................................................................................................... 31<br />
D. <strong>City</strong> <strong>of</strong> <strong>Urbana</strong> Actions ............................................................................................................................................... 32<br />
2. METHODOLOGY, INVENTORY & PROJECTIONS .................................................................................................................................. 35<br />
2.1 Overview ........................................................................................................................................................................ 36<br />
A. Calculation Models .................................................................................................................................................... 36<br />
B. University <strong>of</strong> Illinois Emissions ................................................................................................................................... 37<br />
C. Sources <strong>of</strong> Data .......................................................................................................................................................... 37<br />
D. Growth Forecasts ....................................................................................................................................................... 38<br />
2.2 Baseline Inventory ......................................................................................................................................................... 39<br />
A. 2007 Emissions by Sector .......................................................................................................................................... 39<br />
B. 2007 Emissions by Source .......................................................................................................................................... 39<br />
C. Greenhouse Gas Emissions Related to Paper Products, Food Waste, Wood, Textiles and Plant Debris .................... 40<br />
D. Comparing <strong>Urbana</strong>’s Per Capita Emissions with Cities Nation-Wide ......................................................................... 41<br />
2.3 Emissions Forecast ......................................................................................................................................................... 42<br />
2.4 Emissions Reduction Goals ............................................................................................................................................ 43<br />
2.5 <strong>Urbana</strong>’s Energy Use ...................................................................................................................................................... 44<br />
A. Monitoring Energy Efficiency ..................................................................................................................................... 44<br />
B. Weatherization .......................................................................................................................................................... 44<br />
C. Traditional Sources <strong>of</strong> Energy and Related Emissions and Nuclear Waste ................................................................. 45<br />
D. Municipal Electric Aggregation .................................................................................................................................. 46<br />
E. Renewable Energy Certificates (RECs) ........................................................................................................................ 46<br />
3. GOALS, <strong>ACTION</strong>S & IMPLEMENTATION STRATEGIES ................................................................................................................ 49<br />
3.1 Priority Actions ............................................................................................................................................................... 51<br />
3.2 Goal 1 Reduce Emissions from Building Energy Consumption ................................................................................ 54<br />
Goal 2 Reduce Emissions from Gasoline Consumption ........................................................................................... 58<br />
Goal 3 Formulate Strategies to Reduce Emissions from Rental and Industrial Sectors ........................................... 60<br />
Goal 4 Prepare for Climate Change Impacts ........................................................................................................... 61<br />
Goal 5 Pursue Coordination and Outreach ............................................................................................................. 62<br />
3.3 Consolidated Implementation Table ............................................................................................................................. 64<br />
3.4 Future Steps and Challenges to Climate Action .......................................................................................................... 67<br />
4. APPENDICES ........................................................................................................................................................................................................... 69<br />
Table <strong>of</strong> Figures ................................................................................................................................................................................ 70<br />
Table <strong>of</strong> Tables ................................................................................................................................................................................. 71<br />
Acronyms and Abbreviations ........................................................................................................................................................... 72<br />
Appendix A: U.S. Mayors Climate Protection Agreement ................................................................................................................ 73<br />
Appendix B: Sources and Warming Potentials <strong>of</strong> Greenhouse Gases ............................................................................................. 74<br />
Appendix C: Public Input Survey Results ......................................................................................................................................... 75<br />
Appendix D: Public Input Forms ...................................................................................................................................................... 82<br />
Appendix E: CACP Greenhouse Gas Emissions Factors..................................................................................................................... 86<br />
Appendix F: Population, Employment and Transportation Growth Projections for 2020 ............................................................... 89<br />
Appendix G: State <strong>of</strong> Illinois Electric Vehicle Advisory Council Report Recommendations ............................................................. 93<br />
Appendix H: $ 1,000 Energy Challenge: Low or No Cost Actions You Can Take ............................................................................... 96<br />
Appendix J: Energy and Emissions Flow Diagrams ........................................................................................................................... 97<br />
Appendix K: <strong>Urbana</strong> <strong>City</strong> Council Resolution Adopting the Phase I Climate Action Plan ................................................................. 101<br />
<strong>City</strong> <strong>of</strong> <strong>Urbana</strong><br />
4
5 GOALS : 15 <strong>ACTION</strong>S<br />
THE URBANA <strong>CLIMATE</strong> <strong>ACTION</strong> <strong>PLAN</strong> PHASE I RECOMMENDS FIFTEEN COMMUNITY-WIDE <strong>ACTION</strong>S<br />
TO ACHIEVE FIVE GREENHOUSE GAS EMISSIONS REDUCTION GOALS:<br />
1<br />
REDUCE EMISSIONS FROM BUILDING ENERGY CONSUMPTION.<br />
Action 1 Reduce emissions from commercial sector building electricity consumption.<br />
Action 2 Reduce emissions from residential sector building electricity consumption.<br />
Action 3 Reduce emissions from residential sector building natural gas consumption.<br />
2<br />
REDUCE EMISSIONS FROM GASOLINE CONSUMPTION.<br />
Action 1 Support sustainable transportation through infrastructure improvements.<br />
Action 2 Promote a culture <strong>of</strong> sustainable transportation.<br />
Action 3 Encourage participation in sustainable transportation programs.<br />
Action 4 Consider transportation sector emissions projections in land-use planning decisions.<br />
3<br />
FORMULATE STRATEGIES TO REDUCE EMISSIONS FROM RENTAL AND INDUSTRIAL SECTORS.<br />
Action 1 Form a task force to study special considerations for rental properties.<br />
Action 2 Form a task force to study special considerations for the industrial sector.<br />
4<br />
5<br />
PREPARE FOR <strong>CLIMATE</strong> CHANGE IMPACTS.<br />
Action 1 Form a task force to study special considerations for adapting to local climate change impacts.<br />
PURSUE COORDINATION AND OUTREACH.<br />
Action 1 Coordinate city plans and policies with climate action goals.<br />
Action 2 Encourage energy efficient behavior and individual actions.<br />
Action 3 Encourage energy efficiency in new developments.<br />
Action 4 Encourage participation in existing sustainability programs.<br />
Action 5 Monitor progress towards climate action goals.<br />
<strong>City</strong> <strong>of</strong> <strong>Urbana</strong><br />
5
EXECUTIVE SUMMARY<br />
A vast body <strong>of</strong> climate science research and an overwhelming scientific consensus establishes that climate change is a<br />
real and significant threat driven by human activity, primarily the burning <strong>of</strong> fossil fuels. Local response to this threat, as<br />
individuals and as a city, presents opportunities to create a more livable, equitable and resilient community.<br />
Anticipated climate change impacts have pr<strong>of</strong>ound implications on the availability <strong>of</strong> water and other natural resources,<br />
biodiversity, human health and economic systems in the Midwest. Potential climate change impacts in the region include<br />
an increase in the frequency, length and severity <strong>of</strong> heat waves; a significant reduction in the Great Lakes water levels;<br />
an increase in winter and spring precipitation; and an increase in floods, droughts, insects, weeds, and threats to native<br />
species. Our community must prepare to adapt to these potential impacts <strong>of</strong> climate change. 1<br />
By using energy more efficiently, harnessing renewable sources <strong>of</strong> energy and improving access to a less polluting<br />
transportation system, a city can reduce greenhouse gas emissions, improve air quality and save dollars. By building a<br />
local food system, implementing a weatherization program, and improving bicycle and pedestrian infrastructure, a city<br />
can create jobs, invest in the community and improve its residents’ health and quality <strong>of</strong> life.<br />
Taking a leadership role in the response to climate change concerns, <strong>Urbana</strong> Mayor Laurel Prussing signed the U.S.<br />
Mayors Climate Protection Agreement in 2007. Since then, the <strong>City</strong> has joined the International Council for Local<br />
Environmental Initiatives’ (ICLEI) Cities for Climate Protection® (CCP) campaign. <strong>Urbana</strong> has pledged to take action<br />
against the negative impacts <strong>of</strong> greenhouse gas emissions by optimizing <strong>City</strong> operations and implementing climate<br />
change protection programs for the wider community.<br />
In 2008, the Mayor and the <strong>Urbana</strong> <strong>City</strong> Council created a Sustainability Advisory Commission (SAC), composed <strong>of</strong> seven<br />
appointed community members, to identify and recommend goals for the sustainable management <strong>of</strong> energy, natural<br />
resources and water to the Mayor and <strong>City</strong> Council. The Commission’s initial objective to meet this mandate has been<br />
the development <strong>of</strong> a Climate Action Plan to guide the community’s efforts to reduce its emissions footprint. The Climate<br />
Action Plan includes an inventory <strong>of</strong> the sources <strong>of</strong> emissions, sets emissions reduction targets, and proposes actions to<br />
meet these emissions reduction targets.<br />
Research by the Intergovernmental Panel on Climate Change (IPCC) suggests that emissions must be stabilized at a<br />
rate <strong>of</strong> 60 percent below 1990 levels in order to minimize global warming, and avoid the worst risks <strong>of</strong> uncontrolled<br />
climate change. <strong>Urbana</strong> lacks access to its energy consumption data from 1990; therefore the year 2007 is the ‘baseline<br />
inventory year’ against which future energy consumption is monitored and greenhouse gas emissions reduction<br />
strategies are formulated. In order to achieve the needed reductions indicated by the IPCC research, the SAC has adopted<br />
a long-term goal <strong>of</strong> reducing community-wide emissions by 80 percent below 2007 levels by the year 2050.<br />
The SAC recommends a 25 percent reduction by 2020 to put the <strong>City</strong> on track to reach an 80 percent reduction by 2050.<br />
The 25 percent emissions reduction target is both aggressive and achievable and is based on estimates <strong>of</strong> the impact <strong>of</strong><br />
current and planned programs. The 2020 and 2050 targets are in line with those set by the State <strong>of</strong> Illinois, other states,<br />
and in legislation introduced in the US Congress and other countries. 2<br />
Phased Implementation:<br />
Recognizing that community-wide reductions in greenhouse gas emissions require community-wide participation, the<br />
<strong>Urbana</strong> Climate Action Plan follows a phased implementation strategy. Phase I actions will be implemented in the short<br />
term, at little or no additional cost to the <strong>City</strong>. Over the next two years, as Phase I strategies are implemented, feedback<br />
will be gathered on community-wide participation through surveys, task forces, focus groups, an online forum, and<br />
targeted conversations with key stakeholders. The Climate Action Plan will be a living document which will undergo<br />
revisions as improvements in data availability and modeling analysis occur. The <strong>City</strong> will review the progress <strong>of</strong> Phase<br />
1 activities annually including an appendix containing public comment results. Based on data gathered during the<br />
implementation <strong>of</strong> Phase I, a Phase II Climate Action Plan will be prepared, which will recommend additional strategies<br />
1<br />
Global Climate Change Impacts in the United States, Thomas R.Karl, Jerry M.Melillo, and Thomas C.Peterson, (eds.). Cambridge University Press, 2009.<br />
2<br />
A LOOK AT EMISSIONS TARGETS. (n.d.). Retrieved July 07, 2012, from Center for Climate and Energy Solutions: http://www.c2es.org/what_s_bring_done/targets<br />
<strong>City</strong> <strong>of</strong> <strong>Urbana</strong><br />
6
to reach long-term emissions reduction targets.<br />
The following five goals have shaped the Climate Action Plan Phase I:<br />
1. Reduce emissions from building energy consumption.<br />
2. Reduce emissions from gasoline consumption.<br />
3. Formulate strategies to reduce emissions from rental and industrial sectors.<br />
4. Prepare for climate change impacts.<br />
5. Pursue coordination and outreach.<br />
By adopting the Climate Action Plan Phase I, the <strong>City</strong> <strong>of</strong> <strong>Urbana</strong>:<br />
• Establishes its vision for the sustainability <strong>of</strong> natural resources.<br />
• Commits to a set <strong>of</strong> underlying principles that will frame climate action planning for the years to come.<br />
• Prioritizes the desire to continually improve the quality <strong>of</strong> life for every <strong>Urbana</strong> resident. Recognizing<br />
that the forces driving emissions are linked to development, it is important to integrate economic development<br />
with sustainability goals.<br />
• Identifies a 2007 greenhouse gas emissions baseline for <strong>Urbana</strong> <strong>of</strong> approximately 548,700 metric tons<br />
<strong>of</strong> CO 2<br />
equivalent (MT CO 2<br />
e) and a projected 2020 inventory <strong>of</strong> about 638,800 MT CO 2<br />
e under a<br />
“business as usual” scenario. 3 Emissions from the University <strong>of</strong> Illinois buildings are not included in the<br />
inventories as these are accounted for in the University’s Climate Action Plan.<br />
• Commits to a goal to reduce <strong>Urbana</strong>’s greenhouse gas emissions by 25 percent below 2007 emissions levels<br />
by the year 2020 regardless <strong>of</strong> growth. Achieving this goal depends on the effectiveness <strong>of</strong> Phase I<br />
strategies and the pending identification <strong>of</strong> Phase II strategies.<br />
• Agrees to pursue a set <strong>of</strong> greenhouse gas reduction strategies that can be implemented on a short<br />
timeline at modest or no cost. Strategies are intended to be implemented by both the city government<br />
and by the public at large.<br />
• Establishes the Sustainability Advisory Commission’s role in review <strong>of</strong> matters related to greenhouse<br />
gas emissions reduction.<br />
• Seeks to make <strong>Urbana</strong> a climate action leader and a source <strong>of</strong> assistance for climate action in other<br />
communities in the region.<br />
3<br />
Business as Usual: The baseline scenario or the business-as-usual forecast is a depiction <strong>of</strong> the future consequences <strong>of</strong> continuing current trends in<br />
population, economy, urban development, technology and human behavior with respect to energy consumption.<br />
<strong>City</strong> <strong>of</strong> <strong>Urbana</strong><br />
7
1. BACKGROUND<br />
Red Oak Rain Garden near Allen Hall and the McKinley Center<br />
<strong>City</strong> <strong>of</strong> <strong>Urbana</strong><br />
9
1.1<br />
INTRODUCTION<br />
Never in the past 1,000 years has the planet warmed at a faster rate than in the past century, and the most recent<br />
decade has been the warmest on record.<br />
The overwhelming scientific consensus is that human activity is changing our climate, in large part due to the burning <strong>of</strong><br />
fossil fuels which create heat-trapping “greenhouse gases” (GHG) such as carbon dioxide (CO 2<br />
). Continued warming at<br />
this rate can result in decreased agricultural output, increased catastrophic weather events such as droughts and floods,<br />
and the displacement <strong>of</strong> entire populations due to rising sea levels.<br />
Although the United States accounts for only 4 percent <strong>of</strong> the world’s population, it is responsible for emitting 20 percent<br />
<strong>of</strong> the world’s greenhouse gases. As per <strong>Urbana</strong>’s baseline emissions inventory the community was responsible for<br />
548,700 metric tons <strong>of</strong> carbon dioxide equivalent units (MT CO 2<br />
e) in 2007. At current rates <strong>of</strong> increase, <strong>Urbana</strong>’s output<br />
can be expected to increase 16 percent by 2020. Reducing greenhouse gas emissions can potentially slow the rate <strong>of</strong><br />
climate change and decrease overall effects. A Climate Action Plan is a guide for reducing community-wide greenhouse<br />
gas emissions and planning community wide adaptation to potential climate change related phenomena.<br />
Responding to the local and global concerns, <strong>Urbana</strong> Mayor Laurel Prussing signed the U.S. Mayors Climate Protection<br />
Agreement in 2007, and since then the <strong>City</strong> has joined the International Council for Local Environmental Initiatives<br />
(ICLEI) Cities for Climate Protection® (CCP) campaign (See Appendix A). By doing so, the <strong>City</strong> <strong>of</strong> <strong>Urbana</strong> has pledged to<br />
reduce greenhouse gas emissions for <strong>City</strong> operations and the larger community. In 2008, the Mayor and the <strong>City</strong> Council<br />
created a Sustainability Advisory Commission (SAC), composed <strong>of</strong> seven appointed community members, to identify and<br />
recommend goals to achieve the sustainable management <strong>of</strong> natural resources, water and energy in particular, to the<br />
Mayor and <strong>City</strong> Council. The Commission’s initial objective to meet this mandate has been the development <strong>of</strong> a Climate<br />
Action Plan.<br />
The Climate Action Plan Phase I, developed by the <strong>City</strong> <strong>of</strong> <strong>Urbana</strong> Sustainability Advisory Commission, presents the first<br />
<strong>of</strong> two phases <strong>of</strong> a Climate Action Plan for the <strong>City</strong> <strong>of</strong> <strong>Urbana</strong>. Actions suggested for Phase I are designed for prompt<br />
implementation. A second phase with a more comprehensive set <strong>of</strong> strategies will follow after extended public and<br />
stakeholder input through the implementation <strong>of</strong> Phase I. Phase I goals and actions respond to residents’ comments<br />
and suggestions received through public input sessions and outreach efforts organized by the <strong>City</strong> <strong>of</strong> <strong>Urbana</strong> between<br />
2008-2012. Recommended strategies are intended for the operations <strong>of</strong> the municipal government as well as for <strong>Urbana</strong><br />
residents and businesses to adopt.<br />
Within Illinois, the <strong>City</strong> <strong>of</strong> Chicago and <strong>City</strong> <strong>of</strong> Evanston have adopted Climate Action Plans. Other communities in the<br />
United States including Madison, WI; Los Angeles, CA; Denver, CO; Kansas <strong>City</strong>, MO; Portland, OR; Austin, TX; Salt Lake<br />
<strong>City</strong>, UT and King County, WA have also adopted a community-wide Climate Action Plan. Closer to <strong>Urbana</strong>, Dubuque, IA<br />
and Iowa <strong>City</strong>, IA have completed their greenhouse gas inventory report which is the first step to creating a climate action<br />
plan.<br />
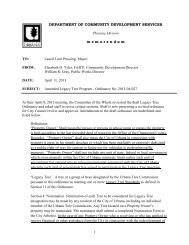
2007 2008 2012<br />
Mayor Laurel Prussing<br />
signed the U.S. Mayors<br />
Climate Protection<br />
Agreement.<br />
The Mayor and the<br />
<strong>City</strong> Council created a<br />
Sustainability Advisory<br />
Commission (SAC)<br />
PHASE I <strong>of</strong> the <strong>Urbana</strong><br />
Climate Action Plan<br />
adopted.<br />
Baseline year for emissions<br />
calculations.<br />
Sustainable <strong>Urbana</strong>:<br />
Approach for Strategic<br />
Planning report prepared<br />
Implementation and Monitoring period<br />
Figure 1. Proposed <strong>Urbana</strong> Climate Action Timeline<br />
<strong>City</strong> <strong>of</strong> <strong>Urbana</strong><br />
10
1.1<br />
INTRODUCTION<br />
Crystal Lake Park<br />
<strong>Urbana</strong> Kids’ Bike Rodeo<br />
Solar Panels in the winter at the Equinox House<br />
Volunteers at an Electronics Recycling Event<br />
2014 2020 2050<br />
PHASE II <strong>of</strong> the <strong>Urbana</strong><br />
Climate Action Plan to be<br />
adopted<br />
Goal to reduce emissions<br />
by 25% <strong>of</strong> <strong>Urbana</strong>’s 2007<br />
CO 2<br />
emissions level.<br />
Goal to reduce<br />
emissions by 80% <strong>of</strong><br />
<strong>Urbana</strong>’s 2007 CO 2<br />
emissions level.<br />
Implementation and Monitoring period<br />
Implementation and Monitoring period<br />
<strong>City</strong> <strong>of</strong> <strong>Urbana</strong><br />
11
1.2<br />
<strong>CLIMATE</strong> CHANGE CONCEPTS<br />
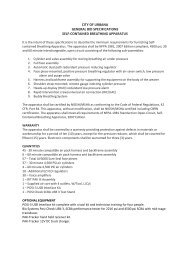
A. GREENHOUSE GAS EFFECT 4<br />
B. LOCAL AND NATIONAL IMPACTS 4<br />
Human influences have led to large increases in heat-trapping<br />
gases over the past century. The Earth’s climate depends on the<br />
functioning <strong>of</strong> a ‘natural greenhouse effect’. This effect is a result<br />
<strong>of</strong> heat-trapping gases in the atmosphere, also known as greenhouse<br />
gases, like water vapor, carbon dioxide, ozone, methane<br />
and nitrous oxide. These gases absorb heat radiated from the<br />
Earth’s surface and the lower atmosphere and then radiate much<br />
<strong>of</strong> that energy back towards the Earth’s surface. Without this<br />
natural green-house effect, the average surface temperature <strong>of</strong><br />
the Earth would be 60 o F colder. However, human activities, primarily<br />
the burning <strong>of</strong> fossil fuels (coal, oil, and natural gas) have<br />
been releasing additional heat-trapping gases, intensifying the<br />
natural greenhouse effect and changing the Earth’s climate.<br />
Carbon<br />
Dioxide<br />
HFCs,<br />
PFCs,<br />
SF 6<br />
Figure 2. Heat-trapping Gases<br />
Methane<br />
Ozone<br />
Nitrous<br />
Oxide<br />
Water<br />
Vapor<br />
Global Warming Potential <strong>of</strong> Heat-Trapping Gases:<br />
Depending on how well a gas absorbs energy and how long it<br />
stays in the atmosphere, certain greenhouse gases are more<br />
effective at warming the Earth than others. The Global Warming<br />
Potential (GWP) for a gas is a measure <strong>of</strong> the total energy that<br />
a gas absorbs over a particular period <strong>of</strong> time (usually 100<br />
years) compared to carbon dioxide. For example, methane is<br />
21 times more powerful than carbon dioxide and nitrous oxide<br />
is 300 times more powerful than carbon dioxide. For detailed<br />
information on greenhouse gases and human activities causing<br />
their emission, please read Appendix B.<br />
Other Human Influences:<br />
In addition to global-scale climate effects <strong>of</strong> heat-trapping<br />
gases, human activities also produce regional and local effects.<br />
Some <strong>of</strong> these activities partially <strong>of</strong>fset the warming caused by<br />
greenhouse gases while others increase warming. These include<br />
land surface changes such as the cutting and burning <strong>of</strong> forests,<br />
replacement <strong>of</strong> natural vegetation with agriculture and cities,<br />
and large-scale irrigation.<br />
Climate change is a global concern with local impacts.<br />
4<br />
Global Climate Change Impacts in the United States, Thomas R.Karl, Jerry M.Melillo, and Thomas C.Peterson, (eds.). Cambridge University<br />
Press, 2009.<br />
Impacts in the Midwest:<br />
• During the summer, public health and the quality <strong>of</strong> life,<br />
especially in cities, are likely to be negatively affected by<br />
increasing heat waves, reduced air quality, and an increase in<br />
insect and waterborne diseases. In winter, warming will have<br />
mixed impacts.<br />
• A significant reduction in Great Lakes water levels projected<br />
under a higher emissions scenario may lead to impacts on<br />
shipping infrastructure, beaches and ecosystems.<br />
• A likely increase in precipitation in the winter and spring<br />
months, heavier downpours and greater evaporation in<br />
summer may lead to more frequent periods <strong>of</strong> both droughts<br />
and floods, as well as water deficits.<br />
• A longer growing season will create the potential for<br />
increased crop yields. However, increases in heat waves,<br />
floods, droughts, insects and weeds will present major<br />
challenges to the management <strong>of</strong> crops, livestock, and<br />
forests.<br />
• Native species will face increasing threats from rapidly<br />
changing climate conditions, pests, diseases, loss <strong>of</strong> habitat<br />
and invasive species moving from warmer regions.<br />
Global and National Impacts:<br />
U.S. average temperature has risen by more than 2 o F over<br />
the past 50 years and is projected to rise more in the future.<br />
Precipitation has increased by an average <strong>of</strong> 5 percent over<br />
the past 50 years. Projections indicate that northern areas<br />
will become wetter, and southern areas, and particularly<br />
the west will become drier. The amount <strong>of</strong> rain falling in the<br />
heaviest downpours has increased approximately 20 percent<br />
on average in the past century and this trend is very likely to<br />
continue.<br />
• Many types <strong>of</strong> extreme weather events, such as heat waves<br />
and regional droughts have become more frequent and<br />
intense during the past 40 to 50 years.<br />
• The destructive energy <strong>of</strong> Atlantic hurricanes has increased<br />
in recent decades, and is likely to increase in this century. In<br />
the eastern Pacific, the strongest hurricanes have become<br />
stronger since the 1980s, even while the total number <strong>of</strong><br />
storms has decreased.<br />
• Sea level has risen along most <strong>of</strong> the U.S. coast over the last<br />
50 years, and will rise more in the future.<br />
• Cold-season storm tracks are shifting northward and the<br />
strongest storms are likely to become stronger and more<br />
frequent.<br />
• Arctic sea ice is declining rapidly and this is very likely to<br />
continue.<br />
<strong>City</strong> <strong>of</strong> <strong>Urbana</strong><br />
12
1.2<br />
<strong>CLIMATE</strong> CHANGE CONCEPTS<br />
C. CATEGORIES OF HUMAN RESPONSES<br />
Human responses to reduce the risk <strong>of</strong> climate change can be<br />
classified into three categories, namely:<br />
Research<br />
Mitigation<br />
Adaptation<br />
Research: Expanding our understanding <strong>of</strong> climate change<br />
impacts.<br />
There is a clear need to increase our understanding <strong>of</strong> how<br />
ecological, social and economic systems, and human health<br />
and infrastructure will be affected by climate change. New<br />
understanding is possible through a mix <strong>of</strong> activities including<br />
sustained and systematic observations, field and laboratory<br />
experiments, model development, and integrated impact<br />
assessment. This will require shared learning among researchers,<br />
engineers, water managers, policy makers, residents and other<br />
stakeholders.<br />
Mitigation: Human intervention to reduce the sources or<br />
enhance the sinks <strong>of</strong> greenhouse gases.<br />
The way we develop our communities and use energy derived<br />
from fossil fuels has significant impact on greenhouse gas<br />
emissions. Mitigation reduces the negative impacts <strong>of</strong> climate<br />
change by focusing on the sources and sinks <strong>of</strong> greenhouse<br />
gases. Mitigation implemented at the local and regional level<br />
can produce global benefits. These benefits may be noticeable<br />
in several decades because <strong>of</strong> the long residence time <strong>of</strong><br />
greenhouse gases in the atmosphere.<br />
Adaptation: Making communities more resilient to the<br />
effects <strong>of</strong> a changing climate.<br />
Effects <strong>of</strong> climate change are already observable in several<br />
communities. Adaptation involves adjustments in natural and<br />
human systems in response to actual or anticipated climate<br />
change effects to moderate harm to the community and<br />
exploit beneficial opportunities. In addition to having local and<br />
immediate benefits, addressing adaptation early can mitigate<br />
vulnerability and risk at a later date.<br />
The <strong>Urbana</strong> Climate Action Plan Phase I goals are to be achieved<br />
through a combination <strong>of</strong> education and research activities and<br />
mitigation and adaptation strategies.<br />
D. SPHERES OF <strong>ACTION</strong><br />
Responses to climate change impacts are being proposed and<br />
implemented at global, national, state, local and individual<br />
scales.<br />
Global Action:<br />
The United Nations Framework Convention on Climate Change<br />
(UNFCC) leads international efforts to investigate and combat<br />
climate change. Recognizing the problem <strong>of</strong> potential global<br />
climate change, the World Meteorological Organization<br />
(WMO) and the United Nations Environment Program (UNEP)<br />
established the Intergovernmental Panel on Climate Change<br />
(IPCC) in 1988. The IPCC assesses on a comprehensive,<br />
objective, open and transparent basis the scientific, technical<br />
and socioeconomic information relevant to understanding<br />
the risk associated with human-induced climate change, its<br />
potential impacts and options for adaptation and mitigation. In<br />
1997, 10,000 international delegates, observers and journalists<br />
gathered in Kyoto, Japan to participate in the drafting and<br />
adoption <strong>of</strong> the Kyoto Protocol pledging industrialized nations to<br />
reduce their collective greenhouse gas emissions by 5 percent<br />
below 1990 levels by 2012.<br />
National and State Action:<br />
The Department <strong>of</strong> Energy (DOE), Environmental Protection<br />
Agency (EPA), the Department <strong>of</strong> Housing and Urban<br />
Development (HUD), and the American Recovery and<br />
Reinvestment Act (ARRA) <strong>of</strong> 2009, among others, have provided<br />
grant funds to assist in the deployment <strong>of</strong> energy efficiency,<br />
green building, mass transit and other sustainability-related<br />
programs across the country. In 2010 and 2011, EPA established<br />
new fuel efficiency standards for cars, light and heavy-duty<br />
trucks, and buses which will dramatically reduce GHG emissions<br />
from the transportation sector. In May 2010, the EPA issued a<br />
rule that established thresholds for GHG emissions that define<br />
when permits are required for new and existing industrial<br />
facilities. Facilities responsible for nearly 70 percent <strong>of</strong> national<br />
GHG emissions from stationary sources will be subjected to<br />
permitting requirements under this rule.<br />
Local Action:<br />
To meet local climate action goals, Mayor Prussing signed the<br />
U.S. Mayors Climate Protection Agreement in 2007, pledging<br />
the city to strive to exceed Kyoto Protocol targets. Furthermore,<br />
several <strong>Urbana</strong> residents, businesses and non-pr<strong>of</strong>its are actively<br />
pursuing energy efficiency and sustainability efforts.<br />
<strong>City</strong> <strong>of</strong> <strong>Urbana</strong><br />
13
1.3<br />
THE BENEFITS OF LOCAL <strong>ACTION</strong><br />
Urban areas are major consumers <strong>of</strong> energy and thus are responsible for a majority <strong>of</strong> greenhouse gas emissions. Energy<br />
is needed to support daily activities and public and private infrastructure. Urban areas grow in terms <strong>of</strong> population and<br />
geographic area. Sprawling patterns <strong>of</strong> development increase transportation energy use, as well as the energy needed to<br />
power lights, appliances and heat buildings. Solid waste produced by urban areas represent greenhouse gas emissions<br />
from a product’s manufacturing process to the methane released as it decomposes in landfills.<br />
Local governments can use their decision-making and purchasing powers to increase energy efficiency and reduce<br />
greenhouse gas emissions. Local governments possess regulatory and economic tools that make communities greener<br />
and more energy and transportation efficient. These powers include zoning and land use decisions, control over building<br />
codes and licenses, infrastructure investments, municipal service delivery and jurisdiction over recreation, school and<br />
park areas.<br />
For example, within the transportation sector, money can be saved through energy efficient driving habits and<br />
substantial economic benefit can be created by investing in public transportation, and bicycle and pedestrian<br />
infrastructure. These include increased real estate values, investment in neighborhood development and direct savings<br />
for residents coping with high prices <strong>of</strong> gasoline. Increased public transportation also benefits the elderly, children and<br />
low-income individuals. According to the American Public Transportation Association, investments in mass transit provide<br />
an economic stimulus far exceeding the original investment, through increased jobs, pr<strong>of</strong>it, and tax revenue. Cities that<br />
take action to address global warming pollution have cleaner air, better sidewalks and energy efficient buildings.<br />
<strong>Urbana</strong> Bicyclists<br />
<strong>City</strong> <strong>of</strong> <strong>Urbana</strong><br />
14
1.4<br />
DEVELOPMENT AND EMISSIONS<br />
<strong>Urbana</strong>’s approach to development and greenhouse gas emissions focuses on the economy’s energy efficiency and the<br />
greenhouse gas intensity <strong>of</strong> <strong>Urbana</strong>’s sources <strong>of</strong> energy.<br />
Four economy-wide factors impact the energy related greenhouse gas emissions <strong>of</strong> a community: 5<br />
1. Population<br />
2. Economic Development<br />
3. Energy Efficiency<br />
4. Greenhouse Gas Intensity<br />
Altering these factors, alone or in combination, can influence emissions. For example, as a city develops, there is an<br />
increase in the energy required to power various human activities. However, the quantity <strong>of</strong> resultant emissions is a<br />
factor <strong>of</strong> the quality <strong>of</strong> development (energy efficiency) and the sources <strong>of</strong> the energy supply (greenhouse gas intensity).<br />
Improving the energy efficiency <strong>of</strong> new and existing developments decreases the energy intensity <strong>of</strong> a community and<br />
contributes to the reduction <strong>of</strong> greenhouse gas emissions. Similarly, by transitioning to renewable and less polluting<br />
sources <strong>of</strong> energy, excessive greenhouse gas emissions can be mitigated.<br />
<strong>Urbana</strong>’s Climate Action Plan recognizes that it is crucial for <strong>Urbana</strong> to continue to develop economically and progress<br />
towards becoming a more vibrant, attractive and resilient community. Therefore, the <strong>Urbana</strong> Climate Action Plan focuses<br />
on those actions which improve the energy efficiency <strong>of</strong> the economy and the greenhouse gas intensity <strong>of</strong> the sources<br />
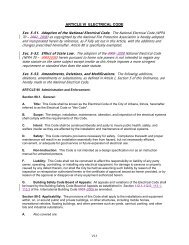
supplying energy to the community. These factors are represented in Equation A:<br />
Equation A:<br />
<strong>Urbana</strong>’s Climate Action Plan focuses on these two factors.<br />
{<br />
Energy<br />
Efficiency<br />
Greenhouse<br />
Gas Intensity<br />
GHG**= GDP*** X Population X Energy X GHG<br />
Person GDP Energy<br />
** GHG: Greenhouse Gas<br />
*** GDP: Gross Domestic Product<br />
5<br />
Adapted from Baumert, K. A., Herzog, T., & Pershing, J. (2005). Navigating the Numbers - Greenhouse Gas Data and International Climate Policy.<br />
World Resources Institute.<br />
<strong>City</strong> <strong>of</strong> <strong>Urbana</strong><br />
15
1.5<br />
A PHASED APPROACH<br />
The phased strategy <strong>of</strong> the Climate Action Plan reflects the understanding that community-wide climate action goals<br />
can be reached only through the broad and active participation <strong>of</strong> the public. Phased implementation creates the<br />
opportunities to gather feedback from members <strong>of</strong> the public to assess current actions, correct trajectories and reach<br />
informed decisions. Accordingly, the Climate Action Plan will be a living document which will undergo revisions as<br />
improvements in data availability and modeling analysis occur. The <strong>City</strong> will review the progress <strong>of</strong> Phase 1 activities<br />
annually including an appendix containing public comment results. During Phase I, the <strong>City</strong> will implement the Phase<br />
I strategies outlined in this document. Simultaneously, the <strong>City</strong> will engage the public on Phase I strategies and the<br />
direction for Phase II strategies as part <strong>of</strong> an ongoing process <strong>of</strong> public dialogue. The anticipated time frame for<br />
implementation <strong>of</strong> Phase I strategies is two years from the <strong>City</strong> Council’s adoption <strong>of</strong> Phase I.<br />
2012<br />
Phase 1 <strong>Urbana</strong><br />
Climate Action<br />
Plan adopted<br />
2013-2015<br />
Phase I implementation and public engagement<br />
period<br />
2015<br />
Phase 2 <strong>Urbana</strong><br />
Climate Action<br />
Plan adopted<br />
Over the next two years,<br />
1. Phase I strategies will be assessed by asking the public:<br />
• How well are Phase I strategies working<br />
• What are the reasons for participating or not participating in Phase I strategies<br />
• What are the barriers that limit the public’s participation in Phase I strategies<br />
2. Public input will be gathered through a combination <strong>of</strong> the following public engagement methods:<br />
• Conversations with <strong>Urbana</strong>’s neighborhood associations and community organizations;<br />
• Task forces to address specific sectors;<br />
• Targeted interviews with key stakeholders;<br />
• Mail and online surveys;<br />
• An online portal;<br />
• Public input sessions.<br />
3. Public input will help develop Phase II through:<br />
• The contribution <strong>of</strong> ideas for effective strategies by the public;<br />
• Assessing the participation <strong>of</strong> residents in Phase I strategies;<br />
• Identifying strategies to reduce specific barriers to participation.<br />
Based on data gathered over the next two years, a Phase II document will be written which will define additional<br />
strategies to take the <strong>City</strong> the rest <strong>of</strong> the way to its greenhouse gas emissions reduction goal.<br />
Over the implementation period <strong>of</strong> Phase I, the SAC and the <strong>City</strong> <strong>of</strong> <strong>Urbana</strong> will continue to coordinate with other climate<br />
planning efforts within Champaign County and seek opportunities to shape this plan toward an integrated regional<br />
approach.<br />
<strong>City</strong> <strong>of</strong> <strong>Urbana</strong><br />
16
1.6<br />
CITY OF URBANA SUSTAINABILITY VISION STATEMENT<br />
The <strong>City</strong> <strong>of</strong> <strong>Urbana</strong> defines sustainability as progress that meet the needs <strong>of</strong> the present generation without<br />
compromising the ability <strong>of</strong> future generations to meet their needs. Sustainable development requires the<br />
consideration <strong>of</strong> environmental, equity and economic factors, also known as a triple bottom-line approach towards<br />
future development. The Sustainability Advisory Commission recognizes that a healthy economy is diverse, equitable<br />
and dynamic, and prioritizes community resilience and security. On the basis on several discussions and examples <strong>of</strong><br />
Sustainability Vision Statements <strong>of</strong> several communities across the United States, the Sustainability Advisory Commission<br />
drafted the following Sustainability Vision Statement for the <strong>City</strong> <strong>of</strong> <strong>Urbana</strong>:<br />
The <strong>City</strong> <strong>of</strong> <strong>Urbana</strong> is committed to meeting the needs <strong>of</strong> today’s residents without compromising the<br />
ability <strong>of</strong> future generations to meet their needs.<br />
The <strong>City</strong> <strong>of</strong> <strong>Urbana</strong> therefore works toward:<br />
1. Supporting a healthy, diverse and equitable economy;<br />
2. Increasing resilience and community security with respect to food, water, energy and<br />
other human needs;<br />
3. Enhancing quality <strong>of</strong> life through stewardship <strong>of</strong> natural resources, restoration <strong>of</strong><br />
ecological integrity, and conservation <strong>of</strong> open space.<br />
<strong>City</strong> <strong>of</strong> <strong>Urbana</strong><br />
17
1.7<br />
CITY OF URBANA <strong>CLIMATE</strong> <strong>PLAN</strong>NING PRINCIPLES<br />
The following Climate Planning Principles are based on the ‘environmental sustainability’ and ‘quality <strong>of</strong> life’ sections <strong>of</strong><br />
the <strong>Urbana</strong> <strong>City</strong> Council and Mayoral Goals. These were adopted by <strong>City</strong> Council in February 2010, and updated in May<br />
2012. The <strong>City</strong> Council and Mayoral goals represent the common point <strong>of</strong> understanding from which the planning and<br />
government <strong>of</strong> <strong>Urbana</strong> proceeds.<br />
1. Promote innovative programs, regional partnerships and incorporate best management practices that promote<br />
energy conservation and efficiency in building construction, operations, and maintenance, in<br />
residential development, business and industrial activities, transportation, municipal and government<br />
operations, and in all other areas where energy resources are used.<br />
2. Increase <strong>Urbana</strong>’s reliance on clean, renewable energy sources including, but not limited to the <strong>City</strong>’s proactive<br />
participation in opportunities to make clean, renewable energy available to the public.<br />
3. Ensure equitable access and impact <strong>of</strong> climate action programs to all members <strong>of</strong> the <strong>Urbana</strong> community.<br />
4. Work to attract green businesses and industries as a fundamental part <strong>of</strong> economic development activities.<br />
5. Assist existing businesses in efforts to operate with less greenhouse gas emissions.<br />
6. Pursue climate action strategies that are cost effective.<br />
7. Support downtown development, land-use planning, parks, amenities, and transportation infrastructure that<br />
improves the quality <strong>of</strong> life in <strong>Urbana</strong> while reducing its carbon footprint.<br />
8. Cooperate and collaborate with other governmental entities to promote greenhouse gas emissions reduction.<br />
9. Promote and expand existing sustainability projects including the UCycle recycling program and the <strong>Urbana</strong><br />
Market at the Square, and encourage sustainable landscaping and gardening.<br />
<strong>City</strong> <strong>of</strong> <strong>Urbana</strong><br />
18
1.8<br />
PUBLIC ENGAGEMENT<br />
Public input sessions in February and March, 2010<br />
Public input on the Phase I Climate Action Plan was gathered through a written survey at public input sessions organized<br />
by the <strong>City</strong> between February and March 2010. Since 2010, this survey has also been made available to residents on the<br />
<strong>City</strong>’s website. Written comments on the Plan were also gathered at <strong>Urbana</strong>’s Market at the Square. Public Input Sessions<br />
were held at the <strong>Urbana</strong> Civic Center at 108 Water Street in <strong>Urbana</strong> on February 24, 2010 and March 11, 2010. Input<br />
was specifically sought on the <strong>Urbana</strong> greenhouse gas inventory and the proposed goal <strong>of</strong> reducing community-wide<br />
greenhouse gas emissions by 25 percent by the year 2020.<br />
The feedback received through the public input session has been considered in defining Phase I actions. A majority <strong>of</strong> the<br />
participants from the 2010 workshop were in the process <strong>of</strong> reducing their personal or business energy consumption.<br />
Several participants reported having successfully implemented a project to reduce energy consumption.<br />
Comments fell into one or more <strong>of</strong> the following categories:<br />
Education<br />
Transportation &<br />
Planning<br />
Energy<br />
Financial<br />
Miscellaneous<br />
Improve access to technical expertise, information and workshops on water and energy<br />
conservation, and the steps individuals can take to reduce greenhouse gas emissions.<br />
Improve infrastructure to support bicycling, walking and public transportation<br />
use, avoid sprawl, introduce more electric vehicles and improve pedestrian<br />
access to bus stops.<br />
Improve access to renewable energy sources and access to residential energy<br />
audits, introduce smart metering and support energy efficient buildings.<br />
Improve access to financing options to support retr<strong>of</strong>its, renewable energy<br />
installations, energy efficient buildings and incentivize reducing energy use.<br />
Introduce a carbon <strong>of</strong>fset program, coordinate with the University, provide<br />
more opportunity to buy local produce, locate more grocery stores within walking<br />
distance, encourage native landscaping species, assist residents in<br />
prioritizing actions to reduce greenhouse gas emissions.<br />
<strong>City</strong> <strong>of</strong> <strong>Urbana</strong><br />
19
1.8<br />
PUBLIC ENGAGEMENT<br />
In addition to the above comments, suggestions were also received for policy, incentive, training, outreach and education<br />
programs.<br />
Following the Sustainability Advisory Commission’s approval <strong>of</strong> the final draft for public review on September 4, 2012,<br />
the draft Plan was posted on the <strong>City</strong> <strong>of</strong> <strong>Urbana</strong> website along with a feedback web-form. Copies <strong>of</strong> the Plan along with<br />
comment cards were also made available at the <strong>Urbana</strong> Free Library. Additionally, the draft Plan was available to the<br />
public at <strong>Urbana</strong>’s Market at the Square on September 15 and 22. On October 2, 2012 the <strong>City</strong> held an open house in<br />
the <strong>City</strong> Council Chambers to take comment on the final draft plan. The open house was publicized on the <strong>City</strong>’s website<br />
and via a press release to local media. The availability <strong>of</strong> the draft plan for public review was also publicized via a news<br />
article on the <strong>City</strong>’s website; the <strong>City</strong>’s Sustainability Facebook page; on Smile Politely, an independent online magazine<br />
in Champaign-<strong>Urbana</strong>; via a press release in local media; and via video coverage on WICD (ABC) news. <strong>City</strong> staff members<br />
were interviewed by the Daily Illini. Additionally, staff emailed and called neighborhood associations with list-serves.<br />
Public comment received to date is described in Appendix C.<br />
Comments on the <strong>Urbana</strong> Climate Action Plan Phase 1 can be made via:<br />
Mail:<br />
Website:<br />
A completed Public Input Form (Appendix D) can be mailed to<br />
<strong>City</strong> <strong>of</strong> <strong>Urbana</strong>, 400 S Vine Street, <strong>Urbana</strong>, Illinois 61801.<br />
Comments on the Climate Action Plan Phase I can be made at<br />
www.urbanaillinois.us/climateactionplan.<br />
Discuss Climate Action in <strong>Urbana</strong> on Facebook: www.facebook.com/sustainableurbana<br />
Public input sessions in February and May, 2010<br />
<strong>City</strong> <strong>of</strong> <strong>Urbana</strong><br />
20
1.9<br />
CURRENT <strong>PLAN</strong>S<br />
The <strong>City</strong> <strong>of</strong> <strong>Urbana</strong> has adopted a number <strong>of</strong> sustainability-related plans and studies. The <strong>Urbana</strong> Climate Action Plan<br />
will complement other <strong>City</strong> documents as part <strong>of</strong> a “System <strong>of</strong> Plans”. The following section summarizes the most crucial<br />
plans relevant to the Climate Action Plan Phase I.<br />
A. 2008 SUSTAINABLE URBANA: APPROACH FOR STRATEGIC <strong>PLAN</strong>NING REPORT<br />
In 2008, the <strong>City</strong> <strong>of</strong> <strong>Urbana</strong> presented a report articulating <strong>Urbana</strong>’s approach to developing a Sustainability Strategic<br />
Plan. The report built on sustainability activities initiated by the <strong>City</strong> from 2007, including brainstorming sessions on<br />
ways to reduce <strong>Urbana</strong>’s environmental footprint, the Mayor’s endorsement <strong>of</strong> the U.S. Mayor Climate Protection<br />
Agreement in May 2007 and a public forum convened by the Mayor in February 2008 entitled “Sustainability: What<br />
You Can Do”. The Approach to Strategic Planning Report explains <strong>Urbana</strong>’s sustainability initiatives within the context <strong>of</strong><br />
other city plans and achievements. The report establishes the <strong>City</strong>’s broad sustainability goals, provides implementation<br />
strategies and articulates a future course <strong>of</strong> action. These include the commitment to exceed the Kyoto Protocol target<br />
for a 5 percent reduction in greenhouse gas emissions from 1990 levels by 2012.<br />
B. 2005 URBANA COMPREHENSIVE <strong>PLAN</strong><br />
The Comprehensive Plan guides planning and development policy for the <strong>City</strong> and the one-and-half mile territory<br />
adjacent to the <strong>City</strong> limits. It is the primary planning document for the <strong>City</strong> and greatly affects how <strong>Urbana</strong> will develop.<br />
Four main principles make up the foundation <strong>of</strong> the Comprehensive plan: Quality <strong>of</strong> Life, Sensible Growth, Services<br />
and Infrastructure, and Mobility. Each principle has multiple goals, several <strong>of</strong> which are helpful in guiding strategies for<br />
reducing greenhouse gas emissions. For example, ensuring land use patterns conserve energy, minimizing the impact <strong>of</strong><br />
natural and man-made disasters, preserving natural resources and environmentally sensitive areas (Quality <strong>of</strong> Life: goals<br />
5,6,8); promoting infill development and encouraging compact, contiguous and sensible growth, increasing the vitality<br />
<strong>of</strong> downtown <strong>Urbana</strong> (Sensible Growth: goals 15, 18, 22); encouraging development where infrastructure already exists,<br />
protecting areas from increases in run<strong>of</strong>f and localized flooding, and improving quality <strong>of</strong> life through social services,<br />
affordable housing and economic opportunity (Services and Infrastructure: goals 34, 36, 39); and optimizing existing<br />
transportation systems, improving access to transportation modes, creating a multi-modal system, avoiding development<br />
which is overly-dependent on the automobile, improving pedestrian and bicycle facilities, and integrating land-use<br />
and transportation concerns for new projects (Mobility: goals 45-50). In 2012, the <strong>Urbana</strong> Comprehensive Plan was<br />
amended to include a ‘Complete Streets Element’. Complete streets are designed and operated to enable safe access<br />
for pedestrians, bicyclists, motorists and transit riders <strong>of</strong> all ages and abilities to enable safe passage along and across a<br />
street.<br />
C. 2009 LONG RANGE TRANSPORTATION <strong>PLAN</strong><br />
The Long Range Transportation Plan (LRTP) is a federally mandated document that is updated every five years by the<br />
Champaign County Regional Planning Commission. The Plan details how the urbanized area transportation system<br />
will evolve over the next twenty five years. The current LRTP looks at the projected evolution <strong>of</strong> automobile, bicycle,<br />
pedestrian, bus transit, rail and air travel to the year 2035, in order to identify regionally beneficial transportation<br />
projects to receive federal funding. The LRTP goals support greenhouse gas reduction by encouraging non-single<br />
occupancy vehicle travel (Goal 1); advocating compact development and mixed-use development and redevelopment<br />
to create a more walkable, sustainable, and efficient development pattern (Goal 2); requiring a transportation system<br />
having convenient multi-modal access to all parts <strong>of</strong> the urbanized area with the capacity to increase mobility during<br />
peak traffic hours (Goal 5); providing facilities for non-auto modes <strong>of</strong> transportation in order to improve mobility and<br />
decrease the number <strong>of</strong> vehicles on our roadways (Goal 6); adopting an approach to transportation planning which<br />
promotes environmental stewardship and energy conservation (Goal 7); and prioritizing improvement to existing<br />
roadways and adding pedestrian, bicycle and transit facilities where needed (Goal 12).<br />
<strong>City</strong> <strong>of</strong> <strong>Urbana</strong><br />
21
1.9<br />
CURRENT <strong>PLAN</strong>S<br />
D. 2004 CHAMPAIGN COUNTY GREENWAYS AND TRAILS <strong>PLAN</strong><br />
The Greenways and Trails Plan is a county-wide plan, designed to foster interagency coordination in order to implement<br />
an integrated greenways and trails system for the Champaign County area. The plan guides the development <strong>of</strong><br />
pedestrian paths, bikeways, public open spaces, and other greenways over the period <strong>of</strong> 2004-2024. Greenways and<br />
trails provide many environmental benefits, including:<br />
• Making communities better places to live by preserving and creating open spaces.<br />
• Encouraging physical fitness and healthy lifestyles.<br />
• Creating new opportunities for outdoor recreation and non-motorized transportation.<br />
• Strengthening local economies.<br />
• Preserving culturally and historically valuable areas.<br />
The plan’s goals address the issue <strong>of</strong> sustainability and energy consumption and include a commitment to providing all<br />
Champaign County residents with a system <strong>of</strong> bikeways, bicycle routes, pedestrian paths, trails, and other greenways<br />
that provides connections between residents, schools and workplaces, other travel modes, major activity centers and<br />
recreational sites. The plan also suggests creating a greenways and trails system that emphasizes safety, user-friendliness,<br />
efficiency, mobility, and convenience.<br />
E. 2012 DOWNTOWN URBANA <strong>PLAN</strong><br />
The 2012 Downtown <strong>Urbana</strong> Plan’s purpose is to guide the development <strong>of</strong> downtown in matching the needs <strong>of</strong> the<br />
community. The plan envisions a economically vibrant, publicly accessible, culturally thriving downtown, that is well<br />
connected to surrounding neighborhoods. A mix <strong>of</strong> businesses, residences and other attractions in downtown can<br />
promote sustainable and healthy lifestyles. Goals relevant to the Climate Action Plan include promoting urban-style infill<br />
development, improving mobility to and from downtown, and reducing downtown <strong>Urbana</strong>’s environmental impact.<br />
F. 2008 BONEYARD CREEK MASTER <strong>PLAN</strong><br />
The 2008 Boneyard Creek Master Plan is intended to transform Boneyard Creek from a highly-urbanized drainage ditch<br />
into a significant public amenity, which will provide a destination for leisure and enjoyment, while improving the local<br />
pedestrian and bicycle network, protecting and enhancing wildlife and habitat, and improving flood control and water<br />
quality. The Boneyard Creek runs through the core <strong>of</strong> downtown <strong>Urbana</strong>, in a half-mile stretch between Main and Vine<br />
Streets. By realizing the potential for <strong>of</strong> Boneyard Creek, <strong>Urbana</strong> will not only have a premium public amenity within the<br />
transit friendly downtown area, but also be able to reduce downtown <strong>Urbana</strong>’s environmental impact.<br />
G. 2010 URBANA BICYCLE MASTER <strong>PLAN</strong><br />
The <strong>City</strong> <strong>of</strong> <strong>Urbana</strong> Bicycle Master Plan reflects the <strong>Urbana</strong> <strong>City</strong> Council goal to “Get <strong>Urbana</strong> Bicycling.” The Bicycle<br />
Master Plan builds on the 2004 Champaign County Greenways and Trails Plan by identifying bicycle transportation<br />
improvements throughout the <strong>City</strong>, which include:<br />
1. Achieving a 50 percent increase in bicycle mode share in <strong>Urbana</strong> for all trip purposes in the next five years.<br />
2. Achieving a Bicycle Friendly Community award through the League <strong>of</strong> American Bicyclists.<br />
3. Substantially expanding the bicycle network.<br />
The Bicycle Master Plan goals are being implemented by creating and maintaining the bicycling network, increasing<br />
the safety <strong>of</strong> the bicycling network, providing supporting facilities to make bicycling transportation more convenient,<br />
educating residents about alternative modes <strong>of</strong> transportation, and actively securing funding for bicycle improvement<br />
<strong>City</strong> <strong>of</strong> <strong>Urbana</strong><br />
22
1.9 CURRENT <strong>PLAN</strong>S<br />
programs. This includes dedicating a percentage <strong>of</strong> the Capital Improvement Projects funding for construction projects to<br />
bicycle infrastructure improvements.<br />
H. 2009 CHAMPAIGN COUNTY MULTI-JURISDICTIONAL NATURAL HAZARD MITIGATION <strong>PLAN</strong><br />
There are now many observed, well-documented impacts <strong>of</strong> climate change on natural resources and ecosystems in<br />
many regions in the United States and the world. The observed changes in temperatures, intensity <strong>of</strong> storms, occurrence<br />
<strong>of</strong> floods and droughts, and potential impact on human health, are projected to grow in number and magnitude.<br />
Adapting to climate change effects presents a major challenge for emergency management leaders.<br />
The Champaign County Multi-Jurisdictional Natural Hazard Mitigation Plan (HMP) identifies local hazard mitigation goals<br />
and objectives, and specific hazard mitigation actions to implement over the long term that will reduce risk and potential<br />
future losses associated with the occurrence <strong>of</strong> natural hazards before they occur. The following Hazard Mitigation Goals<br />
are important for climate change adaptation planning:<br />
Goal 1: Minimize avoidable deaths and injuries due to natural hazards through education, warning systems and<br />
protective infrastructure;<br />
Goal 2: Protect existing and new infrastructure from impacts <strong>of</strong> natural hazards;<br />
Goal 3: Include natural hazard mitigation in local government plans and regulations; and<br />
Goal 4: Coordinate natural hazard mitigation efforts <strong>of</strong> participating jurisdictions.<br />
Adaptation activities may be described as a “new layer to existing planning agendas”. Key steps included in the HMP<br />
include identifying vulnerabilities, valuation <strong>of</strong> impacts, prioritization <strong>of</strong> alternatives and adoption <strong>of</strong> appropriate<br />
planning instruments.<br />
<strong>City</strong> <strong>of</strong> <strong>Urbana</strong><br />
23
1.10<br />
CURRENT <strong>ACTION</strong>S<br />
<strong>Urbana</strong> businesses, organizations and individuals are actively pursuing sustainability programs and energy efficiency<br />
activities. The following section describes a few <strong>of</strong> several diverse sustainability approaches being practiced in <strong>Urbana</strong>.<br />
The <strong>City</strong> <strong>of</strong> <strong>Urbana</strong> is committed to supporting resident-driven activities through administrative and financial assistance,<br />
and a learning approach towards new ideas and proposals.<br />
A. COMMUNITY <strong>ACTION</strong>S<br />
Crystal View Townhomes<br />
• Brinshore Development • Homestead Corporation <strong>of</strong> Champaign-<strong>Urbana</strong> • Housing Authority <strong>of</strong> Champaign County<br />
Crystal View Townhomes replaced public housing with 73 mixed-income townhomes, apartments and single-family units,<br />
the majority <strong>of</strong> which are set aside for low and very low income families. The environmentally friendly project includes<br />
district geothermal heating and cooling, energy efficient light emitting diode (LED) street lights and a roundabout which<br />
also acts as a bio-swale to direct rainwater run<strong>of</strong>f to a nearby creek.<br />
The <strong>City</strong> invested several grants and loans into the project which helped fund three <strong>of</strong> the 73 units and supported the<br />
installation <strong>of</strong> public infrastructure. More information can be found at http://crystalviewtownhomes.com.<br />
North-side play areas<br />
Community Center<br />
Dublin Passive House • e-co lab: Ecological Construction Laboratory Project<br />
Dublin Passive House is a newly constructed single-family affordable home designed and built by e-co lab, a housing<br />
development organization <strong>of</strong> the <strong>Urbana</strong> HOME consortium. It consists <strong>of</strong> two bedrooms and a den, and is targeted at a<br />
first-time home buyer. The two-story, 1330 square-foot home consumes 90 percent less energy for heating and cooling<br />
than a standard home <strong>of</strong> its size. On average, the home cuts 75 percent <strong>of</strong> its total energy consumption each month<br />
when compared to a standard home.<br />
By using free solar energy, super insulation, air-tightness, eliminating thermal bridging, and other passive design<br />
principles, Dublin house performs as one <strong>of</strong> the most energy efficient homes in the state <strong>of</strong> Illinois. The walls, ro<strong>of</strong>, and<br />
floor <strong>of</strong> the Dublin House are thicker than standard construction due to the amount <strong>of</strong> insulation. This insulation makes<br />
the house like a thermos bottle; it slows and blocks heat transmission from the outside to inside, keeping the inside at<br />
a relatively constant temperature even if an extreme temperature hits the outside. It is also virtually air tight, which<br />
eliminates drafts and exposure to outdoor air temperature. Because there are no leaks or poor seals to let fresh air in,<br />
the Dublin house has an Energy Recovery Ventilator (ERV) that constantly cycles fresh air into the house and stale air out.<br />
Thermal bridging or heat transfer between the internal space and the external building enclosure, is eliminated to keep<br />
heat from easily flowing out <strong>of</strong> the house along the path <strong>of</strong> least resistance.<br />
Additionally, the variation in the sun from season to season is used for passive solar heating. Because <strong>of</strong> this, the Dublin<br />
<strong>City</strong> <strong>of</strong> <strong>Urbana</strong><br />
24
1.10<br />
CURRENT <strong>ACTION</strong>S<br />
House has very large south-facing windows to capture the sun’s free energy. Above these windows lies a trellis, where<br />
Concord grapes will grow, providing excellent summer shading, and then -- bare in the winter -- letting the sun’s energy<br />
warm the home. More information can be found at www.e-colab.org, or by calling e-co lab at 217 344 1294.<br />
View from the South-East<br />
Bedroom 1<br />
Bathroom<br />
South Facade<br />
Green Business Certification Program • Illinois Green Business Association (IGBA)<br />
The Illinois Green Business Association certification program seeks to increase awareness <strong>of</strong> sustainable business<br />
practices and what sustainability means to a customer and the community. The IGBA program and services help<br />
businesses reduce energy consumption, greenhouse gas emissions, and pollution. The program encourages businesses<br />
to take a leadership role and exemplify sustainable business practices in the communities they serve. Green certification<br />
demonstrates tangible results for resource and cost reductions and verifies businesses green claims. Additional benefits<br />
include reduced energy and water consumption, a decreased bottom line, increased public relations, improved employee<br />
morale, a culture <strong>of</strong> responsible consumerism, a transparent process to becoming a“green business”, and examples <strong>of</strong><br />
green practices for the workplace and home.<br />
Certified <strong>Urbana</strong> businesses include Busey Bank and Common Ground Food Co-Op. The Art Mart and Clark Lindsey<br />
Village are currently enrolled in the certification program. To achieve certification, businesses must complete certain<br />
required Green Management Practices (GMPs) and 50% <strong>of</strong> the remaining GMPs depending on their applicability to a<br />
business, providing flexibility to match the businesses structure and culture. GMPs include both the physical equipment<br />
in a business as well as daily policies and procedures that can lead to reduced environmental impact.<br />
The IGBA assists businesses in assessing, completing and verifying their green practices. Once a business is certified and<br />
<strong>City</strong> <strong>of</strong> <strong>Urbana</strong><br />
25
1.10 CURRENT <strong>ACTION</strong>S<br />
has verified all its green practices, the IGBA assists with marketing the businesses green efforts to their customers and<br />
the community, with a focus on education and transparency. A business receives certification in nine areas <strong>of</strong> sustainable<br />
business practice, which include:<br />
1. Energy Conservation 6. Landscape<br />
2. Water Conservation 7. General Employee Practices (Program Awareness)<br />
3. Waste Reduction and Recycling 8. Purchasing<br />
4. Pollution Prevention 9. Community Development<br />
5. Transportation<br />
More information can be found at http://illinoisgba.com or by calling IGBA at 217 531 2179.<br />
Busey Bank (Corporation Wide)<br />
Certified Green Business<br />
Common Ground Food Co-op<br />
Certified Green Business<br />
Equinox Net Zero Energy House • Newell Instruments<br />
The Equinox House in <strong>Urbana</strong> is a ‘zero energy building’ (ZEB), meaning it generates enough energy on-site to power<br />
house operations and an electric vehicle for approximately 8,000 - 10,000 miles. Designed and constructed by Newell<br />
Instruments for Ty and Debra Newell, the house has a barrier-free, single story floor plan.<br />
A primary aspect <strong>of</strong> the house design is a 8.2kW solar photovoltaic (PV) energy collection system producing 10,000<br />
kWh per year in Illinois weather conditions. Of this energy, 8,000 kWh is sufficient for the two-person family’s energy<br />
requirements. The remainder - 2,000 kWh - will be used to power an electric vehicle. The house is ‘grid-tied’ meaning<br />
it feeds energy back and forth to the electric grid. At night, the house borrows energy from the grid and during the day,<br />
it feeds excess electricity into the utility grid helping it with peak demands. A typical house with modern construction<br />
in central Illinois requires 24,000 kWh <strong>of</strong> energy consumption per year. The Equinox house is predicted to require 7,200<br />
kWh per year, or less than 1/3rd the requirement <strong>of</strong> a typical modern house. This was possible through a combination<br />
<strong>of</strong> energy efficient measures, for example, a smart house design including a ro<strong>of</strong> overhang which acts as a solar reflector<br />
in the winter and as a solar shade in the summer, using high-performance ro<strong>of</strong>, walls and windows, and an intelligent<br />
multi-functioned comfort conditioning system developed by Newell Instruments. Energy efficient appliances, such as a<br />
heat pump water heater (HPWH) and high performance laundry and kitchen appliances contribute to the reduction in<br />
household energy demand. The marginal additional cost <strong>of</strong> using energy efficient appliances is to be recovered through<br />
the substantial operational cost savings due to the reduced energy demand through the appliances’ lifespan.<br />
<strong>City</strong> <strong>of</strong> <strong>Urbana</strong><br />
26
1.10 CURRENT <strong>ACTION</strong>S<br />
The Equinox House is also designed to operate on rain water collected from the ro<strong>of</strong>. The rainwater collection system<br />
designed by Newell instruments incorporates divertors that collect debris during initial rainfall and divert remaining<br />
water to a 1700 gallon cistern. The cistern is buried in the backyard with connecting pipes located below the freezing<br />
level for the region. A pumping station includes a remote monitoring system for measuring the cistern water level<br />
which can be supplemented by potable (city) water in case the levels drops too low. Current approval by the Illinois<br />
State Department <strong>of</strong> Public Health allows Equinox House to only use rain water for toilets. A number <strong>of</strong> commercial<br />
buildings in Illinois also have rainwater supplied to toilets. Equinox house is one <strong>of</strong> the first private residences in an<br />
Illinois municipality to receive this approval. Plumbing is designed so that rain water can be safely used for 80 percent <strong>of</strong><br />
residents’ requirements in the future, when this is permitted by the Department <strong>of</strong> Public Health.<br />
More information on equinox house can be found online at http://buildequinox.com/, or by contacting Newell<br />
Instruments at http://buildequinox.com/about/contact-us/.<br />
View from street<br />
Solar PV panels in back yard.<br />
View from Street in winter with solar panels in the rear.<br />
<strong>City</strong> <strong>of</strong> <strong>Urbana</strong><br />
27
1.10 CURRENT <strong>ACTION</strong>S<br />
<strong>Urbana</strong>’s Heritage and Energy<br />
Located in the heart <strong>of</strong> the prairie in central Illinois, the <strong>City</strong> <strong>of</strong> <strong>Urbana</strong> enjoys a wonderful stock <strong>of</strong> historic commercial<br />
and residential buildings with a history and architecture that help illustrate the evolution <strong>of</strong> the community. Preservation<br />
saves energy by taking advantage <strong>of</strong> the non-recoverable energy embodied in existing buildings and extending their<br />
use. Most <strong>of</strong>ten, the total energy investment needed to renovate and operate a historic building is less than the energy<br />
required to construct and operate new facilities, even though new buildings may use less energy annually for operations.<br />
The <strong>City</strong> <strong>of</strong> <strong>Urbana</strong> recognizes that preservation and sustainability are inextricably linked and finding a way to preserve<br />
our built environment and yet make it more sustainable is a very important part <strong>of</strong> the future for both fields. The <strong>Urbana</strong><br />
Historic Preservation Commission has designated thirteen properties as Historic Landmarks in <strong>Urbana</strong>. Additionally, there<br />
are there are three designated Historic Districts in <strong>Urbana</strong> - the West Main Street Historic District, the Joseph Royer<br />
Historic District and the Buena Vista Court Historic District.<br />
The Halberstadt House<br />
The <strong>Urbana</strong>-Lincoln Hotel<br />
Municipal Facilities<br />
Fleet Division:<br />
25 percent <strong>of</strong> the <strong>City</strong>’s current vehicle fleet is flex fuel or hybrid Flex Fuel (E-85) vehicles. All <strong>City</strong> diesel equipment is<br />
fueled on an 11-18 percent bio-diesel blend.<br />
Arbor Division:<br />
The Arbor Division recently installed GPS units in compost delivery trucks and purchased a larger trailer to make delivery<br />
efforts much more efficient. The Division has also invested in a rechargeable battery powered blower for clean-up in the<br />
Downtown Business District which accounts for 25 percent <strong>of</strong> the Division’s clean-up work.<br />
Public Works:<br />
The Public Works Department’s Electric Section performs a twice yearly Signal Coordination check which is specifically<br />
designed as an emissions reduction and fuel savings measure by enabling platoons <strong>of</strong> cars to move through an area<br />
with the least number <strong>of</strong> stops possible. Per federal mandate, as <strong>of</strong> January 1, 2009, the <strong>City</strong> when purchasing roadway<br />
luminaires, must be in compliance with the Energy Independence & Security Act (EISA) <strong>of</strong> 2007. Under EISA, certain light<br />
ballasts must meet stringent efficiency standards. Furthermore, almost all T12 fluorescent lamps in <strong>City</strong> facilities have<br />
been replaced with more efficient T8 and T5 lamps. Almost all incandescent bulbs in <strong>City</strong> facilities have been replaced<br />
with Compact Fluorescent Lamps (CFLs). Public Works has an anti-idling policy for all its vehicles.<br />
<strong>City</strong> <strong>of</strong> <strong>Urbana</strong><br />
28
1.10 CURRENT <strong>ACTION</strong>S<br />
Office Equipment:<br />
Energy Star designation is required for all appliance and <strong>of</strong>fice equipment purchases at the <strong>City</strong> <strong>of</strong> <strong>Urbana</strong>. To better<br />
control building temperature, programmable thermostats have been installed in all <strong>City</strong> buildings where feasible.<br />
Solar Powered Parking Lights:<br />
The <strong>City</strong> recently installed twenty solar power parking signs around downtown <strong>Urbana</strong>. The project was financed by<br />
funds collected through parking fees and permits. The solar powered signs were significantly more affordable than<br />
electric powered signs.<br />
B. RECYCLING IN URBANA<br />
Curbside Recycling Bins Recycling at Sweetcorn Festival Electronics Recycling Recycling Education<br />
U-Cycle:<br />
<strong>Urbana</strong>’s residential recycling program, U-CYCLE, began in 1986 and was one <strong>of</strong> the first citywide recycling programs<br />
<strong>of</strong>fered in Illinois. <strong>Urbana</strong>’s curbside recycling program services an estimated 18,000 residents in single-family through<br />
four-unit dwellings. The U-CYCLE program expanded in 1999 when recycling was <strong>of</strong>fered to all residents in multifamily<br />
dwellings including apartment buildings, dormitories, fraternities/sororities, rooming houses and condominiums and<br />
serves an estimated 15,000 residents in <strong>Urbana</strong>.<br />
By recycling, <strong>Urbana</strong> residents conserve natural resources, reduce reliance on fossil fuels, and foster economic growth<br />
through the recovery and reuse <strong>of</strong> marketable commodities. The U-CYCLE program has created nine jobs in the recycling<br />
industry. In 2011, there was a 36 percent recycling rate for U-CYCLE programs and landscape recycling combined. In<br />
2009 and 2010 the recycling rate for the combined programs including landscape recycling was 37 percent. Resident<br />
participation rates in the U-CYCLE program average 60 percent.<br />
Furthermore, U-CYCLE has initiated sustainability efforts in the community at the annual <strong>Urbana</strong> Sweetcorn Festival<br />
beginning in 2008, including the implementation <strong>of</strong> recycling tents for patrons to recycle beverage cups and compost<br />
corn cobs at the festival. These tents are staffed with volunteers that educate patrons on recycling and distribute<br />
U-CYCLE information and giveaways. In addition, the recycling coordinator has developed a section <strong>of</strong> the festival<br />
called “Green Alley” that highlights local environmental initiatives and organizations in the community, and <strong>of</strong>fers ecoentertainment<br />
to promote environmental awareness. In 2011, U-CYCLE collected more than 800 lbs. <strong>of</strong> recycling and 15<br />
cubic yards <strong>of</strong> corn cobs for composting from the festival.<br />
Battery and Electronics Recycling:<br />
The <strong>City</strong> <strong>of</strong> <strong>Urbana</strong> developed the battery drop-<strong>of</strong>f recycling program in 2007, and has organized county-wide electronics<br />
recycling events since 2007. Since implementation in 2007, the battery recycling collection program has been very<br />
<strong>City</strong> <strong>of</strong> <strong>Urbana</strong><br />
29
1.10 CURRENT <strong>ACTION</strong>S<br />
successful, with an average <strong>of</strong> 10,000 lbs. <strong>of</strong> batteries recycled annually. By recycling batteries, <strong>Urbana</strong> residents keep<br />
toxic materials such as mercury, lead, cadmium and lithium from entering landfills or groundwater. Recycling single-use<br />
batteries also recovers zinc, manganese dioxide and silver for reuse. Additional sustainability efforts include conducting<br />
county-wide electronics recycling collection events from 2007 to the present. Collection events from 2007 – 2011<br />
resulted in a total <strong>of</strong> 662 tons <strong>of</strong> electronics scrap being collected and recycled. Overall, there has been a 475 percent<br />
increase in electronics recycled at county-wide events during this period. Recycling obsolete electronics encourages the<br />
safe management <strong>of</strong> hazardous components, supports the recovery and reuse <strong>of</strong> valuable materials, and helps reduce<br />
the pollution and energy use tied to the production <strong>of</strong> new electronics.<br />
The U.S. EPA estimates that consumer electronics-- including TVs, computers, audio equipment and phones-- make<br />
up nearly 2 percent <strong>of</strong> the municipal waste stream. Assuming consumer electronics make up nearly 2 percent <strong>of</strong> the<br />
municipal waste stream annually, it is estimated that more than 5,800 tons <strong>of</strong> consumer electronics are present in<br />
Champaign County’s municipal waste stream. The amount <strong>of</strong> electronic scrap collected at the county-wide collection<br />
events held during 2010 totaled 291 tons, and represents a small fraction <strong>of</strong> the overall municipal waste stream in<br />
Champaign County that was reported to the Illinois EPA that year. Since January 1, 2012, Illinois Public Act 97-0287<br />
has banned 17 electronic items from Illinois landfills, including televisions, computers and printers. The diversion <strong>of</strong><br />
electronics from Illinois landfills will help prevent heavy metals and other toxic materials from contaminating soil and<br />
groundwater with proper recycling and reuse.<br />
Tons<br />
300<br />
250<br />
200<br />
291<br />
207<br />
5,864 Tons<br />
Municipal Waste<br />
150<br />
100<br />
50<br />
36<br />
68<br />
60<br />
Electronics in<br />
Waste Stream<br />
at 2%<br />
0<br />
2007 2008 2009 2010 2011<br />
Figure 3. Champaign County Electronics Recycled (2007-2011)<br />
Figure 4. Champaign County Municipal Waste Stream<br />
(2010)<br />
Future U-CYCLE Goals:<br />
• Set an <strong>of</strong>ficial recycling rate goal (e.g. 50 percent by 2025);<br />
• Increase multifamily recycling rates through increased outreach and education efforts;<br />
• Develop a pilot program for food-scrap composting. Explore strategies to fund food-scrap collection costs.<br />
Food waste accounts for 14 percent <strong>of</strong> landfill space (U.S. EPA, 2010); and is the next step in diverting materials<br />
from the municipal waste stream.<br />
• Develop a permanent Hazardous Household Waste (HHW) drop-<strong>of</strong>f facility in Champaign County with<br />
coordination from Champaign County and county-wide municipalities<br />
Landscape Recycling Center:<br />
Yard debris accounts for 25 percent <strong>of</strong> all waste in Illinois. The Landscape Recycling Center (LRC), operated by the <strong>City</strong><br />
<strong>of</strong> <strong>Urbana</strong> Public Works Department is a non-pr<strong>of</strong>it operating facility providing landscape recycling facilities to <strong>Urbana</strong>-<br />
Champaign and all <strong>of</strong> Champaign County. At the LRC, grass clippings, and brush and plant cuttings are converted into<br />
fertile mulches and composts specially produced to benefit certain types <strong>of</strong> plants.<br />
<strong>City</strong> <strong>of</strong> <strong>Urbana</strong><br />
30
1.10 CURRENT <strong>ACTION</strong>S<br />
C. UNIVERSITY OF ILLINOIS <strong>ACTION</strong>S<br />
Carbon Neutral by 2050:<br />
The University <strong>of</strong> Illinois Climate Action Plan (iCAP) outlines strategies and initiatives for meeting the University’s<br />
obligations to the American College and University President’s Climate Commitment (ACUPCC). The University’s Baseline<br />
Emissions Inventory was conducted for the year 2008. Based on the 2008 baseline data and the scenario strategies<br />
developed by the University, the University’s over-arching goal is to become carbon neutral by 2050.<br />
The total campus emissions inventory for fiscal year 2008 (the baseline year) was 570,000 Metric Ton Equivalent<br />
(MtCO 2<br />
e) <strong>of</strong> carbon dioxide (CO 2<br />
). Approximately 85 percent <strong>of</strong> these emissions are a direct result <strong>of</strong> the need to heat,<br />
cool, and operate campus buildings. Most <strong>of</strong> the energy produced for building operations comes from the combustion<br />
<strong>of</strong> coal and natural gas at Abbott Power Plant and the rest through purchases <strong>of</strong> electricity from outside sources.<br />
Other emission sources on campus are found in transportation systems and patterns (commuting, fleet, and air-travel),<br />
agricultural emissions from the south farms, water use, solid waste, and other fugitive sources.<br />
University Strategies:<br />
The University <strong>of</strong> Illinois Climate Action Plan (iCAP) outlines strategies and initiatives for conserving energy; reducing<br />
coal dependence at the Abbott Power Plant by emphasizing a larger role for natural gas in the near term; moving<br />
to renewable energy sources including meeting the State <strong>of</strong> Illinois’ Renewable Portfolio Standards <strong>of</strong> a 25 percent<br />
contribution from renewable energy by 2025; implementing the Campus Bicycle Master Plan and improving bicycling<br />
infrastructure; and creating and subsidizing a bike share program and a voluntary carbon registry program to <strong>of</strong>fset air<br />
travel impacts. The plan also sets out strategies for reducing emissions related to agriculture by 50 percent by 2020,<br />
including the installation <strong>of</strong> a methane capture process, incentivizing sustainable and organic agriculture practices<br />
on campus lands, implementing a bio-fuels initiative to transform agricultural waste into energy, a large scale food<br />
composting project, and several other strategies to meet reduction targets.<br />
The University plan also outlines strategies to conserve potable water and reduce related emissions by 40 percent by<br />
2025; incorporate a no-net increase in space policy for the entire campus; and require all new buildings and major<br />
renovations to be net energy neutral or a net energy provider by 2025. In terms <strong>of</strong> waste, the University plans to develop<br />
a long-term Zero Waste campus policy and increase waste diversion by 75 percent by 2020. The establishment and use<br />
<strong>of</strong> a local carbon registry for purchasing local carbon <strong>of</strong>fsets and implementing a sustainable landscape plan are proposed<br />
strategies to enhance carbon sequestration processes. The iCAP can be accessed online through the University’s Office<br />
<strong>of</strong> Sustainability at http://sustainability.illinois.edu/.<br />
Figure 5. 2008 University <strong>of</strong> Illinois Carbon Inventory: Baseline Campus Footprint by GHG Emissions Contributors<br />
Source: Reproduced from the UIUC Climate Action Plan (iCAP)<br />
<strong>City</strong> <strong>of</strong> <strong>Urbana</strong><br />
31
1.10 CURRENT <strong>ACTION</strong>S<br />
D. CITY OF URBANA <strong>ACTION</strong>S<br />
2005<br />
COMPREHENSIVE <strong>PLAN</strong>:<br />
The <strong>City</strong> <strong>of</strong> <strong>Urbana</strong> enacts the 2005<br />
Comprehensive Plan, updating its <strong>of</strong>ficial<br />
land use and development policies for<br />
the city and extra- territorial planning<br />
jurisdiction. A key plan concept is<br />
compact and contiguous growth and<br />
development. In 2006, the plan won a<br />
Gold Award from the American Planning<br />
Association<br />
Illinois Chapter.<br />
MAYOR AND CITY COUNCIL<br />
SUSTAINABILITY GOALS:<br />
The <strong>City</strong> Council specified<br />
sustainability- related measures among<br />
its common goals. Goals included energy<br />
conservation.<br />
2007<br />
URBANA COMMITS TO THE<br />
U.S. MAYORS <strong>CLIMATE</strong><br />
PROTECTION PLEDGE<br />
Mayor Prussing signed the U.S. Mayors<br />
Climate Protection Agreement,<br />
pledging the city to strive to meet or<br />
beat Kyoto Protocol targets for reducing<br />
greenhouse gas emissions in our<br />
community.<br />
The Kyoto Protocol calls for U.S.<br />
emissions to fall 7% below 1990 levels<br />
by 2012.<br />
2008<br />
URBANA SUSTAINABILITY<br />
ADVISORY COMMISSION<br />
The Mayor and <strong>City</strong> Council created a<br />
Sustainability Advisory Commission<br />
(SAC). The Commission, composed<br />
<strong>of</strong> seven appointed community<br />
members, was initially tasked with<br />
identifying and recommending to<br />
the Mayor and <strong>City</strong> Council goals to<br />
achieve sustainable management <strong>of</strong><br />
natural resources, water and energy<br />
in particular. The Commission’s chief<br />
objective has been the development<br />
<strong>of</strong> a Climate Action Plan to meet the<br />
energy-related dimension <strong>of</strong> this<br />
mandate.<br />
SUSTAINABLE DEVELOPMENT<br />
The <strong>City</strong> helped fund redevelopment <strong>of</strong><br />
Lakeside Terrace Housing Project as<br />
Crystal Lake Townhomes, an affordable<br />
housing project with substantial energy<br />
saving features such as enhanced<br />
insulation, geothermal heating and cool,<br />
photo-voltaic panels on the community<br />
center, LED street lights, and bio-swale<br />
stormwater management.<br />
URBANA ADOPTS BICYCLE<br />
MASTER <strong>PLAN</strong><br />
The <strong>City</strong> <strong>of</strong> <strong>Urbana</strong> developed a Bicycle<br />
Master Plan with three goals: 1) To<br />
increase bicycle mode share in <strong>Urbana</strong><br />
for all trip purposes by 50% in the next<br />
five years; 2) To achieve a Bicycle<br />
Friendly Community award through the<br />
League <strong>of</strong> American Bicyclists; and<br />
3) To substantially expand the bicycle<br />
network.<br />
URBANA SUPPORTS ZIP CAR<br />
SHARING PROGRAM<br />
<strong>City</strong> <strong>of</strong> <strong>Urbana</strong> provided a financial<br />
guarantee to enable establishment<br />
<strong>of</strong> the ZIP Car Sharing program in<br />
<strong>Urbana</strong>-Champaign.<br />
2009<br />
URBANA ADOPTS ENERGY<br />
EFFICIENT OUTDOOR LIGHTING<br />
STANDARDS<br />
<strong>City</strong>-wide outdoor lighting standards<br />
were enacted through a Zoning Ordinance<br />
amendment.<br />
URBANA RECEIVES FEDERAL<br />
ENERGY EFFICIENCY GRANT<br />
The <strong>City</strong> applied for and received a<br />
Federal Energy Efficiency Community<br />
Block Grant, which was used for:<br />
municipal building lighting retr<strong>of</strong>its; a<br />
white reflective ro<strong>of</strong> over a portion <strong>of</strong> the<br />
<strong>City</strong> Building; a partnership with Ameren’s<br />
Act On Energy program to pay for home<br />
energy audits, shell improvements<br />
(insulation and air sealing); and<br />
installation <strong>of</strong> compact fluorescent bulbs,<br />
sink aerators, low-flow shower heads,<br />
and pipe insulation.<br />
SUSTAINABLE TRANSPORTATION<br />
The <strong>City</strong> endorsed the Champaign-<strong>Urbana</strong><br />
Urbanized Area Transportation Study<br />
(CUUATS) Long Range Transportation<br />
Plan 2035 which includes a significant<br />
focus on reducing automotive trips.<br />
KEY CITY STAFF GREEN<br />
BUILDING QUALIFIED<br />
The <strong>City</strong> became a member <strong>of</strong> the U.S.<br />
Green Building Council and key personnel<br />
reviewing site and building plans became<br />
LEED-accredited (Leadership in Energy<br />
and Environmental Design).<br />
<strong>City</strong> <strong>of</strong> <strong>Urbana</strong><br />
32
1.10 CURRENT <strong>ACTION</strong>S<br />
2010<br />
ENVIRONMENTAL<br />
SUSTAINABILITY A MAYORAL<br />
AND COUNCIL GOAL<br />
New <strong>City</strong> Council and Mayoral Goals<br />
are adopted. Goals across six broad<br />
categories are established, including<br />
“Environmental Sustainability” which<br />
contains 12 distinct strategies.<br />
Development <strong>of</strong> a Climate Action<br />
Plan is included as an Environmental<br />
Sustainability strategy.<br />
BICYCLE FRIENDLY COMMUNITY<br />
The League <strong>of</strong> American Bicyclists<br />
designates <strong>Urbana</strong> as a Bicycle Friendly<br />
Community at the Bronze level.<br />
BIKE TO WORK DAY<br />
The <strong>City</strong> <strong>of</strong> <strong>Urbana</strong> cosponsors the<br />
first Champaign-<strong>Urbana</strong> Bike to Work<br />
Day which had over 700 registered<br />
participants.<br />
ENVIRONMENTAL<br />
SUSTAINABILITY MANAGER<br />
The long-standing <strong>City</strong> staff position <strong>of</strong><br />
Environmental Manager was changed to<br />
Environmental Sustainability Manager.<br />
Duties were added to the position,<br />
including oversight <strong>of</strong> climate action/<br />
sustainability plan development and<br />
implementation.<br />
ZONING FOR WIND TURBINES<br />
Enacted zoning standards to allow wind<br />
turbines throughout the <strong>City</strong> <strong>of</strong> <strong>Urbana</strong><br />
and within 1.5 miles <strong>of</strong> the <strong>City</strong> limits.<br />
BICYCLING SAFETY EDUCATION<br />
The <strong>City</strong> cosponsors ‘C-U Sharing the<br />
Road’, a bicycle education video that<br />
introduces the public to the bicycle<br />
infrastructure that is being installed as<br />
a result <strong>of</strong> the Bicycle Master Plan and<br />
teaches motorists and bicyclists how to<br />
interact with each other on the road.<br />
The <strong>City</strong> begins cosponsoring periodic<br />
bike rodeos and other bicycle safety<br />
and education clinics to encourage<br />
bicycling for transportation.<br />
2011<br />
INFILL DEVELOPMENT<br />
The White Street and Springfield<br />
Avenue Corridors Analysis Report was<br />
presented to the <strong>Urbana</strong> <strong>City</strong> Council.<br />
The report presents a concept for<br />
achieving green infill development linked<br />
with non-automotive transportation<br />
choices.<br />
BICYCLE INFRASTRUCTURE<br />
AUDIT The <strong>City</strong> and the League <strong>of</strong><br />
Illinois Bicyclists participated in a<br />
voluntary audit <strong>of</strong> recent <strong>City</strong> Public<br />
Works projects.<br />
COMPLETE STREETS Adopted a<br />
Complete Streets amendment to the<br />
2005 Comprehensive Plan.<br />
REDUCED PARKING<br />
REQUIREMENTS 50 percent<br />
reduction in the minimum parking<br />
requirements in the <strong>Urbana</strong> Zoning<br />
Ordinance for new residential<br />
developments in the CCD (Campus<br />
Commercial District) zoning district.<br />
KERR AVENUE MODEL<br />
SUSTAINABLE COMMUNITY<br />
DEVELOPMENT<br />
To accomplish the Council and Mayoral<br />
goal <strong>of</strong> promoting sustainable, affordable<br />
housing development the <strong>City</strong> issued<br />
a request for proposals and ultimately<br />
selected a proposal to construct 24<br />
single-family affordable rental units<br />
and ten single-family home-buyer<br />
units to be sold to eligible low-income<br />
buyers on a <strong>City</strong> donated 3.1 acre<br />
site just north <strong>of</strong> downtown <strong>Urbana</strong>.<br />
The proposal includes rain-gardens<br />
and bioswales, solar powered site<br />
lighting, site-wide geothermal heating,<br />
native landscaping, high-performance<br />
building shells, permeable paving<br />
throughout the site and photovoltaic<br />
panels for water heating. The project<br />
is to be funded through Low Income<br />
Housing Tax Credits through the Illinois<br />
Housing Development Authority and is<br />
to be supported by the <strong>City</strong> through its<br />
federal Home Investment Partnerships<br />
Program dollars, as well as funding from<br />
its Tax Increment Financing (TIF) district.<br />
2012<br />
COMMERCIAL RECYCLING<br />
ORDINANCE<br />
<strong>City</strong> adopts an ordinance that requires<br />
all licensed <strong>Urbana</strong> commercial<br />
and business hauling services to<br />
<strong>of</strong>fer businesses the opportunity to<br />
recycle through them or through a<br />
sub-contractor. UCycle staff available<br />
to conduct waste audits and assist<br />
businesses with recycling questions.<br />
MUNICIPAL ELECTRIC<br />
AGGREGATION<br />
100% RENEWABLE ENERGY<br />
<strong>Urbana</strong> voters overwhelmingly approved<br />
referendum authorizing municipal<br />
electric aggregation, which allows<br />
the <strong>City</strong> to bundle – or aggregate –<br />
residential and small commercial retail<br />
electric accounts and seek bids for<br />
cheaper power.<br />
Mayor Laurel Prussing signed a twoyear<br />
contract with Homefield Energy <strong>of</strong><br />
Collinsville, that includes 100 percent<br />
renewable power and up to 36 percent<br />
savings on the electric supply portion <strong>of</strong><br />
residents’ power bills.<br />
URBANA <strong>CLIMATE</strong> <strong>ACTION</strong><br />
<strong>PLAN</strong> PHASE 1<br />
The <strong>City</strong> <strong>of</strong> <strong>Urbana</strong> adopts the Phase 1<br />
Climate Action Plan which inventories<br />
<strong>Urbana</strong>’s 2007 baseline greenhouse<br />
gas emissions, and sets a communitywide<br />
emissions reduction target <strong>of</strong> 25<br />
percent below 2007 levels by 2020<br />
and an 80 percent reduction below<br />
2007 levels by 2050. Recommended<br />
community-wide actions focus on initial<br />
strategies to reduce greenhouse gas<br />
emissions related to the four largest<br />
emissions sectors, namely residential<br />
natural gas and electricity consumption,<br />
commercial electricity consumption and<br />
transportation gasoline consumption.<br />
<strong>City</strong> <strong>of</strong> <strong>Urbana</strong><br />
33
2. METHODOLOGY,<br />
INVENTORY,<br />
& PROJECTIONS<br />
The “Share the Road Bus”, a part <strong>of</strong> a multi-year partnership between<br />
Champaign County Bikes, The Bike Project and the CUMTD that promoted<br />
environmentally-positive activities.<br />
<strong>City</strong> <strong>of</strong> <strong>Urbana</strong><br />
35
2.1<br />
OVERVIEW<br />
A. CALCULATION MODELS<br />
In signing the U.S. Mayors Climate Protection Agreement in 2007, Mayor Prussing<br />
signalled the <strong>City</strong>’s intent to meet or beat Kyoto Protocol targets for reducing the<br />
community’s greenhouse gas emissions footprint. The <strong>City</strong> is a member <strong>of</strong> the<br />
International Council for Local Environmental Initiatives’ (ICLEI) Cities for Climate<br />
Protection® (CCP) campaign. ICLEI works in conjunction with the U.S. Conference <strong>of</strong><br />
Mayors to track progress and implementation <strong>of</strong> the U.S. Mayors Climate Protection<br />
Agreement.<br />
ICLEI’s Cities for Climate Protection® campaign recommends a five-step process for<br />
inventorying and reducing a community’s greenhouse gas emissions (Figure. 6).<br />
Greenhouse gases are accounted and reported as per a community-scale greenhouse<br />
gas emissions and reporting protocol produced by ICLEI which ensures measurability,<br />
accuracy and reliability. The protocol is specifically designed to be implemented at<br />
a reasonable cost, and produce inventories that can be used to show trends over<br />
time. Each <strong>of</strong> the 650 member local governments <strong>of</strong> the Cities for Climate Protection<br />
Program utilizes the emissions reporting protocol ensuring a consistent methodology<br />
for calculating greenhouse gas emissions and allowing for comparisons between<br />
communities.<br />
The ICLEI protocol articulates standardized emissions factors that are used to convert<br />
activity data, like energy usage, into associated greenhouse gas emissions using<br />
greenhouse gas emissions factors (Appendix E). The <strong>City</strong> <strong>of</strong> <strong>Urbana</strong> conducted <strong>Urbana</strong>’s<br />
greenhouse gas baseline emissions inventory with assistance <strong>of</strong> the Clean Air and Climate<br />
Protection S<strong>of</strong>tware (CACP) and the Climate and Air Pollution Planning Assistant (CAPPA)<br />
- the recommended s<strong>of</strong>tware to be used along with the protocol to measure and track<br />
the community’s greenhouse gas emissions.<br />
The purpose <strong>of</strong> the baseline emissions inventory is to determine the levels <strong>of</strong> greenhouse<br />
gas emissions that <strong>Urbana</strong> was responsible for in its baseline year. Once completed, the<br />
inventory provides a basis for creating an emissions forecast and setting a reduction<br />
target. The CAPPA s<strong>of</strong>tware enables the quantification <strong>of</strong> emissions reductions associated<br />
with implemented and proposed measures. This information enabled the <strong>City</strong> to prioritize<br />
implementation measures as per their respective suitability for <strong>Urbana</strong>.<br />
Many other U.S. cities use 1990 as their baseline year, as called for in the U.S. Mayors<br />
Climate Protection Agreement. Because the <strong>City</strong> <strong>of</strong> <strong>Urbana</strong> lacks access to reliable data<br />
extending back before 2007, the Sustainability Advisory Commission chose 2007 as the<br />
baseline year. <strong>Urbana</strong>’s emissions inventory considers emissions from the following major<br />
sectors:<br />
i. Residential, commercial and industrial building energy consumption;<br />
ii. Transportation fuel consumption;<br />
iii. Solid waste decomposition.<br />
Even though the electricity used by <strong>Urbana</strong> residents is produced elsewhere, the<br />
emissions associated with it appear in <strong>Urbana</strong>’s inventory. This is standard emissions<br />
accounting procedure for assigning emissions resulting from energy production.<br />
KEY ACRONYMS<br />
ICLEI<br />
International Council<br />
for Local Environmental<br />
Initiatives<br />
CCP<br />
Cities for Climate<br />
Protection Campaign<br />
CACP<br />
Clear Air and Climate<br />
Protection S<strong>of</strong>tware<br />
CAPPA<br />
Climate and Air Pollution<br />
Planning Assistant<br />
www.icleiusa.org<br />
1. Conduct a baseline<br />
emissions inventory and<br />
develop an emissions<br />
forecast.<br />
2. Setting an emissions<br />
reduction target.<br />
3. Developing an action<br />
plan to meet the target.<br />
4. Implement actions in<br />
the plan.<br />
5. Monitor and verify<br />
emissions reduction<br />
progress.<br />
Figure 6.<br />
ICLEI and CCP’s 5 step GHG<br />
Reduction Process<br />
<strong>City</strong> <strong>of</strong> <strong>Urbana</strong><br />
36
2.1<br />
OVERVIEW<br />
B. UNIVERSITY OF ILLINOIS EMISSIONS<br />
University buildings have unique and large energy requirements, and University-owned housing has some <strong>of</strong> the highest<br />
residential densities in <strong>Urbana</strong>. Furthermore, University students use several facilities and services <strong>of</strong>fered by the <strong>City</strong>.<br />
Recognizing the complex overlaps between the <strong>City</strong>’s and the University’s energy consumption sectors, the <strong>City</strong> <strong>of</strong><br />
<strong>Urbana</strong> seeks to closely coordinate climate action initiatives with the Office <strong>of</strong> Sustainability at the University <strong>of</strong> Illinois.<br />
i. Electricity and natural gas consumption data <strong>of</strong> University <strong>of</strong> Illinois buildings in <strong>Urbana</strong> are not included in<br />
the <strong>City</strong> <strong>of</strong> <strong>Urbana</strong> Phase I baseline inventory, as the emissions resulting from the sources <strong>of</strong> this energy and<br />
University activities in these buildings are accounted for in the University’s Climate Action Plan (iCAP). See page<br />
31 for a detailed breakdown <strong>of</strong> University emissions and a description <strong>of</strong> the actions the University is taking to<br />
mitigate emissions related to University energy use.<br />
ii.<br />
Emissions related to the University transportation and the solid waste sectors are included in the <strong>Urbana</strong> Climate<br />
Action Plan baseline inventory, as services <strong>of</strong>fered by the <strong>City</strong> and other non-university jurisdictions, such<br />
as improved sustainable transportation infrastructure and higher recycling rates can positively impact emissions<br />
related to these sectors.<br />
C. SOURCES OF DATA<br />
An inventory <strong>of</strong> greenhouse gas emissions requires the collection <strong>of</strong> energy consumption data from a variety <strong>of</strong> sectors<br />
and sources as described below.<br />
Building Energy:<br />
• Community-wide electricity and natural gas consumption data was sourced from Ameren Illinois Utilities.<br />
• Data from Ameren is based on account type. Depending on the number <strong>of</strong> units in a building and whether<br />
they are separately metered, a residential rental property may have a residential or commercial account. Data<br />
for the commercial sector therefore include both residential and commercial properties. Similarly, emissions<br />
data for residential rentals may fall into either the commercial or residential categories used in this plan.<br />
• University <strong>of</strong> Illinois building energy consumption is not included in the <strong>City</strong> <strong>of</strong> <strong>Urbana</strong> Climate Action Plan as the<br />
emissions from the sources <strong>of</strong> this energy are accounted for in the University’s Climate Action Plan.<br />
Transportation:<br />
• The Champaign <strong>Urbana</strong> Urbanized Area Transportation Study (CUUATS) served as the source <strong>of</strong> transportation<br />
data.<br />
• Emissions related to transportation on the UIUC campus are included in this emissions inventory.<br />
Solid Waste:<br />
• Solid waste data was developed based on population estimates, recycling data gathered by <strong>City</strong> <strong>of</strong>ficials, and<br />
information on waste generation rates from the Illinois Department <strong>of</strong> Commerce and Economic Opportunity’s<br />
2009 publication “Illinois Commodity / Waste Generation and Characterization Study.”<br />
• Emissions related to waste generated on the UIUC campus are included in this emissions inventory.<br />
<strong>City</strong> <strong>of</strong> <strong>Urbana</strong><br />
37
2.1<br />
OVERVIEW<br />
D. GROWTH FORECASTS FOR THE URBANA <strong>CLIMATE</strong> <strong>ACTION</strong> <strong>PLAN</strong> 1<br />
The Clean Air and Climate Protection s<strong>of</strong>tware (CACP) requires a compound annual growth rate (CAGR) for population,<br />
employment and vehicle miles travelled in the community for the baseline year and the projection year, in order to<br />
model the current and future emissions inventory. The following assumptions and growth rates were used to forecast<br />
emissions to 2020.<br />
Population:<br />
Population estimates for the baseline year 2007 and the forecast year 2020 were derived from data and growth rates<br />
based on U.S. Census data for the years 2000 and 2010; and Champaign County Regional Planning Commission’s (CCRPC)<br />
growth projections for 2015 and 2025. As per U.S. Census data, the <strong>City</strong> <strong>of</strong> <strong>Urbana</strong>’s population in 2000 was 36,395 and<br />
in 2010 was 41,250 with a CAGR <strong>of</strong> 1.26 percent. Applying this growth rate to the 2000 Census data, <strong>Urbana</strong>’s population<br />
in 2007 was approximately 39,700. Deducting the 5,600 University <strong>of</strong> Illinois student housing residents in <strong>Urbana</strong><br />
gives us a 2007 net population figure <strong>of</strong> 34,100. To derive the 2020 population estimate <strong>of</strong> 42,500 a 1.8 percent CAGR<br />
was applied for 2007-2015 and a 0.96 percent CAGR was applied for the period between 2016-2020, based on CCRPC<br />
projections for <strong>Urbana</strong> Traffic Analysis Zone growth rate. Overall, the CAGR for the period between 2007 and 2020 is<br />
1.48 percent.<br />
Employment:<br />
The Champaign <strong>Urbana</strong> Urbanized Area Transportation Study (CUUATS) completed population and employment<br />
projections for the Champaign <strong>Urbana</strong> Urbanized Area as part <strong>of</strong> the Long Range Transportation Plan (LRTP) 2035<br />
adopted in 2009. Based on CUUATS commercial and industrial employment numbers for 2007 and projections for 2020,<br />
a commercial employment compound annual growth rate (CAGR) <strong>of</strong> 2.71 percent and an industrial employment CAGR <strong>of</strong><br />
1.84 percent was used to calculate emissions projections from these sectors in 2020.<br />
Vehicle Miles Travelled (VMT):<br />
Based on population and employment projections, the CCRPC models daily Vehicle Miles Travelled using the CUUATS<br />
Travel Demand Model. For 2005, the annual VMT for <strong>Urbana</strong> was 179,200,000. As per the CUUATS, daily VMT are<br />
projected to increase at a CAGR <strong>of</strong> 3.02 percent between 2005 and 2015. Since these projections apply to the <strong>Urbana</strong><br />
Traffic Analysis Zone (TAZ) which is larger than the <strong>City</strong> <strong>of</strong> <strong>Urbana</strong>, the <strong>City</strong> has taken a conservative approach to<br />
VMT increase beyond 2015 and the 3.02 percent CAGR was used for the entirety <strong>of</strong> the 2007-2020 planning period.<br />
Therefore, the 2020 projected annual VMT for the <strong>City</strong> <strong>of</strong> <strong>Urbana</strong> is 280,002,035.<br />
1<br />
For a complete breakdown <strong>of</strong> growth forecasts, please refer to Appendix F.<br />
<strong>City</strong> <strong>of</strong> <strong>Urbana</strong><br />
38
2.2<br />
BASELINE INVENTORY<br />
A. 2007 EMISSIONS BY SECTOR<br />
The 2007 <strong>City</strong> <strong>of</strong> <strong>Urbana</strong> greenhouse gas inventory measures emissions from five sectors. Emissions related to the<br />
energy used in University <strong>of</strong> Illinois buildings are not reflected in the <strong>City</strong>’s inventory as these are accounted for in the<br />
University’s Climate Action Plan. Emissions related to transportation and solid waste generated on the UIUC campus are<br />
included in this emissions inventory. Please refer to page 37 for a detailed explanation.<br />
The residential, commercial, and industrial sectors in Table 1 represent emissions related to:<br />
• Electricity and natural gas used in both private and public sector buildings and facilities served by Ameren Illinois.<br />
• The transportation sector represents emissions related to the burning <strong>of</strong> fossil fuels to propel all forms <strong>of</strong><br />
vehicles and equipment.<br />
• The waste sector represents the greenhouse gas emissions that result from the degradation <strong>of</strong> solid waste<br />
disposed in landfills.<br />
TABLE 1. URBANA’S 2007 BASELINE COMMUNITY GREENHOUSE GAS EMISSIONS REPORT BY SECTOR<br />
IN METRIC TONS CO 2<br />
EQUIVALENT 1<br />
Sector Quantity 2<br />
Residential energy used 135,900<br />
Commercial energy used 156,200<br />
Industrial energy used 118,100<br />
Transportation energy used 110,400<br />
Solid waste disposed in landfills 28,100<br />
Total 548,700<br />
Non-Campus Population in 2007 3 34,100<br />
Per Capita Greenhouse Gas Emissions in 2007 4<br />
16 MT/Resident<br />
Notes:<br />
1<br />
Estimates were calculated using ICLEI’s CACP s<strong>of</strong>tware.<br />
2<br />
Quantities have been rounded to the nearest hundred, except as noted.<br />
3<br />
The <strong>City</strong> <strong>of</strong> <strong>Urbana</strong> population figure is estimated from 2000 and 2010 Census Data. University <strong>of</strong> Illinois on-campus student resident<br />
population is not included in calculating per capita emissions noted above.<br />
4<br />
Per-capita emissions have been rounded to the nearest whole number.<br />
B. 2007 EMISSIONS BY SOURCE:<br />
Plant Debris<br />
and Textiles<br />
Food Waste<br />
Diesel<br />
per Products<br />
Gasoline<br />
Natural Gas<br />
Electricity<br />
plant debris 0.04 %<br />
wood and textiles 0.4 %<br />
food waste 0.95 %<br />
diesel 3 %<br />
paper products 4 %<br />
gasoline 17 %<br />
natural gas 17 %<br />
electricity 58 %<br />
Figure 7. <strong>Urbana</strong>’s 2007 Baseline<br />
Community Greenhouse Gas Emissions<br />
Report by Source<br />
Note: Estimates were calculated using ICLEI’s<br />
CACP s<strong>of</strong>tware.<br />
0% 10% 20% 30% 40% 50% 60% 70%<br />
Series1<br />
<strong>City</strong> <strong>of</strong> <strong>Urbana</strong><br />
39
2.2 BASELINE INVENTORY<br />
C. GREENHOUSE GAS EMISSIONS RELATED TO PAPER PRODUCTS, FOOD WASTE, WOOD, TEXTILES<br />
AND <strong>PLAN</strong>T DEBRIS<br />
Waste prevention and recycling are jointly referred to as waste reduction. Preventing waste and recycling are potent<br />
strategies for reducing greenhouse gas emissions. Waste and greenhouse gas emissions are related in different ways<br />
through the life cycle <strong>of</strong> a product from production to decomposition. At the most basic level, all commodities from food<br />
to paper to any type <strong>of</strong> consumer good and related packaging take energy to produce. Producing this energy results in<br />
greenhouse gas emissions. When products are thrown away, in effect, this energy is being thrown away. In the case <strong>of</strong><br />
paper products in addition to the energy required to produce them, there is also a negative impact resulting from cutting<br />
down trees needed to make paper products. When organic products like food, wood, textiles and plant debris are put<br />
in a landfill and buried, they break down in a way that causes emissions <strong>of</strong> methane gas from the landfill. Methane is<br />
twenty-one times more powerful a greenhouse gas than carbon dioxide.<br />
Together, waste prevention and recycling help:<br />
1. Reduce emissions from energy consumption:<br />
Manufacturing products from recycled materials typically requires less energy than producing goods from virgin raw<br />
materials. Waste prevention is even more effective. By reusing things or using products made with less material, less<br />
energy is needed to extract, transport, and process raw materials and to manufacture products. When energy demands<br />
reduce, fewer fossil fuels are burned and less carbon dioxide is emitted to the atmosphere.<br />
2. Reduce emissions from incinerators:<br />
Recycling and waste prevention allows materials to be diverted from incinerators and therefore reduces greenhouse gas<br />
emissions from waste combustion.<br />
3. Reduce methane emissions from landfills:<br />
Waste recycling (including composting) and prevention diverts organic waste from landfills, reducing methane released<br />
when these materials decompose.<br />
4. Increase storage <strong>of</strong> carbon in trees:<br />
Trees absorb carbon dioxide from the atmosphere and store it in wood, in a process called “carbon sequestration”. Waste<br />
prevention and recycling paper reduces the extent <strong>of</strong> deforestation needed for paper production.<br />
UCycle Recycling Workshop<br />
<strong>City</strong> <strong>of</strong> <strong>Urbana</strong><br />
40
2.2 BASELINE INVENTORY<br />
D. COMPARING URBANA’S PER CAPITA COMMERCIAL AND RESIDENTIAL BUILDING AND TRANSPORTATION<br />
SECTOR EMISSIONS WITH CITIES NATION-WIDE<br />
As per a study published in 2011, <strong>Urbana</strong>’s cumulative commercial, residential and transportation per capita<br />
greenhouse gas emissions in 2007 are comparable to the 2008 national average. 1 Cities with a smaller per<br />
capita greenhouse gas emissions footprint for these sectors include Bloomington, Indiana; Eugene, Oregon; and<br />
Burlington, Vermont. Per capita commercial, residential and transportation emissions are related to the density<br />
<strong>of</strong> the urban environment, signifying the importance <strong>of</strong> infill and transit-oriented development. Figure 8 shows<br />
<strong>Urbana</strong>’s ranking in a national context.<br />
MT CO 2<br />
e per Capita Per Year<br />
25<br />
20<br />
15<br />
10<br />
5<br />
U.S. Average in 2008: Approximately 13 MT CO 2<br />
e per<br />
Capita per Year<br />
<strong>Urbana</strong> Non-Campus Average in 2007: Approximate<br />
12 MT CO 2<br />
e per Capita per Year*<br />
* Excludes on-campus student population and emissions<br />
related to industrial and waste sectors.<br />
Commercial Emissions<br />
Residential Emissions<br />
Transportation Emissions<br />
0<br />
Durham, NC<br />
Pittsburgh, PA<br />
Flagstaff, AZ<br />
Nashville, TN<br />
Seattle, WA<br />
New Orleans, LA<br />
Kansas <strong>City</strong>, MO<br />
Madison, WI<br />
Austin, TX<br />
Portland, OR<br />
U.S.A. AVG 2008<br />
Study AVG<br />
Bloomington, IN<br />
San Diego, CA<br />
Eugene, OR<br />
Burlington, VT<br />
Philadelphia, PA<br />
San Francisco, CA<br />
Berkeley, CA<br />
New York, NY<br />
<strong>Urbana</strong>, IL<br />
Figure 8. Community Greenhouse Gas Emissions Per Capita for <strong>Urbana</strong> and 19 U.S. Cities as Compared to the U.S.<br />
Average, Excluding Industrial and Waste Sector Emissions 1,2,3,4<br />
Notes:<br />
1<br />
Source: Blackhurst et al, 2011. Preparing US community greenhouse gas inventories for climate action plans, Environ. Res. Lett. 6<br />
(July-September 2011) 034003 doi:10.1088/1748-9326/6/3/034003 http://iopscience.iop.org/1748-9326/6/3/034003/fulltext/.<br />
2<br />
Graphic is modified to include 2007 data for <strong>Urbana</strong>, Illinois.<br />
3<br />
This study excluded industrial and waste sector emissions except for Flagstaff AZ, whose industrial emissions from natural gas use<br />
are included in the commercial sector due to utility metering practices. Industrial emissions are more difficult to generalize and<br />
compare as they stem from facility operations and process fugitive emissions and thus vary by facility.<br />
4<br />
In the pr<strong>of</strong>iled cities, industrial emissions accounted for an average <strong>of</strong> 10 percent <strong>of</strong> local emissions, varying from 3 percent to<br />
30 percent. As per the U.S. E.P.A, emissions from solid waste management account for approximately 2 percent <strong>of</strong> GHG emissions<br />
nationally. In 2007, <strong>Urbana</strong>’s industrial sector was responsible for approximately 21 percent <strong>of</strong> <strong>Urbana</strong>’s total emissions, and the<br />
solid waste sector was responsible for approximately 5 percent <strong>of</strong> <strong>Urbana</strong>’s total emissions.<br />
<strong>City</strong> <strong>of</strong> <strong>Urbana</strong><br />
41
2.3<br />
EMISSIONS FORECAST<br />
The <strong>Urbana</strong> Sustainability Advisory Commission chose to focus <strong>Urbana</strong>’s initial planning efforts on reducing emissions by<br />
the year 2020. A forecast for 2020 emissions was developed using ICLEI’s CACP s<strong>of</strong>tware. The projected 2020 emissions<br />
are a business-as-usual forecast. The business-as-usual forecast is a depiction <strong>of</strong> the future consequences <strong>of</strong> continuing<br />
current trends in population, economy, urban development, technology and human behavior with respect to energy<br />
consumption. A business as usual forecast allows planners to estimate how emissions in the future might increase or<br />
decrease, and therefore identify the most appropriate greenhouse gas reduction strategies to help the community<br />
achieve its long-range emissions reductions goals. CACP allows for input <strong>of</strong> projected increases or decreases in various<br />
factors over the planning horizon. The 2020 emissions projections were developed utilizing data from the same sources<br />
used to develop the 2007 baseline and with growth rates developed by <strong>City</strong> staff and the Champaign County Regional<br />
Planning Commission (CCRPC).<br />
The projected figure is significantly higher than the 2007 baseline because as the population <strong>of</strong> the city grows, so does<br />
energy consumption, both in the residential and commercial sectors.<br />
TABLE 2. URBANA’S 2020 PROJECTED COMMUNITY GREENHOUSE GAS INVENTORY COMPARED<br />
WITH THE 2007 BASELINE INVENTORY (IN METRIC TONS CO 2<br />
EQUIVALENT) 1<br />
Sector Quantity 2<br />
2007 Baseline 2020 Projection<br />
Residential energy used 135,900 153,100<br />
Commercial energy used 156,200 184,300<br />
Industrial energy used 118,100 149,700<br />
Transportation energy used 110,400 118,100<br />
Solid Waste disposed in landfills 28,100 33,600<br />
Total 548,700 638,800<br />
Non-Campus Population 3 34,100 42,500<br />
Per Capita Greenhouse Gas Emissions 4 16 MT/Resident 15 MT/Resident<br />
Notes:<br />
1<br />
Estimates were calculated using ICLEI’s CACP s<strong>of</strong>tware.<br />
2<br />
Quantities have been rounded to the nearest hundred, except as noted.<br />
3<br />
The <strong>City</strong> <strong>of</strong> <strong>Urbana</strong> population figure is estimated from 2000 and 2010 Census Data. University <strong>of</strong> Illinois on-campus student resident<br />
population is not included in calculating per capita emissions noted above.<br />
4<br />
Per-capita emissions 2007 have Baseline been and rounded 2020 Projected to the nearest Emissions whole Increase number. in a ‘Business as Usual’ Scenario<br />
2020<br />
+12.5% +12.8% +17.8% +17.9% +26.8% +26.6% +5.8% +13.3% +13.6%<br />
110,100<br />
43,000<br />
152,000 32,300 114,500 35,200 97,900 20,200 20,100 33,500 33,600<br />
Projected<br />
increase<br />
2007<br />
97,800<br />
38,100<br />
129,000<br />
27,400<br />
90,300<br />
27,800<br />
92,600<br />
17,700 28,000<br />
Baseline<br />
emissions<br />
100,000 200,000 300,000 400,000 500,000 600,000 700,000<br />
MT CO 2<br />
e<br />
Residential Residential Commercial Commercial Industrial Industrial<br />
Electricity Gas Electricity Gas Electricity Gas<br />
Gasoline Diesel Waste<br />
Note: Figures are rounded to the nearest hundred and shown in MT CO 2<br />
e<br />
Figure 9. 2007 Baseline Emissions and Projected 2020 Increase in Emissions Under a Business As Usual Scenario by<br />
Sector and Source<br />
<strong>City</strong> <strong>of</strong> <strong>Urbana</strong><br />
42
110,100 43,000<br />
152,000 32,300 114,500 35,200 97,900 20,100 33,500<br />
2007<br />
2.4<br />
97,800 38,100<br />
129,000<br />
27,400<br />
EMISSIONS REDUCTION GOALS<br />
A reduction target provides a tangible goal for <strong>Urbana</strong>’s emissions reduction efforts. <strong>Urbana</strong>’s emissions reduction<br />
Residential Residential Commercial Commercial Industrial Industrial<br />
target is 25 percent below 2007 levels by 2020 and an 80 percent reduction below 2007 levels by 2050.<br />
The 25 percent target is aggressive yet achievable. This target is based on estimates <strong>of</strong> the impact <strong>of</strong> current and planned<br />
programs as well as likely future opportunities to reduce emissions. The target is in line with that set by the State <strong>of</strong><br />
Illinois as well as targets set by other states and countries, and in legislation introduced in the US Congress.<br />
The 2020 targeted level <strong>of</strong> emissions is approximately 411,600 metric tons <strong>of</strong> carbon dioxide equivalent (MT CO 2<br />
e). As<br />
shown in Figure 10, with business as usual and corresponding emission rates factored in, the likely reduction will have<br />
to be 227,200 MT CO 2<br />
e.<br />
2020<br />
100,000 200,000 300,000 400,000 500,000 600,000 700,000<br />
MT CO 2<br />
e<br />
Electricity Gas Electricity Gas Electricity Gas<br />
Gasoline Diesel Waste<br />
Note: Figures are rounded to the nearest hundred and shown in MT CO 2<br />
e<br />
GHG Emissions Reduction Goal: 25% below 2007 levels by 2020<br />
Target 2020 Emissions<br />
411,600 MT CO 2<br />
e<br />
90,300<br />
27,800<br />
Target: 25%<br />
below 2007<br />
emissions<br />
92,600<br />
17,700 28,000<br />
Total Reduction<br />
227,200 MT CO 2<br />
e<br />
Baseline<br />
emissions<br />
Projected increase<br />
if business as usual<br />
638,800 MT CO 2<br />
e<br />
2007<br />
Baseline<br />
548,700 MT CO 2<br />
e<br />
100,000 200,000 300,000 400,000 500,000 600,000 700,000<br />
MT CO 2<br />
e<br />
Note: Figures are rounded to the nearest hundred and shown in MT CO 2<br />
e<br />
Figure 10. <strong>Urbana</strong> 2020 - 25% Emissions Reduction Goal 1,2<br />
Notes:<br />
1<br />
Estimates were calculated using ICLEI’s CACP s<strong>of</strong>tware.<br />
2<br />
Quantities have been rounded to the nearest hundred, except as noted.<br />
Portland, OR - 40% below 1990 levels by the year 2030<br />
Los Angeles, CA - 35% below 1990 levels by the year 2030<br />
Salt Lake <strong>City</strong>, UT - 80% below 2005 by 2040<br />
Denver, CO - Achieve 1990 levels by the year 2020<br />
Kansas <strong>City</strong>, MO - 30% below 2000 levels by year 2020<br />
Evanston, IL - 17% below 1990 levels by 2020<br />
Chicago, IL - 25% below 1990 levels by 2020<br />
Figure 11. Examples <strong>of</strong> Greenhouse Gas Reduction Targets across the U.S.<br />
<strong>City</strong> <strong>of</strong> <strong>Urbana</strong><br />
43
2.5<br />
URBANA’S ENERGY USE<br />
A. MONITORING ENERGY EFFICIENCY<br />
Monitoring progress towards becoming more energy efficient involves comparing community-wide building energy<br />
consumption data from year to year. However, some summers are hotter than others, and winter this year may be milder<br />
than the last year. Therefore, energy requirements associated with space heating and cooling respond to fluctuating<br />
weather conditions and a direct comparison <strong>of</strong> raw energy consumption data would be misleading as it does not<br />
accurately reflect whether the community is becoming more energy efficient.<br />
As a solution, we can compare annual energy use by plotting a graph <strong>of</strong> monthly energy use against monthly weather<br />
conditions. This is done by normalizing community-wide energy consumed per month against a ratio <strong>of</strong> the Heating<br />
Degree Days and Cooling Degree Days in that month.<br />
Heating Degree Days (HDD) is a measure used to estimate the amount <strong>of</strong> energy required for residential space<br />
heating during the cold season. Similarly, Cooling Degree Days (CDD) is a measure used to estimate the amount <strong>of</strong> air<br />
conditioning usage during the warm season. To calculate HDD and CDD, 65 o F is assumed to be a comfortable indoor<br />
temperature. The mean temperature for the day is calculated by taking the high and low temperature for the day,<br />
adding them together and dividing them by two. If the mean temperature is at or above 65 o F, then HDD is zero, that<br />
is, no energy was needed to heat indoor space. If the mean temperature is below 65 o F, the HDD equals 65 minus the<br />
mean temperature. For example, if the mean temperature was 55 o F, then HDD amount equals 10. Similarly if the mean<br />
temperature was at or below 65 o F, then the CDD is zero, that is no energy was needed to cool indoor space. If the mean<br />
temperature was 75 o F, then the CDD amount equals 65 minus the mean temperature, amounting to 10. A monthly HDD<br />
value and CDD value is reported by the Illinois State Climatologist for their weather station in <strong>Urbana</strong>.<br />
By plotting energy consumed against a ratio <strong>of</strong> HDD and CDD, we can arrive at yearly trends that account for variations<br />
in external weather conditions. This allows us to reach a more accurate yearly comparison <strong>of</strong> energy efficiency <strong>of</strong> the<br />
building stock after eliminating those consumption changes that are a response to variable external weather conditions.<br />
B. WEATHERIZATION<br />
In October 2009, the <strong>City</strong> <strong>of</strong> <strong>Urbana</strong> received an Energy Efficiency and Conservation Block Grant (EECBG) to be used<br />
toward reducing its carbon footprint. A part <strong>of</strong> this grant ($72,000) was used to create an innovative program in<br />
partnership with Ameren Illinois’ Act On Energy Program. Through this program residents were able to benefit from free<br />
residential energy audits and discounts on major envelope improvements. Under this program, residents <strong>of</strong> <strong>Urbana</strong><br />
were provided with a free energy analysis <strong>of</strong> their residence and a compensation <strong>of</strong> an additional 40 percent <strong>of</strong> the Act<br />
On Energy Incentive available for Ameren customers for undertaking housing shell improvements, namely air sealing,<br />
attic insulation and wall insulation. Between 2010 and February 2012, 826 <strong>Urbana</strong> homes were audited, and 169 homes<br />
were retr<strong>of</strong>itted. Strategies to further reduce residential sector building energy consumption rely on securing additional<br />
funding to continue the community weatherization program.<br />
The Champaign County Regional Planning Commission Community Services Department also <strong>of</strong>fers a Illinois Home<br />
Weatherization Assistance Program (IHWAP) which is designed to reduce energy costs and improve home comfort levels<br />
for low income residents. IHWAP is funded by the U.S. Department <strong>of</strong> Energy (DOE), the U.S. Department <strong>of</strong> Health and<br />
Human Services (HHS), and the state supplemental Energy Assistance Fund. Between January and May 2012, a total <strong>of</strong><br />
982 units were assisted through this program countywide, including 177 multi-family units in <strong>Urbana</strong>.<br />
<strong>City</strong> <strong>of</strong> <strong>Urbana</strong><br />
44
2.5<br />
URBANA’S ENERGY USE<br />
C. AMEREN ILLINOIS’ TRADITIONAL SOURCES OF ENERGY AND RELATED EMISSIONS AND NUCLEAR<br />
WASTE<br />
Figure 12 shows the trends in the sources <strong>of</strong> the energy supplied for Ameren Illinois’ entire service region, and the<br />
related greenhouse gas emissions and nuclear waste created for each year between 2007 and 2011.<br />
EMISSIONS TYPE 2007 2008 2009 2010 2011<br />
CARBON DIOXIDE (LBS)<br />
NITROGEN DIOXIDE (LBS)<br />
SULFUR DIOXIDE (LBS)<br />
HIGH-LEVEL NUCLEAR WASTE (LBS)<br />
LOW-LEVEL NUCLEAR WASTE (FT 3 )<br />
1,625.00 1,825.00 1,844.00 1,800.00 1,768.00<br />
1.76 2.9 1.66 0.95 1.16<br />
3.67 3.86 3.96 3.31 3.5<br />
0.00
2.5<br />
URBANA’S ENERGY USE<br />
D. MUNICIPAL ELECTRIC AGGREGATION<br />
<strong>Urbana</strong> voters approved municipal electric aggregation with a 71 percent vote in the March 20, 2012 referendum. The<br />
referendum allowed the <strong>City</strong> to bundle, or aggregate, residential and small commercial retail electric accounts and seek<br />
bids for cheaper power.<br />
Starting in August 2012, <strong>Urbana</strong> residents and small businesses will benefit from a two-year contract with Homefield<br />
Energy <strong>of</strong> Collinsville provided they choose not to opt out <strong>of</strong> the electricity aggregation program. As per the contract,<br />
100% <strong>of</strong> the electricity will either be supplied from renewable sources or will be <strong>of</strong>fset by Renewable Energy Certificates<br />
(RECs) sourced from renewable energy generation including hydroelectric, wind and solar energy. Initial enrollment data<br />
indicates that 95 percent <strong>of</strong> <strong>Urbana</strong>’s residential and small commercial retail electricity customers have opted to be a<br />
part <strong>of</strong> the municipal electric aggregation group.<br />
The supplier, Homefield Energy, is required to provide the following quarterly reports to the <strong>City</strong>:<br />
(i) A Power-Mix report, demonstrating that the supplier generated or purchased electricity with the claimed<br />
environmental attributes in amounts sufficient to match the actual consumption by customers; that the<br />
same generated energy was not sold to more than one customer; and that the electricity was supplied to<br />
the interconnected grid serving customers. This report must show the source <strong>of</strong> the power and demonstrate that<br />
the power supplied was in accordance with the State <strong>of</strong> Illinois Renewable Portfolio Standard and the federal<br />
Clean Air Act regulations and permits.<br />
(ii) An REC report providing competent and reliable evidence to support the fact that the supplier purchased<br />
properly certified REC’s in a sufficient quantity to <strong>of</strong>fset the non-renewable energy provided in the mix.<br />
(iii) An Aggregation Report showing the number <strong>of</strong> customers in the aggregation program, the total cost <strong>of</strong> energy<br />
provided to the program as compared to Ameren’s default tariff service rates and; the suppliers efforts at<br />
customer education.<br />
Balancing Short Term Benefits with the Long Term Risk:<br />
While the supply <strong>of</strong> 100 percent renewable power through municipal aggregation is a positive achievement in the short<br />
time-frame, it is important for the community to continue to aggressively pursue energy efficiency measures to achieve<br />
<strong>Urbana</strong>’s long-term emissions reduction goals.<br />
Renewable energy prices may rise relative to other energy sources once beyond the 2012-2014 contract. Under this<br />
scenario, it may be financially unviable to continue to purchase renewable energy. Therefore, continued efforts to make<br />
the community more energy efficient in the intervening time will help mitigate:<br />
(i)<br />
(ii)<br />
The risk <strong>of</strong> failing to reach community-wide emissions reductions targets due to a future reliance on nonrenewable<br />
energy sources and;<br />
The risk <strong>of</strong> future higher energy costs for residents from renewable and non-renewable energy sources.<br />
E. RENEWABLE ENERGY CERTIFICATES 6<br />
Renewable Energy Certificates (RECs) are tradable instruments that can be used to meet voluntary renewable energy<br />
targets as well as to meet compliance requirements for renewable energy policies. A REC is a certificate that represents<br />
the generation <strong>of</strong> one megawatt-hour (MWh) <strong>of</strong> electricity from an eligible source <strong>of</strong> renewable energy. Each REC<br />
denotes the underlying generation electricity source, location <strong>of</strong> the generation, and year <strong>of</strong> generation, environmental<br />
emissions, and other characteristics associated with the generator. RECs represent the claim to the environmental<br />
attributes associated with renewable energy generation.<br />
6<br />
Source: Guide to Purchasing Green Power, Office <strong>of</strong> Air, U.S. E.P.A., March 2010<br />
<strong>City</strong> <strong>of</strong> <strong>Urbana</strong><br />
46
2.5<br />
URBANA’S ENERGY USE<br />
RECs may be bundled (paired by the electric service provider with grid electricity delivered to the buyer) or unbundled<br />
from electricity as a stand alone product and paired by the buyer with its grid electricity purchase. RECs combined with<br />
plain grid electricity are equivalent to green power purchases from the local utility, no matter where the electricity is<br />
sourced.<br />
Because RECs are not tied to the physical delivery <strong>of</strong> electrons, organizations can purchase green power from suppliers<br />
other than local utility providers. RECs therefore help overcome a major barrier to renewable facility development - as<br />
the best renewable sources may not be located close to population centers. The sale <strong>of</strong> RECs allows these more remote<br />
renewable energy facilities to benefit from the support for green power.<br />
Figure 13 shows one possible way in which a REC can be traded and used.<br />
Figure 13. A Possible Renewable Energy Certificate (REC) Transaction Path in a Voluntary Green Power Market<br />
Source: Adapted from Guide to Purchasing Green Power, Office <strong>of</strong> Air, U.S. E.P.A., March 2010. p. 10<br />
<strong>City</strong> <strong>of</strong> <strong>Urbana</strong><br />
47
3. GOALS,<br />
<strong>ACTION</strong>S,<br />
& IMPLEMENTATION STRATEGIES<br />
Roundabout on Stebbins Drive in<br />
<strong>Urbana</strong> (Image Courtesy Google Maps)<br />
Curbside Recycling in<strong>Urbana</strong><br />
Philo Road, <strong>Urbana</strong><br />
<strong>City</strong> <strong>of</strong> <strong>Urbana</strong><br />
49
3.1<br />
PRIORITY <strong>ACTION</strong>S<br />
Phase I <strong>of</strong> the <strong>Urbana</strong> Climate Action Plan addresses the following four priority sectors. Together, these sectors account for<br />
66 percent <strong>of</strong> emissions in <strong>Urbana</strong>:<br />
1) Electricity, commercial sector;<br />
2) Electricity, residential sector;<br />
3) Gasoline, transportation sector;<br />
4) Natural gas, residential sector.<br />
Additionally, Phase I focuses on outreach, education and coordination.<br />
The strategies recommended in this section have been identified as the most feasible ones to implement in the short term,<br />
based on relative ease and low cost <strong>of</strong> implementation. To the extent possible, strategies leverage existing programs and<br />
inter-governmental relationships, in particular, the <strong>City</strong> <strong>of</strong> <strong>Urbana</strong>, <strong>City</strong> <strong>of</strong> Champaign, Champaign County, and University<br />
<strong>of</strong> Illinois to pursue opportunities for collaboration on common goals.<br />
5%<br />
waste<br />
5%<br />
industrial<br />
natural gas<br />
5%<br />
commercial<br />
natural gas<br />
3%<br />
diesel<br />
24%<br />
commercial<br />
electricity<br />
7%<br />
residential<br />
natural gas<br />
16%<br />
industrial electricity<br />
18%<br />
residential electricity<br />
17%<br />
gasoline<br />
Figure 14. <strong>City</strong> <strong>of</strong> <strong>Urbana</strong> 2007 Baseline Greenhouse Gas Emissions Rank by Source and Sector<br />
Note: Estimates were calculated using ICLEI’s CACP s<strong>of</strong>tware.<br />
<strong>City</strong> <strong>of</strong> <strong>Urbana</strong><br />
51
3.1<br />
Figure 15 below describes one example <strong>of</strong> the contribution <strong>of</strong> various actions to <strong>Urbana</strong>’s 2020 emissions reduction<br />
target. This example scenario was developed using the ICLEI CAPPA s<strong>of</strong>tware.<br />
Together, these example actions can help <strong>Urbana</strong> achieve 80% <strong>of</strong> it’s 2020 greenhouse gas emissions<br />
reduction target. 1<br />
• Purchasing Renewable Energy Certificates for<br />
20% <strong>of</strong> community electricity requirements can<br />
help <strong>Urbana</strong> achieve 32% <strong>of</strong> its emissions reduction<br />
target.<br />
• Purchasing Green Electricity for 100% <strong>of</strong> government<br />
operations and 50% <strong>of</strong> Community electricity<br />
requirements can help <strong>Urbana</strong> achieve 27% <strong>of</strong> its<br />
emissions reduction target.<br />
• If 100 <strong>City</strong> Fleet vehicles and 2500 privately-owned<br />
vehicles are flexible fuel vehicles able to run on up<br />
to 85% ethanol and 15% gasoline it will help <strong>Urbana</strong><br />
achieve 5% <strong>of</strong> its emissions reduction target.<br />
• Targeted outreach and education programs<br />
that <strong>of</strong>fer information about and encourage and<br />
incentivize conservation measures can help <strong>Urbana</strong><br />
achieve 5% <strong>of</strong> its emissions reduction target.<br />
• Education and individualized surveying <strong>of</strong> people<br />
to find out their interest in automobile alternatives<br />
and sending out targeted information on lowcarbon<br />
transportation options can help <strong>Urbana</strong><br />
achieve 3% <strong>of</strong> its emissions reduction target.<br />
• Outreach and educational programs that <strong>of</strong>fer<br />
information about and encourage conservation<br />
measures tailored specifically for small businesses<br />
and active participation <strong>of</strong> 500 businesses in green<br />
practices can help <strong>Urbana</strong> achieve 2% <strong>of</strong> its<br />
emissions reduction target.<br />
• Generating 50kW photovoltaic energy<br />
for powering <strong>City</strong> Operations and 5000 kW<br />
photovoltaic energy towards community energy<br />
needs will help <strong>Urbana</strong> achieve 2% <strong>of</strong> its emissions<br />
reduction target.<br />
• If 50 <strong>City</strong> Fleet vehicles and 1000 privately-owned<br />
vehicles are electric vehicles, it can help <strong>Urbana</strong><br />
achieve 2% <strong>of</strong> its emissions reduction target.<br />
• Replacing inefficient and older lighting fixtures<br />
with new electronic ballasts and T-8 size tubes for<br />
50,000 sq ft <strong>of</strong> <strong>City</strong> property and 4,000,000 sq ft <strong>of</strong><br />
private facilities can help <strong>Urbana</strong> achieve 2% <strong>of</strong> its<br />
emissions reduction target.<br />
1<br />
This contribution to be updated after the first quarterly municipal electric aggregation report showing the total<br />
energy supplied from green energy sources and the quantity <strong>of</strong> Renewable Energy Credits (RECs) purchased<br />
towards the total energy supplied to <strong>Urbana</strong> residential and small commercial customers in the municipal<br />
electric aggregation program is available.<br />
Figure 15. Examples <strong>of</strong> Community-Wide Actions and Their Contribution Towards Reaching Emissions Reduction Targets<br />
Source: Climate and Air Pollution Planning Assistant V1.5, ICLEI<br />
<strong>City</strong> <strong>of</strong> <strong>Urbana</strong><br />
52
3.1<br />
80% 90%<br />
EMISSIONS<br />
REDUCTION TARGET<br />
227,200 MT CO 2<br />
e<br />
by 2020<br />
Together, these example actions can help <strong>Urbana</strong> achieve 10% <strong>of</strong> it’s 2020<br />
GHG emissions reduction target.<br />
• Energy Efficiency Retr<strong>of</strong>its <strong>of</strong> 50,000 sq ft <strong>of</strong> existing Government and 1,500,000 sq ft <strong>of</strong><br />
existing Community Facilities<br />
• Commercial Energy Code for 1,500,000 sq ft <strong>of</strong> new construction and renovations<br />
• Lighting Occupancy Sensors for 50,000 sq ft <strong>of</strong> Government and 1,250,000 sq ft <strong>of</strong><br />
Community Facilities<br />
• Incentivize and Assist Green Building Efforts for 750,000 sq ft <strong>of</strong> Community Facilities<br />
• Hybrid Vehicles - 25 hybrids used for Government Operations and 1,000 hybrids used in the<br />
Community<br />
• Green Building for 50,000 sq ft <strong>of</strong> new construction and renovation <strong>of</strong> Government<br />
and 1,000,000 sq ft <strong>of</strong> Community Facilities.<br />
• Energy Efficiency Retr<strong>of</strong>it at time <strong>of</strong> Sale for 3,000 homes sold over 10 years<br />
• 375 businesses participating in Green Business Programs<br />
Together, these example actions can help <strong>Urbana</strong> achieve 10% <strong>of</strong> it’s 2020 GHG emissions reduction<br />
target.<br />
• Limit Idling <strong>of</strong> Heavy Duty Vehicles (trucks) for 50 government vehicles and 500 community • Efficient Clothes Washers (2,000 clothes washers replaced with ENERGY STAR washers<br />
vehicles<br />
in the community)<br />
• Fleet Conversion <strong>of</strong> 200 community vehicles to Biodiesel (B20)<br />
• Offer Loans for Energy Efficiency Improvements (600 homes retr<strong>of</strong>itted)<br />
• Water Conservation Ordinance (12% on household saving)<br />
• Energy Efficient Computer Monitors (replace 125 government monitors and 4,000<br />
• Use Geothermal Heat Pump for Heating and Cooling for 800 homes<br />
monitors in the community with ENERGY STAR monitors)<br />
• High Efficiency Water Heaters (replace 5 government heaters and 1,500 water heaters in • Increase Bus Ridership (500 number <strong>of</strong> additional daily bus passengers)<br />
community)<br />
• Parking and Lane Incentives for Hybrid Vehicles (50 number <strong>of</strong> additional hybrids<br />
• Provide Free High School Bus Passes to 3,000 students<br />
purchased over 10 years)<br />
• Low-income Home Weatherization for 900 homes<br />
• Energy Efficient Exit Signs (replace 30 government signs and 800 signs in the<br />
• Energy Efficient Vending Machines ( replace 5 government and 600 vending machines in community)<br />
the community with ENERGY STAR vending appliances)<br />
• Promote Carpooling and Vanpooling (20 <strong>City</strong> employees and 1,000 employees in<br />
• Energy Efficient Affordable Housing (250 homes to be built)<br />
the community <strong>of</strong>fered carpool and vanpool incentives)<br />
• Energy Efficient Refrigerators (replace 5 government and 2,000 refrigerators in community) • Integrate Bicycles and Transit (250 number <strong>of</strong> additional daily bike/transit trips<br />
• Compressed Natural Gas (CNG) Vehicles 50 for government vehicles and 400 vehicles in replacing car trips)<br />
the community<br />
• Increase Bus Ridership (25 <strong>City</strong> employees switch from car to bus and 250 number <strong>of</strong><br />
• Energy Efficient Printers (replace 30 government printers and 2,250 printers in the<br />
additional daily bus passengers)<br />
community with ENERGY STAR printers)<br />
• Green Ro<strong>of</strong>s (for 10,000 sq.ft <strong>of</strong> government facilities and 200,000 sq. ft. <strong>of</strong> community<br />
• Energy Efficient Computers (replace 125 government computers and 4,000 computers in buildings)<br />
the community with ENERGY STAR computers)<br />
• Limit Idling <strong>of</strong> Local Transit Buses and School Buses (for 100 buses)<br />
• Initiate a Carshare (500 participants)<br />
• Compact Fluorescent Light Bulb (CFL) Distribution (replace 2,500 bulbs)<br />
• HVAC Fan Upgrades (upgrade 50,000 sq.ft. government facilities and 2,000,000 sq.ft. • Energy Efficient Room Air Conditioners (1,000 window air conditioners replaced with<br />
community facilities)<br />
ENERGY STAR units in the community)<br />
• Use Solar Hot Water (500 homes use solar hot water)<br />
• Promote Telecommuting (700 employees in the community <strong>of</strong>fered telecommuting<br />
• Energy Efficient Copiers ( replace 20 government copiers and 1,000 computers in the incentives)<br />
community with ENERGY STAR copiers)<br />
• Increase Urban Forest (250 trees planted)<br />
• Provide Bicycles for Daily Trips (200 <strong>City</strong> employees <strong>of</strong>fered bicycles or incentives to use • Exchange Fluorescent Torchieres to Replace Halogen (500 halogen torchieres<br />
bicycles and 300 bicycles made available for the community)<br />
replaced with fluoresent)<br />
• Increase Chiller Efficiency (upgrade 25,000 sq.ft. government facilities and 800,000 sq.ft. • Increase Boiler Efficiency (upgrade 25,000 sq.ft. government facilities and 1,000,000<br />
community facilities)<br />
sq.ft. community facilities)<br />
• Electric Vehicle Charging Stations on Parking Structures (provide 200 vehicle charging • Plant Trees to Shade Buildings (25 trees planted to shade government buildings and<br />
stations)<br />
350 trees planted to shade community buildings)<br />
• Strict Residential Energy Code for 400 units <strong>of</strong> new housing construction<br />
• Energy Efficient Water Coolers (300 water coolers replaced with ENERGY STAR<br />
• Low-Maintenance Landscaping (on 5 acres <strong>of</strong> government operations and 500 residences) coolers)<br />
• Switch Electric Heat to Natural Gas (for 500 homes)<br />
• Expand Curbside Recycling Programs (waste diverted from landfills 75lbs/person/<br />
• Reflective Ro<strong>of</strong>ing (for 15,000 sq.ft <strong>of</strong> government facilities and 500,000 sq. ft. <strong>of</strong> community year)<br />
buildings)<br />
• Expand Business Recycling Programs (waste diverted from landfills 50lbs/person/year)<br />
• LED Holiday Lights (30,000 strings replaced with LED lights)<br />
• Water Saving Faucets (replace 30 faucets in government facilities and 1,500 faucets<br />
• Use Smaller Fleet Vehicles (10 smaller vehicles used in government operations and 150 in the community)<br />
smaller vehicles used in the community)<br />
• Walking Friendly Environments (1,000 weekly trips switched from car to walking)<br />
• Water Saving Shower Heads (2 shower heads replaced for government operations and • Implement Pay-as-You-Throw Program (waste reduced by 25 lbs/person/year)<br />
1,500 shower heads replaced in the community)<br />
• Organics Composting (waste diverted from landfill 40 lbs/person/year)<br />
• Bicycling Paths and Facilities (200 employees <strong>of</strong>fered improved bicycle facilities and 2,500 • Reuse or Recycling <strong>of</strong> Construction Materials (waste diverted from landfills: 4lbs/sq.ft<br />
weekly community trips switch from car to bicycle)<br />
construction for government operations and 4lbs/sq ft for community construction)<br />
• Energy-Efficient Dish Washers (2,000 dishwashers replaced with ENERGY STAR washers in the • High Efficiency Toilets (15 toilets or urinals replaced in government operations and<br />
community)<br />
1,000 toilets or urinals replaced in the community)<br />
<strong>City</strong> <strong>of</strong> <strong>Urbana</strong><br />
53
3.2<br />
GOAL 1:<br />
REDUCE EMISSIONS FROM BUILDING ENERGY CONSUMPTION<br />
Action 1: Reduce emissions from commercial sector building electricity<br />
consumption.<br />
Electricity use in the commercial sector accounts for 24 percent <strong>of</strong> emissions<br />
in <strong>Urbana</strong>. The most important end uses <strong>of</strong> energy in this sector include air<br />
conditioning, lighting, and ventilation. A focus on energy efficiency should yield<br />
at least 25 percent reduction for emissions from commercial building electric<br />
consumption, or 6 percent overall emissions reduction for the <strong>City</strong>.<br />
Data from Ameren is based on account type. Depending on the number <strong>of</strong> units in<br />
a building and whether they are separately metered, a residential rental property<br />
may have a residential or commercial account. Data for the commercial sector<br />
therefore include both residential and commercial properties.<br />
IMPLEMENTATION STRATEGIES<br />
Energy Efficiency:<br />
1. Facilitate access and increase the impact <strong>of</strong> existing technical assistance and<br />
incentive programs. Technical assistance is available from organizations like the<br />
Smart Energy Design and Assistance Center (SEDAC) and the Illinois Sustainable<br />
Technology Center (ISTC), at the University <strong>of</strong> Illinois at <strong>Urbana</strong>-Champaign, and<br />
the Ameren Act On Energy Program.<br />
2. Create programs to encourage businesses to retr<strong>of</strong>it existing<br />
buildings and purchase energy star appliances.<br />
Financial:<br />
3. Identify additional sources <strong>of</strong> funding to leverage existing resources.<br />
Information and Outreach:<br />
4. Organize education programs, create an information platform and organize<br />
site visits to completed projects in the community to highlight best practices<br />
and facilitate access to existing sources <strong>of</strong> technical expertise in the community.<br />
5. Identify specific barriers through focus groups and surveys in the local<br />
business and commercial community.<br />
Existing Programs<br />
• SEDAC maintains a comprehensive list <strong>of</strong> Energy Incentive opportunities at http://<br />
smartenergy.arch.uiuc.edu/energy-incentives.html.<br />
• Public sector customers are eligible for incentives through the Illinois Department <strong>of</strong><br />
Commerce & Economic Opportunity (DCEO) Illinois Energy Now program.<br />
• Energy efficiency incentives for private sector are available to customers <strong>of</strong> ComEd<br />
(electric) through Smart Ideas, Ameren Illinois (gas and electric) through ActOnEnergy,<br />
Nicor (gas), North Shore (gas), or Peoples Gas (gas). Eligible business customers can<br />
apply for Illinois Energy Efficiency Portfolio Standard (EEPS) money directly through their<br />
subscribed utility delivery provider.<br />
• Information regarding Illinois Commercial Incentives can be found on the U.S.<br />
Department <strong>of</strong> Energy’s database <strong>of</strong> State Incentives for Renewables and Efficiency at<br />
https://www.dsireusa.org<br />
IMPLEMENTATION PARTNERS<br />
• <strong>City</strong> <strong>of</strong> <strong>Urbana</strong>, SEDAC, ISTC, Ameren<br />
Illinois, Illinois Green Business Association<br />
(IGBA), <strong>Urbana</strong> Business Association (UBA)<br />
• <strong>City</strong> <strong>of</strong> <strong>Urbana</strong>, Illinois Green Business<br />
Association (IGBA), <strong>Urbana</strong> Business<br />
Association (UBA)<br />
• <strong>City</strong> <strong>of</strong> <strong>Urbana</strong><br />
• <strong>City</strong> <strong>of</strong> <strong>Urbana</strong>, U.S. Green Building<br />
Council Central Illinois Branch (USGBC-IL),<br />
Champaign County Sustainability Network<br />
(CCNet), Illinois Sustainable Technology<br />
Center (ISTC)<br />
• <strong>City</strong> <strong>of</strong> <strong>Urbana</strong> ,<strong>Urbana</strong> Business<br />
Association (UBA), Champaign County<br />
Chamber <strong>of</strong> Commerce, Champaign<br />
County Economic Development<br />
Corporation (CCEDC)<br />
Associated Advantages<br />
1. Annual energy cost savings<br />
2. Improved air quality and health<br />
3. Green jobs<br />
<strong>City</strong> <strong>of</strong> <strong>Urbana</strong><br />
54
3.2<br />
GOAL 1:<br />
REDUCE EMISSIONS FROM BUILDING ENERGY CONSUMPTION<br />
Action 2: Reduce emissions from residential sector building electricity<br />
consumption.<br />
Electricity use in the residential sector accounts for 18 percent <strong>of</strong> emissions in<br />
<strong>Urbana</strong>. Phase I actions focus on renewable energy through Renewable Energy<br />
Certificates (RECs).<br />
Renewable Energy Certificates represent and convey the environmental and other<br />
non-power attributes <strong>of</strong> one megawatt-hour <strong>of</strong> renewable electricity generation.<br />
See page 46 for more information on RECs.<br />
IMPLEMENTATION STRATEGIES<br />
Renewable Energy:<br />
1. Facilitate the use <strong>of</strong> Renewable Energy Certificates (RECs) through municipal<br />
electric aggregation. This alone can result in a major beneficial impact by<br />
helping <strong>Urbana</strong> achieve 32% <strong>of</strong> its 2020 emissions reduction goal.<br />
2. Work towards maintaining purchase <strong>of</strong> clean renewable energy through<br />
municipal electric aggregation over a long-term horizon through discussions<br />
with utility companies, the <strong>City</strong> <strong>of</strong> Champaign and the University <strong>of</strong> Illinois.<br />
Energy Efficiency:<br />
3. Create programs to encourage residents to retr<strong>of</strong>it existing<br />
buildings and purchase energy star appliances.<br />
Financial:<br />
4. Identify additional sources <strong>of</strong> funding to leverage existing resources.<br />
Information and Outreach:<br />
5. Organize education programs, create an information platform and organize<br />
site visits to completed projects in the community to highlight best practices and<br />
facilitate access to existing sources <strong>of</strong> technical expertise in the community.<br />
6. Identify specific barriers through focus groups and surveys in the local<br />
community.<br />
Existing Programs<br />
• SEDAC maintains a comprehensive list <strong>of</strong> Energy Incentive opportunities at http://<br />
smartenergy.arch.uiuc.edu/energy-incentives.html.<br />
• Information regarding Illinois Residential Incentives can be found on the U.S. Department<br />
<strong>of</strong> Energy’s database <strong>of</strong> State Incentives for Renewables and Efficiency at https://www.<br />
dsireusa.org.<br />
IMPLEMENTATION PARTNERS<br />
• <strong>City</strong> <strong>of</strong> <strong>Urbana</strong><br />
• <strong>City</strong> <strong>of</strong> <strong>Urbana</strong><br />
• <strong>City</strong> <strong>of</strong> <strong>Urbana</strong>, Smart Energy Design<br />
Assistance Center (SEDAC), Ameren<br />
Illinois, Illinois Sustainable Technology<br />
Center (ISTC)<br />
• <strong>City</strong> <strong>of</strong> <strong>Urbana</strong><br />
• <strong>City</strong> <strong>of</strong> <strong>Urbana</strong>, U.S. Green Building<br />
Council Central Illinois Branch (USGBC-IL),<br />
Champaign County Sustainability Network<br />
(CCNet), Illinois Sustainable Technology<br />
Center (ISTC)<br />
• <strong>City</strong> <strong>of</strong> <strong>Urbana</strong><br />
Associated Advantages<br />
1. Annual energy cost savings<br />
2. Improved air quality and health<br />
3. Green jobs<br />
4. Increased demand for renewable<br />
energy investment<br />
• Energy efficiency incentives for private sector are available to customers through their<br />
subscribed utility delivery provider.<br />
<strong>City</strong> <strong>of</strong> <strong>Urbana</strong><br />
55
3.2<br />
GOAL 1:<br />
REDUCE EMISSIONS FROM BUILDING ENERGY CONSUMPTION<br />
Action 3: Reduce emissions from residential sector building natural gas<br />
consumption.<br />
Heating is the most significant end use <strong>of</strong> natural gas in the residential sector.<br />
Weatherization and insulation are cost effective techniques for reducing natural<br />
gas use in this sector.<br />
<strong>Urbana</strong> has expended all funds from the U.S. D.O.E. Energy Efficiency Conservation<br />
Block Grant, which were used in part to leverage existing incentives from the<br />
Ameren Act On Energy Program. In order to continue to drive down natural gas<br />
usage in the residential sector, a primary strategy <strong>of</strong> seeking additional funding to<br />
continue <strong>Urbana</strong>’s weatherization program is recommended.<br />
IMPLEMENTATION STRATEGIES<br />
Energy Efficiency:<br />
1. Seek additional funding to continue <strong>Urbana</strong>’s weatherization program.<br />
Information and Outreach:<br />
2. Launch a campaign to encourage residents to use programmable thermostats<br />
with appropriate settings and implement simple weatherization techniques.<br />
3. Organize education programs, create an information platform and organize<br />
site visits to completed projects in the community to highlight best practices and<br />
facilitate access to existing sources <strong>of</strong> technical expertise in the community.<br />
4. Identify specific barriers through focus groups and surveys in the local<br />
community.<br />
IMPLEMENTATION PARTNERS<br />
• <strong>City</strong> <strong>of</strong> <strong>Urbana</strong>, Smart Energy Design<br />
Assistance Center (SEDAC), Illinois<br />
Sustainable Technology Center (ISTC),<br />
Ameren Illinois, U.S. Department <strong>of</strong><br />
Energy (DOE)<br />
• <strong>City</strong> <strong>of</strong> <strong>Urbana</strong>, Smart Energy Design<br />
Assistance Center (SEDAC), Illinois<br />
Sustainable Technology Center (ISTC)<br />
• <strong>City</strong> <strong>of</strong> <strong>Urbana</strong>, Smart Energy Design<br />
Assistance Center (SEDAC), U.S.<br />
Green Building Council Central Illinois<br />
Branch (USGBC-IL), Champaign County<br />
Sustainability Network (CCNet), Illinois<br />
Sustainable Technology Center (ISTC)<br />
• <strong>City</strong> <strong>of</strong> <strong>Urbana</strong><br />
Existing Programs<br />
• SEDAC maintains a comprehensive list <strong>of</strong> energy incentive opportunities at http://<br />
smartenergy.arch.uiuc.edu/energy-incentives.html.<br />
• Information regarding Illinois residential incentives can be found on the U.S. Department<br />
<strong>of</strong> Energy’s database <strong>of</strong> State Incentives for Renewables and Efficiency at https://www.<br />
dsireusa.org.<br />
Associated Advantages<br />
1. Annual energy cost savings<br />
2. Improved air quality and health<br />
3. Green jobs<br />
• Energy efficiency incentives for private sector are available to customers through their<br />
subscribed utility delivery provider.<br />
<strong>City</strong> <strong>of</strong> <strong>Urbana</strong><br />
56
3.2<br />
GOAL 1:<br />
REDUCE EMISSIONS FROM BUILDING ENERGY CONSUMPTION<br />
Chart Title<br />
Other<br />
Computers<br />
Waste Water Treatment<br />
Cooking<br />
Washers, Dryers, Dishwashers<br />
Air Conditioning<br />
Refrigerators<br />
Electronics<br />
Water Heating<br />
Lighting<br />
Space Heating<br />
others 8 %<br />
computers 1 %<br />
waste water treatment 3 %<br />
cooking 5 %<br />
washers, dryers, dishwashers 7 %<br />
air-conditioning 9 %<br />
Series1<br />
refrigerators 9 %<br />
electronics 9.5 %<br />
water heating 11 %<br />
lighting 13.5 %<br />
space heating 24 %<br />
0% 5% 10% 15% 20% 25% 30%<br />
Figure 16. Residential Building Energy Emissions Sources<br />
Source: U.S. Others Energy Information Administration<br />
Prepared By: Smart Energy Design Assistance Center (SEDAC)<br />
Waste Water Treatment<br />
Chart Title<br />
Cooking<br />
Office Equipment<br />
Water Heating<br />
Computers<br />
Air Conditioning<br />
Refrigeration<br />
Ventilation<br />
Space Heating<br />
Lighting<br />
other 12 %<br />
waste water treatment 1 %<br />
cooking 1 %<br />
<strong>of</strong>fice equipment 1 %<br />
water heating 3 %<br />
computers 4 %<br />
air conditioning 6 %<br />
refrigeration 10 %<br />
ventilation 11 %<br />
space heating 15 %<br />
Series1<br />
lighting 36 %<br />
0% 5% 10% 15% 20% 25% 30% 35% 40%<br />
Figure 17. Commercial Building Energy Emissions Sources<br />
Source: U.S. Energy Information Administration<br />
Prepared By: Smart Energy Design Assistance Center (SEDAC)<br />
<strong>City</strong> <strong>of</strong> <strong>Urbana</strong><br />
57
3.2<br />
GOAL 2:<br />
REDUCE EMISSIONS FROM GASOLINE CONSUMPTION<br />
Emissions from the gasoline transportation sector account for 17 percent <strong>of</strong><br />
<strong>Urbana</strong>’s greenhouse gas emissions, making this a high priority action area.<br />
Immediate action in encouraging a reduction in these emissions is necessary<br />
through education programs, infrastructure development, and by encouraging<br />
shared commuting.<br />
Action 1: Support sustainable transportation through infrastructure improvements.<br />
Action 2: Promote a culture <strong>of</strong> sustainable transportation.<br />
Action 3: Encourage participation in sustainable transportation programs.<br />
Action 4: Consider transportation sector emissions projections in land-use<br />
planning decisions.<br />
IMPLEMENTATION STRATEGIES<br />
Energy Efficiency:<br />
1. Pursue bicycle and pedestrian infrastructure improvements.<br />
2. Pursue the development <strong>of</strong> energy-efficient transportation infrastructure<br />
such as modern roundabouts and other yield-controlled intersections, and<br />
speed control and traffic-calming measures.<br />
Existing Plans<br />
3. Implement recommendations from the 2010 <strong>Urbana</strong> Bicycle Master Plan,<br />
the 2009 Long Range Transportation Plan, and the 2004 Champaign County<br />
Greenways and Trails Plan.<br />
Information and Outreach:<br />
4. Provide and promote education on safe bicycling practices, and for motorists,<br />
bicyclists and pedestrians to share the road.<br />
5. Promote energy efficient driving techniques.<br />
6. Encourage residents to use walking or bicycling for at least a part <strong>of</strong> their<br />
weekly transportation needs.<br />
7. Pursue local government actions recommended in the State <strong>of</strong> Illinois Electric<br />
Vehicle Advisory Council Report published in December 2011. See Appendix G<br />
for a comprehensive list <strong>of</strong> recommendations.<br />
8. Collaborate with local business and institutions to create programs<br />
encouraging shared commuting, car-share, bike-share and bike purchase<br />
programs.<br />
9. Identify specific barriers to adopting more active and energy-efficient<br />
transportation behaviors through focus groups and surveys, and provide<br />
information and resources to help overcome these barriers.<br />
Associated Advantages<br />
1. Annual energy cost savings<br />
2. Improved air quality and health<br />
3. Improved fitness<br />
4. Quality <strong>of</strong> life<br />
IMPLEMENTATION PARTNERS<br />
• <strong>City</strong> <strong>of</strong> <strong>Urbana</strong>, Champaign <strong>Urbana</strong><br />
Urbanized Area Transportation Study<br />
(CUUATS), Champaign <strong>Urbana</strong> Mass<br />
Transit District (CUMTD)<br />
• <strong>City</strong> <strong>of</strong> <strong>Urbana</strong>, Champaign <strong>Urbana</strong><br />
Urbanized Area Transportation Study<br />
(CUUATS), Champaign County Regional<br />
Planning Commission (CCRPC)<br />
• <strong>City</strong> <strong>of</strong> <strong>Urbana</strong>, <strong>Urbana</strong> Bicycle<br />
and Pedestrian Advisory Committee,<br />
Champaign County Bikes, Champaign<br />
<strong>Urbana</strong> Mass Transit District (CUMTD)<br />
• <strong>City</strong> <strong>of</strong> <strong>Urbana</strong><br />
• <strong>City</strong> <strong>of</strong> <strong>Urbana</strong>, University <strong>of</strong> Illinois<br />
<strong>Urbana</strong>-Champaign (UIUC), <strong>City</strong> <strong>of</strong><br />
Champaign, Champaign County Regional<br />
Planning Commission (CCRPC), Champaign<br />
<strong>Urbana</strong> Mass Transit District (CUMTD)<br />
• <strong>City</strong> <strong>of</strong> <strong>Urbana</strong><br />
<strong>City</strong> <strong>of</strong> <strong>Urbana</strong><br />
58
3.2<br />
GOAL 2:<br />
REDUCE EMISSIONS FROM GASOLINE CONSUMPTION<br />
Transportation in <strong>Urbana</strong><br />
As per the 2010 U.S. Census and 2010 American Community Survey (ACS) 5-year estimates, 12.4 percent <strong>of</strong> the workers<br />
living in the <strong>City</strong> <strong>of</strong> <strong>Urbana</strong> use public transportation (including taxicabs) when travelling to and from work. 17.9 percent<br />
walked to work and 5.3 percent <strong>of</strong> the workers living in <strong>Urbana</strong> bicycled to work. Table 3 below describes <strong>Urbana</strong>’s<br />
commuting to work transportation modes in the regional context.<br />
TABLE 3. COMMUTING TO WORK TRANSPORTATION MODES IN THE CHAMPAIGN-URBANA<br />
REGION IN 2010<br />
Transportation Mode<br />
Percentage <strong>of</strong> Workers in Population Aged 16 or older<br />
<strong>Urbana</strong> Champaign Savoy Bondville<br />
Car, truck, or van; drove alone 51.6% 65.3% 75.8% 82.9%<br />
Car, truck, or van; carpooled 7.7% 7.9% 11.5% 14.4%<br />
Public Transportation<br />
(including taxicab) 12.4% 6.7% 4.6% 0.0%<br />
Walked 17.9% 12.4% 0.9% 0.0%<br />
Bicycled 5.3% 2.8% 1.1% 0.8%<br />
Other means 0.5% 1.0% 0.3% 0.0%<br />
Worked at home 4.6% 3.9% 5.7% 1.9%<br />
Source: Champaign-<strong>Urbana</strong> Urbanized Area Transportation Study (CUUATS), 2011 Report Card<br />
Prepared by the Champaign County Regional Planning Commission<br />
The total mileage <strong>of</strong> bike facilities, including shared-use an on-street paths, has increased 21 percent throughout the<br />
Champaign-<strong>Urbana</strong> area between 2009 and 2011. As per the 2011 CUUATS Report Card, there has been a 176 percent<br />
increase in on-street bike lanes in the past two years, indicating progress towards active transportation modes. Table 4<br />
below describes the miles <strong>of</strong> bicycle facilities in <strong>Urbana</strong> in the regional context. As per the 2010 ACS 1-year estimates, a<br />
majority <strong>of</strong> residents in the Champaign-<strong>Urbana</strong> urbanized area take less then 15 minutes to reach their place <strong>of</strong> work.<br />
TABLE 4. MILES OF BICYCLE FACILITIES IN THE CHAMPAIGN-URBANA REGION IN 2011<br />
Miles <strong>of</strong> Bicycle facilities - All (2011)<br />
Path Type <strong>Urbana</strong> Champaign Savoy Total<br />
Shared-Use Path (<strong>of</strong>f-street) 5.5 18.3 0.3 24.1<br />
Shared-Use Path (sidepath) 13.7 7.2 0.5 21.4<br />
Divided Shared-Use Path 0.0 4.6 0.0 4.6<br />
Bike Path 0.0 0.0 1.4 1.7<br />
UIUC Bike Path 4.4 1.8 0.0 6.2<br />
Bike Lanes (on-street) 4.9 7.4 0.7 13.1<br />
Shared Lane Markings 0.9 0.8 0.0 1.7<br />
(sharrows)<br />
Source: Champaign-<strong>Urbana</strong> Urbanized Area Transportation Study (CUUATS), 2011 Report Card<br />
Prepared by the Champaign County Regional Planning Commission<br />
<strong>City</strong> <strong>of</strong> <strong>Urbana</strong><br />
59
3.2<br />
GOAL 3:<br />
FORMULATE STRATEGIES TO REDUCE EMISSIONS FROM RENTAL AND<br />
INDUSTRIAL SECTORS<br />
Action 1: Form a task force to study special considerations for rental properties.<br />
Rental units make up about two thirds <strong>of</strong> <strong>Urbana</strong>’s housing units as well as a<br />
significant amount <strong>of</strong> commercial space. Improvements in residential rental units<br />
could contribute significantly to the Climate Action Plan goals.<br />
Associated Advantages<br />
1. Annual energy cost savings<br />
2. Improved air quality and health<br />
3. Green jobs<br />
4. Quality <strong>of</strong> life<br />
Attaining greenhouse gas reductions in rental units is complicated by the fact that<br />
utility bills are <strong>of</strong>ten the responsibility <strong>of</strong> the tenant, and there is little economic<br />
incentive to expend capital on energy efficiency for landlords or owners. Rental<br />
units are typically ineligible for incentive funds. This conflict has implications for<br />
housing affordability and quality <strong>of</strong> life.<br />
Rental properties are not defined as a category or sector in the greenhouse gas<br />
emissions inventory. Even so, there are special considerations related to greenhouse<br />
gas emissions strategies for rental properties, regardless <strong>of</strong> whether they<br />
fall into the residential or commercial sector.<br />
IMPLEMENTATION STRATEGIES<br />
Information and Outreach:<br />
1. Form a task force to study the special considerations <strong>of</strong> <strong>Urbana</strong>’s rental<br />
residential and commercial properties.<br />
2. Explore programs that can assist renters in making informed housing choices<br />
based on knowledge <strong>of</strong> rent, utilities and transportation costs <strong>of</strong> residential<br />
properties while allowing landlords to compete on true costs.<br />
IMPLEMENTATION PARTNERS<br />
• <strong>City</strong> <strong>of</strong> <strong>Urbana</strong>, <strong>Urbana</strong> Business<br />
Association (UBA), Champaign County<br />
Chamber <strong>of</strong> Commerce, Champaign<br />
<strong>Urbana</strong> Tenant Union<br />
• <strong>City</strong> <strong>of</strong> <strong>Urbana</strong>, Smart Energy Design<br />
Assistance Center (SEDAC), Center for<br />
Neighborhood Technology (CNT)<br />
Action 2: Form a task force to study special considerations for the industrial<br />
sector.<br />
Electric usage by the industrial sector is the fourth largest source <strong>of</strong> greenhouse<br />
gas emissions in <strong>Urbana</strong>, accounting for 16% <strong>of</strong> emissions. Because industrial processes<br />
vary, it is difficult to make a blanket recommendation for emissions reduction<br />
in this sector. In addition, there are implications for economic development<br />
that are tied to growth <strong>of</strong> the city’s industrial sector.<br />
IMPLEMENTATION STRATEGIES<br />
Information and Outreach:<br />
1. Form a task force <strong>of</strong> business owners, planning staff, SAC representatives, and<br />
energy efficiency subject matter experts to develop greenhouse gas reduction<br />
strategies for the industrial sector.<br />
IMPLEMENTATION PARTNERS<br />
• <strong>City</strong> <strong>of</strong> <strong>Urbana</strong>, <strong>Urbana</strong> Business<br />
Association (UBA), Champaign County<br />
Chamber <strong>of</strong> Commerce, Smart Energy<br />
Design Assistance Center (SEDAC),<br />
Illinois Green Business Association<br />
(IGBA), Champaign County Economic<br />
Development Council (CCEDC)<br />
<strong>City</strong> <strong>of</strong> <strong>Urbana</strong><br />
60
3.2<br />
GOAL 4:<br />
PREPARE FOR <strong>CLIMATE</strong> CHANGE IMPACTS<br />
Action 1: Form a task force to study special considerations for adapting to local<br />
climate change impacts.<br />
Goals 1, 2 and 3 outline strategies to mitigate the negative impacts <strong>of</strong> climate<br />
change by focusing on the sources <strong>of</strong> greenhouse gas emissions. These activities<br />
have the potential to create global and long-lasting positive environmental impact.<br />
However, effects <strong>of</strong> climate change are already observable in several regions in<br />
the U.S. and other countries. Therefore planning activities involving adjustments<br />
to natural and human systems in response to actual or anticipated impacts are<br />
vital components <strong>of</strong> a Climate Action Plan. These activities, known as adaptation<br />
activities, can mitigate risk and vulnerability in a community at a later date, in<br />
addition to having local and immediate benefits.<br />
The <strong>City</strong> should anticipate climate change sectors <strong>of</strong> high risk and should prepare<br />
for potential impacts. As a preliminary step, a task force should be created to<br />
study potential impacts in <strong>Urbana</strong> and advocate for the integration <strong>of</strong> sustainable<br />
development practices which will mitigate vulnerability and risk into infrastructure<br />
development programs.<br />
Associated Advantages<br />
1. Annual energy cost savings<br />
2. Improved air quality and health<br />
3. Green jobs<br />
4. Adaptation to climate change impact<br />
IMPLEMENTATION STRATEGIES<br />
Information and Outreach:<br />
1. Form a task force <strong>of</strong> planning staff, public works staff, the SAC, and other<br />
subject matter experts to study the special considerations for preparing for<br />
local climate change impacts.<br />
IMPLEMENTATION PARTNERS<br />
• <strong>City</strong> <strong>of</strong> <strong>Urbana</strong>, Champaign <strong>Urbana</strong><br />
Public Health District, University <strong>of</strong><br />
Illinois, Champaign County Regional<br />
Planning Commission (CCRPC), <strong>Urbana</strong> &<br />
Champaign Sanitary District<br />
<strong>City</strong> <strong>of</strong> <strong>Urbana</strong><br />
61
3.2<br />
GOAL 5:<br />
PURSUE COORDINATION AND OUTREACH<br />
Associated Advantages<br />
1. Annual energy cost savings<br />
2. Enhanced cooperation among diverse stakeholders<br />
3. Sharing infrastructure and resources in the community<br />
Coordination<br />
Action 1: Coordinate city plans and policies with climate action goals.<br />
In order to assist the <strong>City</strong> in reaching its greenhouse gas reduction goal, the Sustainability Advisory Commission will<br />
review and make recommendations on city plans. legislation, policies and projects, including:<br />
1. Comprehensive Plan updates<br />
2. Capital Improvement Plan<br />
3. Downtown Strategic Plan updates<br />
4. Ordinances related to building energy use, such as building codes<br />
5. Transportation projects<br />
6. Major land-use and development issues<br />
7. <strong>City</strong> and regional transportation plans including the Long Range Transportation Plan<br />
8. Bicycle and Pedestrian Master Plan<br />
9. Greenways and Trails Plan<br />
10. Subdivision and Land Development Code<br />
11. Other policies, plans and ordinances whose content relates to greenhouse gas emissions, including but not limited to<br />
transportation, economic development and land use.<br />
IMPLEMENTATION STRATEGIES<br />
IMPLEMENTATION PARTNERS<br />
1. Establish a communication protocol for SAC coordination <strong>of</strong> <strong>City</strong> plans and<br />
policies.<br />
2. Form an Inter-Departmental <strong>City</strong> Green team to coordinate sustainability and<br />
climate action activities in an integrated and efficient manner.<br />
• <strong>City</strong> <strong>of</strong> <strong>Urbana</strong><br />
• <strong>City</strong> <strong>of</strong> <strong>Urbana</strong><br />
Information and Outreach<br />
Action 2: Encourage energy efficient behavior and individual actions.<br />
In addition to Goals 1,2, 3 which have the potential to produce significant greenhouse gas reductions, there are<br />
numerous steps that we can all take to reduce emissions. These actions largely relate to energy efficiency and consumer<br />
choices. They cover a wide range <strong>of</strong> options such as thermostat settings, local purchases, water conservation and<br />
lighting choices. Collectively such activity will be an important part <strong>of</strong> achieving the overall goals. Educational and other<br />
assistance on such options should be made available to building owners and occupants.<br />
Action 3: Encourage energy efficiency in new developments.<br />
When planning and constructing new developments, construction methods, technologies and materials allow for the<br />
integration <strong>of</strong> a high degree <strong>of</strong> energy efficiency in the building structure. Ensuring that such methods and technologies are<br />
employed will help mitigate negative impacts <strong>of</strong> growth. Planning processes should focus on these critical opportunities.<br />
Action 4: Encourage participation in existing sustainability programs.<br />
The <strong>City</strong> <strong>of</strong> <strong>Urbana</strong> and the wider community is currently invested in several sustainability focused programs and<br />
activities. It is a climate action priority to encourage greater participation in these programs.<br />
<strong>City</strong> <strong>of</strong> <strong>Urbana</strong><br />
62
3.2<br />
GOAL 5:<br />
PURSUE COORDINATION AND OUTREACH<br />
IMPLEMENTATION STRATEGIES<br />
IMPLEMENTATION PARTNERS<br />
1. Partner with Neighborhood Associations and stakeholders in the construction,<br />
business and industrial sectors to identify specific barriers to participation in<br />
climate action activities and areas for integration <strong>of</strong> economic development goals<br />
in climate action goals.<br />
2. Seek opportunities to collaborate on climate action events and programs with<br />
<strong>Urbana</strong> School District 116.<br />
3. Publicize and encourage participation in existing programs.<br />
• <strong>City</strong> <strong>of</strong> <strong>Urbana</strong>, United Citizens<br />
and Neighbors (UCAN), Downtown<br />
Neighborhood Association (DNA),<br />
North Broadway Neighbors (NBN), West<br />
<strong>Urbana</strong> Neighborhood Association<br />
(WUNA), Historic East <strong>Urbana</strong><br />
Neighborhood Association (HEUNA),<br />
Lierman Neighborhood Action<br />
Committee (LNAC), Southeast <strong>Urbana</strong><br />
Neighborhood Association (SUNA),<br />
AmVets II Neighborhood Association,<br />
<strong>Urbana</strong> Community Alternative Policing<br />
(UCAP), UBA, IGBA<br />
• <strong>City</strong> <strong>of</strong> <strong>Urbana</strong>, <strong>Urbana</strong> School District<br />
116<br />
• <strong>City</strong> <strong>of</strong> <strong>Urbana</strong><br />
Monitor Progress<br />
Action 5: Monitor progress towards climate action goals.<br />
Monitoring progress on various activities and gathering information on the effectiveness <strong>of</strong> various strategies is the critical<br />
component to achieving the 25 percent greenhouse gas emissions reduction target.<br />
IMPLEMENTATION STRATEGIES<br />
IMPLEMENTATION PARTNERS<br />
1. Define indicators to measure progress towards climate action goals.<br />
2. Monitor progress by conducting an emissions inventory at two year intervals.<br />
3. Review briefs on aspects <strong>of</strong> emissions accounting associated with municipal<br />
electric aggregation.<br />
• <strong>City</strong> <strong>of</strong> <strong>Urbana</strong><br />
• <strong>City</strong> <strong>of</strong> <strong>Urbana</strong><br />
• <strong>City</strong> <strong>of</strong> <strong>Urbana</strong><br />
ADDITIONAL RECOMMENDATIONS:<br />
1. Create a unified online public forum for the Climate Action Plan to facilitate access to information regarding incentives, best<br />
practices, existing programs and climate action events for residents and business owners.<br />
2. Develop an online public engagement platform, to sustain community-wide conversation regarding climate action in <strong>Urbana</strong>.<br />
3. Design and implement an energy efficiency challenge to motivate residents to save energy.<br />
4. Coordinate emissions inventories with regional land-use and transportation planning processes.<br />
5. Advocate required reporting <strong>of</strong> solid waste and energy consumption data in Illinois.<br />
<strong>City</strong> <strong>of</strong> <strong>Urbana</strong><br />
63
3.3 CONSOLIDATED IMPLEMENTATION TABLE<br />
Implementation Strategies Category <strong>of</strong> Strategy Priority Potential Partners<br />
REDUCE EMISSIONS FROM BUILDING ENERGY CONSUMPTION<br />
Goal 1<br />
Energy Efficiency 1 <strong>City</strong> <strong>of</strong> <strong>Urbana</strong>, SEDAC, ISTC, Ameren Illinois, IGBA, UBA<br />
Action 1 Reduce Emissions from Commercial Sector Building Electric Consumption<br />
1 Facilitate access and increase the impact <strong>of</strong> existing technical assistance and incentive<br />
programs. Technical assistance is available from organizations like the Smart Energy<br />
Design and Assistance Center (SEDAC) and the Illinois Sustainable Technology Center<br />
(ISTC), at the University <strong>of</strong> Illinois at <strong>Urbana</strong>-Champaign, and the Ameren Act On Energy<br />
Program.<br />
Energy Efficiency 3 <strong>City</strong> <strong>of</strong> <strong>Urbana</strong> , IGBA, UBA<br />
2 Create programs to encourage businesses to retr<strong>of</strong>it existing buildings and purchase<br />
energy star appliances.<br />
3 Identifiy additional sources <strong>of</strong> funding to leverage existing resources Financial 1 <strong>City</strong> <strong>of</strong> <strong>Urbana</strong><br />
4 Organize education programs, create an information platform and organize site visits to completed projects in the community to highlight best practices and facilitate access to<br />
existing sources <strong>of</strong> expertise in the community.<br />
Information and Outreach 1 <strong>City</strong> <strong>of</strong> <strong>Urbana</strong>, USGBC-IL, CCNet, ISTC<br />
Information and Outreach 2 <strong>City</strong> <strong>of</strong> <strong>Urbana</strong>, UBA, Champaign County Chamber <strong>of</strong> Commerce, CCEDC<br />
Renewable Energy 1 <strong>City</strong> <strong>of</strong> <strong>Urbana</strong><br />
5 Identify specific barriers through focus groups and surveys in the local business and<br />
commercial community.<br />
Action 2 Reduce Emissions from Residential Sector Building Electric Consumption<br />
1 Facilitate the use <strong>of</strong> Renewable Energy Certificates (RECs) through municipal electric<br />
aggregation. This alone can result in a major beneficial impact by helping <strong>Urbana</strong> achieve<br />
32% <strong>of</strong> its 2020 emissions reduction goal.<br />
Renewable Energy 1 <strong>City</strong> <strong>of</strong> <strong>Urbana</strong><br />
2 Work towards maintaining purchase <strong>of</strong> clean renewable energy through municipal<br />
electric aggregation over a long-term horizon through discussions with Utility companies,<br />
the <strong>City</strong> <strong>of</strong> Champaign and the University <strong>of</strong> Illinois.<br />
Energy Efficiency 3 <strong>City</strong> <strong>of</strong> <strong>Urbana</strong>, SEDAC, Ameren Illinois, ISTC<br />
3 Create programs to encourage residents to retr<strong>of</strong>it existing buildings and purchase<br />
energy star appliances.<br />
4 Identifiy additional sources <strong>of</strong> funding to leverage existing resources. Financial 1 <strong>City</strong> <strong>of</strong> <strong>Urbana</strong><br />
5 Organize education programs, create an information platform and organize site visits to completed projects in the community to highlight best practices and facilitate access to<br />
existing sources <strong>of</strong> expertise in the community.<br />
Information and Outreach 1 <strong>City</strong> <strong>of</strong> <strong>Urbana</strong>, USGBC-IL, CCNet, ISTC<br />
6 Identify specific barriers through focus groups and surveys in the local community. Information and Outreach 2 <strong>City</strong> <strong>of</strong> <strong>Urbana</strong><br />
Action 3 Reduce Emissions from Residential Sector Building Natural Gas Consumption<br />
1 Seek additional funding to continue <strong>Urbana</strong>’s weatherization program. Financial 1 <strong>City</strong> <strong>of</strong> <strong>Urbana</strong>, SEDAC, ISTC, Ameren Illinois, U.S. Department <strong>of</strong> Energy<br />
Information and Outreach 1 <strong>City</strong> <strong>of</strong> <strong>Urbana</strong>, SEDAC<br />
2 Launch a campaign to encourage residents to use programmable thermostats with<br />
appropriate settings and implement simple weatherization techniques.<br />
Information and Outreach 1 <strong>City</strong> <strong>of</strong> <strong>Urbana</strong>, SEDAC, USGBC-IL, CCNet, ISTC<br />
3 Organize education programs, create an information platform and organize site visits to<br />
completed projects in the community to highlight best practices and facilitate access to<br />
existing sources <strong>of</strong> expertise in the community.<br />
4 Identify specific barriers through focus groups and surveys in the local community. Information and Outreach 2 <strong>City</strong> <strong>of</strong> <strong>Urbana</strong><br />
Acronyms used:<br />
ISTC: Illinois Sustainable Technology Center IGBA: Illinois Green Business Association<br />
CCEDC: Champaign County Economic Development Corporation CCNet: Champaign County Sustainability Network<br />
CCRPC: Champaign County Regional Planning Commission CNT: Center for Neighborhood Technology<br />
CUUATS: Champaign <strong>Urbana</strong> Urbanized Traffic Study CUMTD: Champaign-<strong>Urbana</strong> Mass Transit District<br />
SEDAC: Smart Energy Design Assistance Center UBA: <strong>Urbana</strong> Business Association<br />
USGBC-IL: U.S. Green Building Council Central Illinois Branch<br />
<strong>City</strong> <strong>of</strong> <strong>Urbana</strong><br />
64
3.3 CONSOLIDATED IMPLEMENTATION TABLE<br />
Implementation Strategies Category <strong>of</strong> Strategy Priority Potential Partners<br />
Goal 2<br />
REDUCE EMISSIONS FROM GASOLINE CONSUMPTION<br />
Action 1 Action 2 Action 3 Action 4 1 Support sustainable transportation through infrastructure improvements.<br />
Promote a culture <strong>of</strong> sustainable transportation.<br />
Encourage participation in sustainable transportation programs.<br />
Consider transportation sector emissions projections in land-use planning decisions.<br />
Pursue bicycle and pedestrian infrastructure improvements. Energy Efficiency 1 <strong>City</strong> <strong>of</strong> <strong>Urbana</strong>, CUUATS, CUMTD<br />
2 Pursue the development <strong>of</strong> energy-efficient transportation infrastructure such as<br />
modern roundabouts and other yield-controlled intersections, and speed control and<br />
traffic-calming measures.<br />
3 Implment recommendations from the 2010 <strong>Urbana</strong> Bicycle Master Plan, the 2009 Long<br />
Range Transportation Plan, and the 2004 Champaign County Greenways and Trails Plan.<br />
Energy Efficiency 2 <strong>City</strong> <strong>of</strong> <strong>Urbana</strong>, CUUATS, CUMTD<br />
Existing Plans 2 <strong>City</strong> <strong>of</strong> <strong>Urbana</strong>,CUUATS, CCRPC<br />
4 Provide and promote education on safe bicycling practices, and for motorists, bicyclists<br />
and pedestrians to share the road.<br />
Information and Outreach 1 <strong>City</strong> <strong>of</strong> <strong>Urbana</strong>, <strong>Urbana</strong> Bicycle and Pedestrian Advisory Committee, Champaign<br />
County Bikes, CUMTD<br />
5 Promote energy efficient driving techniques. Information and Outreach 1 <strong>City</strong> <strong>of</strong> <strong>Urbana</strong>, <strong>Urbana</strong> Bicycle and Pedestrian Advisory Committee, Champaign<br />
County Bikes, CUMTD<br />
6 Encourage residents to use walking or bicycling for at least a part <strong>of</strong> their weekly<br />
transportation needs.<br />
Information and Outreach 2 <strong>City</strong> <strong>of</strong> <strong>Urbana</strong>, <strong>Urbana</strong> Bicycle and Pedestrian Advisory Committee, Champaign<br />
County Bikes, CUMTD<br />
7 Pursue local government actions recommended in the State <strong>of</strong> Illinois Electric Vehicle<br />
Advisory Council Report published in December 2011. See Appendix G for a<br />
comprehensive list <strong>of</strong> recommendations.<br />
8 Collaborate with local business and institutions to create programs encouraging shared<br />
commuting, car-share, bike-share and bike purchase programs.<br />
Information and Outreach 3 <strong>City</strong> <strong>of</strong> <strong>Urbana</strong><br />
Information and Outreach 2 <strong>City</strong> <strong>of</strong> <strong>Urbana</strong>, UIUC, <strong>City</strong> <strong>of</strong> Champaign,CCRPC, CUMTD<br />
9 Identify specific barriers to adopting more active and energy-efficient transportation<br />
behaviors through focus groups and surveys, and provide information and resources to<br />
help overcome these barriers.<br />
Information and Outreach 1 <strong>City</strong> <strong>of</strong> <strong>Urbana</strong><br />
Implementation Strategies Category <strong>of</strong> Strategy Priority Potential Partners<br />
Goal 3<br />
FORMULATE STRATEGIES TO REDUCE EMISSIONS FROM RENTAL AND INDUSTRIAL SECTORS<br />
Action 1<br />
Form a Task Force to study special considerations for Rental Properties.<br />
1 Form a task force to study the special considerations <strong>of</strong> <strong>Urbana</strong>’s rental residential and<br />
commercial properties.<br />
Information and Outreach 1 <strong>City</strong> <strong>of</strong> <strong>Urbana</strong>, UBA, Champaign County Chamber <strong>of</strong> Commerce, Champaign <strong>Urbana</strong><br />
Tenant Union<br />
2 Explore programs that can assist renters in making informed housing choices based on<br />
knowledge <strong>of</strong> rent, utilities and transportation costs <strong>of</strong> residential properties while<br />
allowing landlords to compete on true costs.<br />
Information and Outreach 2 <strong>City</strong> <strong>of</strong> <strong>Urbana</strong>, SEDAC, CNT<br />
Action 2<br />
Form a Task Force to study special considerations for the Industrial Sector.<br />
1 Form a task force <strong>of</strong> business owners, planning staff, SAC representatives, and energy<br />
efficiency subject matter experts to develop greenhouse gas reduction strategies for the<br />
industrial sector.<br />
Information and Outreach 1 <strong>City</strong> <strong>of</strong> <strong>Urbana</strong>, UBA, Champaign County Chamber <strong>of</strong> Commerce, SEDAC, IGBA, CCEDC<br />
<strong>City</strong> <strong>of</strong> <strong>Urbana</strong><br />
65
3.3 CONSOLIDATED IMPLEMENTATION TABLE<br />
Implementation Strategies Category <strong>of</strong> Strategy Priority Potential Partners<br />
PREPARE FOR <strong>CLIMATE</strong> CHANGE IMPACTS<br />
Goal 4<br />
Action 1 Form a Task Force to study special considerations for preparing for local climate change impacts.<br />
1 Form a task force <strong>of</strong> planning staff, public works staff, the SAC, and other subject matter experts to study the special considerations for preparing for local climate change<br />
impacts.<br />
Information and Outreach 1 <strong>City</strong> <strong>of</strong> <strong>Urbana</strong>, Champaign <strong>Urbana</strong> Public Health District, University <strong>of</strong> Illinois,<br />
Champaign County Regional Planning Commission, <strong>Urbana</strong> & Champaign Sanitary<br />
District<br />
PURSUE COORDINATION AND OUTREACH<br />
Goal 5<br />
Action 1 Sustainability Advisory Commission coordination <strong>of</strong> <strong>City</strong> Plans and Policies.<br />
1 Establish a communication protocol for SAC coordination <strong>of</strong> <strong>City</strong> plans and policies. Coordination 1 <strong>City</strong> <strong>of</strong> <strong>Urbana</strong><br />
Coordination 1 <strong>City</strong> <strong>of</strong> <strong>Urbana</strong><br />
2 Form an Inter-Departmental <strong>City</strong> Green team to coordinate sustainability and climate<br />
action activities in an integrated and efficient manner.<br />
Encourage energy efficient behavior and individual actions.<br />
Encourage energy efficiency in new developments.<br />
Action 2<br />
Action 3<br />
Encourage participation in existing sustainability programs.<br />
Action 4<br />
Information and Outreach 1 <strong>City</strong> <strong>of</strong> <strong>Urbana</strong>, United Citizens and Neighbors (UCAN), Downtown Neighborhood<br />
Association (DNA), North Broadway Neighbors (NBN), West <strong>Urbana</strong> Neighborhood<br />
Association (WUNA), Historic East <strong>Urbana</strong> Neighborhood Association (HEUNA),<br />
Lierman Neighborhood Action Committee (LNAC), Southeast <strong>Urbana</strong> Neighborhood<br />
Association (SUNA), AmVets II Neighborhood Association, <strong>Urbana</strong> Community<br />
Alternative Policing (UCAP), UBA, IGBA<br />
1 Partner with Neighborhood Associations and stakeholders in the construction, business<br />
and industrial sectors to identify specific barriers to participation in Climate Action<br />
activities and areas for integration <strong>of</strong> economic development goals in climate action<br />
goals.<br />
Information and Outreach 3 <strong>City</strong> <strong>of</strong> <strong>Urbana</strong>, <strong>Urbana</strong> School District 116<br />
2 Seek opportunities to collaborate on Climate Action events and programs with <strong>Urbana</strong><br />
School District 116.<br />
3 Publicize and encourage participation in existing programs. Information and Outreach 2 <strong>City</strong> <strong>of</strong> <strong>Urbana</strong><br />
Action 5 Monitor progress on climate action goals.<br />
1 Define indicators to measure progress towards climate action goals. Monitoring 1 <strong>City</strong> <strong>of</strong> <strong>Urbana</strong><br />
2 Monitor progress by conducting an emissions inventory at two year intervals. Monitoring 1 <strong>City</strong> <strong>of</strong> <strong>Urbana</strong><br />
Monitoring 2 <strong>City</strong> <strong>of</strong> <strong>Urbana</strong><br />
3 Receive briefs on aspects <strong>of</strong> emissions accounting associated with municipal electric<br />
aggregation.<br />
Acronyms used:<br />
ISTC: Illinois Sustainable Technology Center IGBA: Illinois Green Business Association<br />
CCEDC: Champaign County Economic Development Corporation CCNet: Champaign County Sustainability Network<br />
CCRPC: Champaign County Regional Planning Commission CNT: Center for Neighborhood Technology<br />
CUUATS: Champaign <strong>Urbana</strong> Urbanized Traffic Study CUMTD: Champaign-<strong>Urbana</strong> Mass Transit District<br />
SEDAC: Smart Energy Design Assistance Center UBA: <strong>Urbana</strong> Business Association<br />
USGBC-IL: U.S. Green Building Council Central Illinois Branch<br />
<strong>City</strong> <strong>of</strong> <strong>Urbana</strong><br />
66
3.4 FUTURE STEPS AND CHALLENGES TO <strong>CLIMATE</strong> <strong>ACTION</strong><br />
Over the next two years from the <strong>City</strong> Council’s adoption <strong>of</strong> Phase I, the strategies identified in this plan will be<br />
implemented and their effectiveness will be assessed through conversations with community organizations and resident<br />
groups, interviews with key stakeholders, surveys and public input sessions. Based on data gathered over the next<br />
two years, a Phase II document will be written defining additional strategies to take the <strong>City</strong> the rest <strong>of</strong> the way to its<br />
greenhouse gas emission reduction goal.<br />
Successful implementation <strong>of</strong> the <strong>Urbana</strong> Climate Action Plan will have to negotiate a number <strong>of</strong> challenges that can<br />
make achieving the plan’s goals difficult:<br />
FUNDING<br />
Identifying sources <strong>of</strong> funding for the plan’s implementation strategies in an uncertain economic condition. <strong>Urbana</strong><br />
is fortunate to have a number <strong>of</strong> institutions already addressing greenhouse gas emissions that can be utilized to<br />
implement the plan’s strategies. Many <strong>of</strong> these are listed in the plan’s implementation table. Furthermore, the <strong>City</strong> will<br />
pursue grant opportunities to fund the plan’s implementation strategies.<br />
BALANCING LOCAL GOVERNMENT PRIORITIES<br />
Local governments have a great number <strong>of</strong> priorities and obligations in their service to residents. Implementation <strong>of</strong> the<br />
Climate Action Plan will be most successful where the actions can be tailored to create co-benefits serving additional<br />
local government priorities.<br />
REGIONAL COLLABORATION<br />
Regional Collaboration represents both opportunity and challenge. It’s understood that when municipalities, agencies,<br />
and organizations collaborate on efforts <strong>of</strong> mutual concern, they take advantage <strong>of</strong> economies <strong>of</strong> scale and avoid working<br />
at cross purposes. However, in practice, regional collaboration is very difficult as the parties have to negotiate varying<br />
priorities, resources, and publics. <strong>Urbana</strong>’s Climate Action Plan will be benefit from engaging potential partners early,<br />
<strong>of</strong>ten, and face to face.<br />
DETERMINING BARRIERS TO ADOPTING SUSTAINABLE BEHAVIORS<br />
Research has shown that adopting sustainable behaviors requires more than simply posting information on a website.<br />
The <strong>City</strong> will need to seek out existing research or conduct our own research to determine the most effective means to<br />
engage residents in sustainable behaviors through community-based social marketing strategies such as commitments,<br />
social diffusion, prompts, norms, and communication.<br />
DATA COLLECTION<br />
Timely, comprehensive, and detailed data is necessary for tuning implementation strategies and judging the results <strong>of</strong><br />
actions undertaken. Sometimes, reliable data does not exist. But where it does exist, it can be time consuming to collect<br />
and analyze. Furthermore, data necessary to plan climate action implementation strategies <strong>of</strong>ten resides with many<br />
different agencies and companies with varying degrees <strong>of</strong> privacy regarding the sharing <strong>of</strong> data. The <strong>City</strong> will benefit<br />
from developing partnerships with data suppliers that appropriate types <strong>of</strong> data are supplied in regular intervals.<br />
<strong>City</strong> <strong>of</strong> <strong>Urbana</strong><br />
67
4. APPENDICES<br />
4.1 Table <strong>of</strong> Figures<br />
4.2 Table <strong>of</strong> Tables<br />
4.3 Acronyms and Abbreviations<br />
4.4 Appendix A: U.S. Mayors Climate Protection Agreement<br />
Appendix B: Sources and Warming Potentials <strong>of</strong> Greenhouse Gases<br />
Appendix C: 2010 Public Input Survey Results<br />
Appendix D: Public Input Form<br />
Appendix E: CACP Greenhouse Gas Emissions Factors<br />
Appendix F: Population, Employment and Transportation Growth Projections for 2020<br />
Appendix G: State <strong>of</strong> Illinois Electric Vehicle Advisory Council Report Recommendations<br />
Appendix H: $ 1,000 Energy Challenge: Low or No Cost Actions You Can Take<br />
Appendix J: Energy and Emissions Flow Diagrams<br />
Appendix K: <strong>Urbana</strong> <strong>City</strong> Council Resolution Adopting the Phase I Climate Action Plan<br />
<strong>City</strong> <strong>of</strong> <strong>Urbana</strong><br />
69
4.1 TABLE OF FIGURES<br />
FIGURE 1.<br />
FIGURE 2.<br />
PROPOSED URBANA <strong>CLIMATE</strong> <strong>ACTION</strong> TIMELINE<br />
HEAT-TRAPPING GASES<br />
10<br />
12<br />
FIGURE 3. CHAMPAIGN COUNTY ELECTRONICS RECYCLED (2007-2011)<br />
FIGURE 4. CHAMPAIGN COUNTY MUNICIPAL WASTE STREAM (2010)<br />
30<br />
30<br />
FIGURE 5.<br />
FIGURE 6.<br />
FIGURE 7.<br />
2008 UNIVERSITY OF ILLINOIS CARBON INVENTORY: BASELINE<br />
CAMPUS FOOTPRINT BY GHG EMISSIONS CONTRIBUTORS<br />
ICLEI AND CCP’S 5 STEP GHG REDUCTION PROCESS<br />
URBANA’S 2007 BASELINE COMMUNITY GREENHOUSE GAS EMISSIONS REPORT<br />
BY SOURCE<br />
31<br />
36<br />
39<br />
FIGURE 8. COMMUNITY GREENHOUSE GAS EMISSIONS PER CAPITA FOR URBANA AND 19<br />
U.S. CITIES AS COMPARED TO THE U.S. AVERAGE, EXCLUDING INDUSTRIAL AND<br />
WASTE SECTOR EMISSIONS<br />
41<br />
FIGURE 9.<br />
FIGURE 10.<br />
FIGURE 11.<br />
FIGURE 12.<br />
FIGURE 13.<br />
FIGURE 14.<br />
FIGURE 15.<br />
FIGURE 16.<br />
FIGURE 17.<br />
2007 BASELINE EMISSIONS AND PROJECTED 2020 INCREASE IN<br />
EMISSIONS UNDER A BUSINESS AS USUAL SCENARIO, BY SECTOR<br />
AND SOURCE<br />
URBANA 2020 - 25% EMISSIONS REDUCTION GOAL<br />
EXAMPLES OF GREENHOUSE GAS REDUCTION TARGETS ACROSS<br />
THE U.S.<br />
TRENDS IN THE SOURCES OF ELECTRICITY SUPPLIED FOR AMEREN ILLINOIS<br />
AND RELATED AVERAGE AMOUNTS OF EMISSIONS AND NUCLEAR WASTE<br />
CREATED PER 1000 KILOWATT-HOURS (KWHS) PRODUCED FROM KNOWN<br />
SOURCES<br />
A POSSIBLE RENEWABLE ENERGY CERTIFICATE (REC) TRANS<strong>ACTION</strong><br />
PATH IN A VOLUNTARY GREEN POWER MARKET<br />
CITY OF URBANA 2007 BASELINE GREENHOUSE GAS EMISSIONS RANK BY<br />
SOURCE AND SECTOR<br />
SELECTED COMMUNITY-WIDE <strong>ACTION</strong>S’ CONTRIBUTION TOWARDS REACHING<br />
EMISSIONS REDUCTION TARGETS<br />
RESIDENTIAL BUILDING ENERGY EMISSIONS SOURCES<br />
COMMERCIAL BUILDING ENERGY EMISSIONS SOURCES<br />
42<br />
43<br />
43<br />
45<br />
47<br />
51<br />
52<br />
57<br />
57<br />
<strong>City</strong> <strong>of</strong> <strong>Urbana</strong><br />
70
4.2 TABLE OF TABLES<br />
TABLE 1.<br />
TABLE 2.<br />
TABLE 3.<br />
TABLE 4.<br />
SECTION 3.3<br />
URBANA’S 2007 BASELINE COMMUNITY GREENHOUSE GAS EMISSIONS<br />
REPORT BY SECTOR<br />
URBANA’S 2020 PROJECTED COMMUNITY GREENHOUSE GAS<br />
INVENTORY COMPARED WITH THE 2007 BASELINE INVENTORY<br />
COMMUTING TO WORK TRANSPORTATION MODES IN THE<br />
CHAMPAIGN-URBANA REGION IN 2010<br />
MILES OF BICYCLE FACILITIES IN THE CHAMPAIGN-URBANA REGION<br />
IN 2011<br />
CONSOLIDATED IMPLEMENTATION STRATEGIES TABLES<br />
39<br />
42<br />
59<br />
59<br />
64<br />
<strong>City</strong> <strong>of</strong> <strong>Urbana</strong><br />
71
4.3<br />
ACRONYMS AND ABBREVIATIONS<br />
ACS<br />
ARRA<br />
CACP<br />
CAGR<br />
CAPPA<br />
CCD<br />
CCEDC<br />
CCNet<br />
CCP<br />
CCRPC<br />
CDD<br />
CFL<br />
CNG<br />
CNT<br />
CUMTD<br />
CUUATS<br />
D.O.E.<br />
DNA<br />
EECBG<br />
GDP<br />
GHG<br />
GWP<br />
H.U.D.<br />
HDD<br />
HEUNA<br />
HMP<br />
iCAP<br />
ICLEI<br />
IGBA<br />
IPCC<br />
ISTC<br />
KWH<br />
LED<br />
LEED<br />
LNAC<br />
LRC<br />
LRTP<br />
MtCO2 e<br />
MWh<br />
NBN<br />
REC<br />
SAC<br />
SEDAC<br />
SUNA<br />
TAZ<br />
U.S. E.P.A.<br />
U.S.G.B.C-IL<br />
UBA<br />
UCAN<br />
UCAP<br />
UNEP<br />
UNFCC<br />
VMT<br />
WMO<br />
WUNA<br />
American Community Survey<br />
American Recovery and Reinvestment Act<br />
Clean Air and Climate Protection S<strong>of</strong>tware<br />
Compound Annual Growth Rate<br />
Climate and Air Pollution Planning Assistant<br />
Campus Commercial District<br />
Champaign County Economic Development Corporation<br />
Champaign County Sustainability Network<br />
Cities for Climate Protection Campaign<br />
Champaign County Regional Planning Commission<br />
Cooling Degree Days<br />
Compact Fluorescent Light Bulb<br />
Compressed Natural Gas<br />
Center for Neighborhood Technology<br />
Champaign-<strong>Urbana</strong> Mass Transit District<br />
Champaign-<strong>Urbana</strong> Urbanized Area Transportation Study<br />
U.S. Department <strong>of</strong> Energy<br />
Downtown Neighborhood Association<br />
Energy Efficiency Community Block Grant<br />
Gross Domestic Product<br />
Greenhouse Gas<br />
Global Warming Potential<br />
Department <strong>of</strong> Housing and Urban Development<br />
Heating Degree Days<br />
Historic East <strong>Urbana</strong> Neighborhood Association<br />
Hazard Mitigation Plan<br />
University <strong>of</strong> Illinois Climate Action Plan<br />
International Council for Local Government Initiatives<br />
Illinois Green Business Association<br />
Intergovernmental Panel on Climate Change<br />
Illinois Sustainable Technology Center<br />
Kilowatt-hour<br />
Light Emitting Diode<br />
Leadership in Energy and Environmental Design<br />
Lierman Neighborhood Action Committee<br />
Landscape Recycling Center<br />
Long Range Transportation Plan<br />
Metric Tonnes <strong>of</strong> Carbon Dioxide equivalent<br />
Megawatt-hour<br />
North Broadway Neighbors<br />
Renewable Energy Certificates<br />
<strong>City</strong> <strong>of</strong> <strong>Urbana</strong> Sustainability Advisory Commission<br />
Smart Energy Design Assistance Center<br />
Southeast <strong>Urbana</strong> Neighborhood Association<br />
Traffic Analysis Zone<br />
U.S. Environmental Protection Agency<br />
U.S. Green Building Council Illinois Branch<br />
<strong>Urbana</strong> Business Association<br />
United Citizens and Neighbors<br />
<strong>Urbana</strong> Community Alternative Policing<br />
United Nations Environmental Project<br />
United Nations Framework Convention on Climate Change<br />
Vehicle Miles Travelled<br />
World Meteorological Organization<br />
West <strong>Urbana</strong> Neighborhood Association<br />
<strong>City</strong> <strong>of</strong> <strong>Urbana</strong><br />
72
4.4<br />
APPENDIX A: U.S. MAYORS <strong>CLIMATE</strong> PROTECTION AGREEMENT<br />
The U.S. Mayors Climate Protection Agreement<br />
(As endorsed by the 73 rd Annual U.S. Conference <strong>of</strong> Mayors meeting, Chicago, 2005)<br />
A. We urge the federal government and state governments to enact policies and programs<br />
to meet or beat the target <strong>of</strong> reducing global warming pollution levels to 7 percent<br />
below 1990 levels by 2012, including efforts to: reduce the United States’ dependence<br />
on fossil fuels and accelerate the development <strong>of</strong> clean, economical energy resources<br />
and fuel-efficient technologies such as conservation, methane recovery for energy<br />
generation, waste to energy, wind and solar energy, fuel cells, efficient motor vehicles,<br />
and bi<strong>of</strong>uels;<br />
B. We urge the U.S. Congress to pass bipartisan greenhouse gas reduction legislation that<br />
1) includes clear timetables and emissions limits and 2) a flexible, market-based system<br />
<strong>of</strong> tradable allowances among emitting industries; and<br />
C. We will strive to meet or exceed Kyoto Protocol targets for reducing global warming<br />
pollution by taking actions in our own operations and communities such as:<br />
1. Inventory global warming emissions in <strong>City</strong> operations and in the community,<br />
set reduction targets and create an action plan.<br />
2. Adopt and enforce land-use policies that reduce sprawl, preserve open space,<br />
and create compact, walkable urban communities;<br />
3. Promote transportation options such as bicycle trails, commute trip reduction<br />
programs, incentives for car pooling and public transit;<br />
4. Increase the use <strong>of</strong> clean, alternative energy by, for example, investing in<br />
“green tags”, advocating for the development <strong>of</strong> renewable energy resources,<br />
recovering landfill methane for energy production, and supporting the use <strong>of</strong><br />
waste to energy technology;<br />
5. Make energy efficiency a priority through building code improvements,<br />
retr<strong>of</strong>itting city facilities with energy efficient lighting and urging employees to<br />
conserve energy and save money;<br />
6. Purchase only Energy Star equipment and appliances for <strong>City</strong> use;<br />
7. Practice and promote sustainable building practices using the U.S. Green<br />
Building Council's LEED program or a similar system;<br />
8. Increase the average fuel efficiency <strong>of</strong> municipal fleet vehicles; reduce the<br />
number <strong>of</strong> vehicles; launch an employee education program including antiidling<br />
messages; convert diesel vehicles to bio-diesel;<br />
9. Evaluate opportunities to increase pump efficiency in water and wastewater<br />
systems; recover wastewater treatment methane for energy production;<br />
10. Increase recycling rates in <strong>City</strong> operations and in the community;<br />
11. Maintain healthy urban forests; promote tree planting to increase shading<br />
and to absorb CO2; and<br />
12. Help educate the public, schools, other jurisdictions, pr<strong>of</strong>essional associations,<br />
business and industry about reducing global warming pollution.<br />
<strong>City</strong> <strong>of</strong> <strong>Urbana</strong><br />
73
4.4 APPENDIX B: SOURCES AND WARMING POTENTIALS OF GREENHOUSE GASES<br />
Global Warming<br />
Potential (100 -year)*<br />
Emissions and Trends Main Sources <strong>of</strong> Emission Lifetime in Atmosphere<br />
Chemical<br />
Formula<br />
Green House Gas<br />
(i) Electricity: The combustion <strong>of</strong> fossil fuels to generate electricity is the largest single source <strong>of</strong> CO2 emissions in the nation,<br />
accounting for about 40% <strong>of</strong> total U.S. CO2 emissions and 33% <strong>of</strong> total U.S. greenhouse gas emissions in 2009. The type <strong>of</strong> fossil<br />
fuel used to generate electricity will emit different amounts <strong>of</strong> CO2. To produce a given amount <strong>of</strong> electricity, burning coal will<br />
produce more CO2 than oil or natural gas.<br />
(ii) Transportation: The combustion <strong>of</strong> fossil fuels. such as gasoline and diesel to transport people and goods is the second largest<br />
source <strong>of</strong> CO2 emissions, accounting for about 31% <strong>of</strong> total U.S. CO2 emissions and 26% <strong>of</strong> total U.S. greenhouse gas emissions in<br />
2010. This category includes transportation sources such as highway vehicles, air travel, marine transportation, and rail.<br />
(iii) Industry: Many industrial processes emit CO2 through fossil fuel combustion. Several processes also produce CO2 emissions<br />
through chemical reactions that do not involve combustion, for example, the production and consumption <strong>of</strong> mineral products<br />
such as cement, the production <strong>of</strong> metals such as iron and steel, and the production <strong>of</strong> chemicals. Various industrial processes<br />
accounted for about 14% <strong>of</strong> total U.S. CO2 emissions and 20% <strong>of</strong> total U.S. greenhouse gas emissions in 2010.<br />
(CO2) is the primary greenhouse gas emitted through human activities. In 2010, CO2 accounted for about 84% <strong>of</strong> all U.S.<br />
greenhouse gas emissions from human activities. Carbon dioxide is naturally present in the atmosphere as part <strong>of</strong> the Earth's<br />
carbon cycle (the natural circulation <strong>of</strong> carbon among the atmosphere, oceans, soil, plants, and animals). Human activities are<br />
altering the carbon cycle--both by adding more CO2 to the atmosphere and by influencing the ability <strong>of</strong> natural sinks, like<br />
forests, to remove CO2 from the atmosphere. While CO2 emissions come from a variety <strong>of</strong> natural sources, human-related<br />
emissions are responsible for the increase that has occurred in the atmosphere since the industrial revolution.<br />
50-200 years 1<br />
Carbon Dioxide CO2<br />
12 years 21<br />
(i) Industry: Natural gas and petroleum systems are the largest source <strong>of</strong> CH4 emissions from industry in the United States.<br />
Methane is the primary component <strong>of</strong> natural gas. Some CH4 is emitted to the atmosphere during the production, processing,<br />
storage, transmission, and distribution <strong>of</strong> natural gas. Because gas is <strong>of</strong>ten found alongside petroleum, the production,<br />
refinement, transportation, and storage <strong>of</strong> crude oil is also a source <strong>of</strong> CH4 emissions.<br />
(ii) Agriculture: Domestic livestock such as cattle, buffalo, sheep, goats, and camels produce large amounts <strong>of</strong> CH4 as part <strong>of</strong> their<br />
normal digestive process. Also, when animals' manure is stored or managed in lagoons or holding tanks, CH4 is produced. Because<br />
humans raise these animals for food, the emissions are considered human-related. Globally, the Agriculture sector is the primary<br />
source <strong>of</strong> CH4 emissions.<br />
(iii) Waste from Homes and Businesses: Methane is generated in landfills as waste decomposes and in the treatment <strong>of</strong><br />
wastewater. Landfills are the third largest source <strong>of</strong> CH4 emissions in the United States<br />
Methane (CH4) is the second most prevalent greenhouse gas emitted in the United States from human activities. In 2010, CH4<br />
accounted for about 10% <strong>of</strong> all U.S. greenhouse gas emissions from human activities. Methane is emitted by natural sources<br />
such as wetlands, as well as human activities such as leakage from natural gas systems and the raising <strong>of</strong> livestock. Natural<br />
processes in soil and chemical reactions in the atmosphere help remove CH4 from the atmosphere. Methane's lifetime in the<br />
atmosphere is much shorter than carbon dioxide (CO2), but CH4 is more efficient at trapping radiation than CO2. Pound for<br />
pound, the comparative impact <strong>of</strong> CH4 on climate change is over 20 times greater than CO2 over a 100-year period.<br />
Methane CH4<br />
(i) Agriculture: Nitrous oxide is emitted when people add nitrogen to the soil through the use <strong>of</strong> synthetic fertilizers. Agricultural<br />
soil management is the largest source <strong>of</strong> N2O emissions in the United States, accounting for about 68% <strong>of</strong> total U.S. N2O<br />
emissions in 2010. Nitrous oxide is also emitted during the breakdown <strong>of</strong> nitrogen in livestock manure and urine, which<br />
contributed to 6% <strong>of</strong> N2O emissions in 2010.<br />
(ii) Transportation: Nitrous oxide is emitted when transportation fuels are burned. Motor vehicles, including passenger cars and<br />
trucks, are the primary source <strong>of</strong> N2O emissions from transportation. The amount <strong>of</strong> N2O emitted from transportation depends<br />
on the type <strong>of</strong> fuel and vehicle technology, maintenance, and operating practices.<br />
(iii) Industry: Nitrous oxide is generated as a byproduct during the production <strong>of</strong> nitric acid, which is used to make synthetic<br />
commercial fertilizer, and in the production <strong>of</strong> adipic acid, which is used to make fibers, like nylon, and other synthetic products.<br />
In 2010, nitrous oxide (N2O) accounted for about 4% <strong>of</strong> all U.S. greenhouse gas emissions from human activities. Nitrous oxide<br />
is naturally present in the atmosphere as part <strong>of</strong> the Earth's nitrogen cycle, and has a variety <strong>of</strong> natural sources. However,<br />
human activities such as agriculture, fossil fuel combustion, wastewater management, and industrial processes are increasing<br />
the amount <strong>of</strong> N2O in the atmosphere. Nitrous oxide molecules stay in the atmosphere for an average <strong>of</strong> 120 years before<br />
being removed by a sink or destroyed through chemical reactions. The impact <strong>of</strong> 1 pound <strong>of</strong> N2O on warming the atmosphere<br />
is over 300 times that <strong>of</strong> 1 pound <strong>of</strong> carbon dioxide.<br />
120 years 310<br />
Nitrous Oxide N2O<br />
Fluorinated gases have no natural sources and only come from human-related activities. They are emitted through a variety <strong>of</strong><br />
industrial processes such as aluminum and semiconductor manufacturing. Many fluorinated gases have very high global<br />
warming potentials (GWPs) relative to other greenhouse gases, so small atmospheric concentrations can have large effects on<br />
global temperatures. They can also have long atmospheric lifetimes--in some cases, lasting thousands <strong>of</strong> years. Like other longlived<br />
greenhouse gases, fluorinated gases are well-mixed in the atmosphere, spreading around the world after they're<br />
emitted. Fluorinated gases are removed from the atmosphere only when they are destroyed by sunlight in the far upper<br />
atmosphere. In general, fluorinated gases are the most potent and longest lasting type <strong>of</strong> greenhouse gases emitted by<br />
human activities.<br />
HFCs: 140-11,700<br />
PFCs: 6,500-9,200<br />
SF6: 23,900<br />
HFCs: 1-270 years<br />
PFCs: 800-50,000 years<br />
SF6: 3,200 years<br />
(i) Substitution <strong>of</strong> Ozone Depleting substances: Hydr<strong>of</strong>luorocarbons are used as refrigerants, aerosol propellants, solvents, and<br />
fire retardants. The major emissions source <strong>of</strong> these compounds is their use as refrigerants--for example, in air conditioning<br />
systems in both vehicles and buildings. These chemicals were developed as a replacement for chlor<strong>of</strong>luorocarbons (CFCs) and<br />
hydrochlor<strong>of</strong>luorocarbons (HCFCs) because they do not deplete the stratospheric ozone layer. Chlor<strong>of</strong>luorocarbons and HCFCs are<br />
being phased out under an international agreement, called the Montreal Protocol. Unfortunately, HFCs are potent greenhouse<br />
gases with long atmospheric lifetimes and high GWPs, and they are released into the atmosphere through leaks, servicing, and<br />
disposal <strong>of</strong> equipment in which they are used.<br />
(ii) Industry: Perfluorocarbons are compounds produced as a by-product <strong>of</strong> various industrial processes associated with aluminum<br />
production and the manufacturing <strong>of</strong> semiconductors. Like HFCs, PFCs generally have long atmospheric lifetimes and high GWPs.<br />
Sulfur hexafluoride is used in magnesium processing and semiconductor manufacturing, as well as a tracer gas for leak detection.<br />
HFC-23 is produced as a by-product <strong>of</strong> HCFC-22 production.<br />
(iii) Transmission and Distribution <strong>of</strong> Electricity: Sulfur hexafluoride is used in electrical transmission equipment, including circuit<br />
breakers. The GWP <strong>of</strong> SF6 is 23,900, making it the most potent greenhouse gases that the Intergovernmental Panel on Climate<br />
Change has evaluated.<br />
HFCs, PFCs,<br />
SF6<br />
F-gases<br />
Human activities such as transportation, agriculture, industry and waste decomposition have increased the ozone concentration<br />
through the release <strong>of</strong> gases such as carbon monoxide, hydrocarbons, and nitrogen oxides.<br />
22 days<br />
Ozone is continuously produced and destroyed in the atmosphere by chemical reactions. In the troposphere, the lowest 5 to<br />
10 miles <strong>of</strong> the atmosphere near the surface, human activities have increased the ozone concentration through the release <strong>of</strong><br />
gases such as carbon monoxide, hydrocarbons, and nitrogen oxides. These gases undergo chemical reactions to produce<br />
ozone in the presence <strong>of</strong> sunlight. In addition to trapping heat, excess ozone in the troposphere causes respiratory illnesses<br />
and other human health problems.<br />
Ozone O3<br />
Irrigation and combustion processes, surface warming caused by other human-produced greenhouse gases leads to an increase in<br />
atmposheric water vapor.<br />
Water vapor is the most important and abundant greenhouse gas in the atmosphere. Human activities produce only a very<br />
small increase in water vapor through irrigation and combustion processes. However, the surface warming caused by humanproduced<br />
increases in other greenhouse gases leads to an increase in atmospheric water vapor, since a warmer climate<br />
increases evaporation and allows the atmosphere to hold more moisture. This creates an amplifying "feedback loop," leading<br />
to more warming.<br />
Water Vapor<br />
* Depending on how well a gas absorbs energy and how long it stays in the atmosphere, certain greenhouse gases are more effective at warming the Earth than others. The Global Warming Potential (GWP) for a gas is a measure <strong>of</strong> the total energy that a gas absorbs over a particular period <strong>of</strong> time (usually 100 years) compared to carbon<br />
dioxide.<br />
SOURCES:<br />
1. E.P.A, U. (2012, June 14). Greenhouse Gas Emissions. Retrieved July 28, 2012, from U.S. E.P.A Climate Change: http://epa.gov/climatechange/ghgemissions/<br />
2. Global Climate Change Impacts in the United States, Thomas R. Karl, Jerry M. Melillo, and Thomas C. Peterson, (eds.). Cambridge University Press, 2009<br />
<strong>City</strong> <strong>of</strong> <strong>Urbana</strong><br />
74
4.4 APPENDIX C: PUBLIC INPUT SURVEY RESULTS<br />
Survey Respondents<br />
*35 Residents, 12 non-Residents<br />
<strong>Urbana</strong> CAP 2010 Public Input Survey Results<br />
21 Property Owners (Residential)<br />
*7 Business Managers or Owners<br />
6 Commercial<br />
1 Transportation<br />
Updated Feb. 2011<br />
*Business/group considered GHG emissions or energy use<br />
11 Identified some greenhouse gas emission sources or energy-saving measures<br />
16 In process <strong>of</strong> a project to reduce energy use or greenhouse gas emissions<br />
5 Successfully implemented a project to reduce energy use or greenhouse gas emissions<br />
*Personally considered GHG emissions or energy use<br />
21 Identified some greenhouse gas emission sources or energy-saving measures<br />
8 In process <strong>of</strong> a project to reduce energy use or greenhouse gas emissions<br />
18 Successfully implemented a project to reduce energy use or greenhouse gas emissions<br />
*Those completing survey indicated they were members <strong>of</strong> these local non-pr<strong>of</strong>it and community groups:<br />
AAOW, Alpha Phi Omega, Books to Prisoners, CCnet, CWIT, CWT, C-U Fit Families, CUMTD Sustainability<br />
Committee, C-U Safe Routes To School Project, C-U Symphony, Champaign County Bikes, Common Ground<br />
Food Co-op, Community Women’s Club, Cosmopolitan Club, Eastern Illinois Foodbank, Educational Resources<br />
in Environmental Sciences, Engineers without Borders, Girl Scouts, Green Party, HEUNA, Habitat for Humanity,<br />
Heartland Pathways, Illini Carbon, Illinois Green Business Association, Independent Media Center,<br />
International Hospitality Centers, Kalyx Center, League <strong>of</strong> Women Voters, McKinley Presbyterian Church,<br />
Prairie Ensemble, Progressive Democrats, RSVP, SEDAC, Sierra Club, Students for Environmental Concerns,<br />
Transitions Champaign County, UP Center, Unitarian Universalist Church, U <strong>of</strong> I Climate Action Plan<br />
Operations Committee, U <strong>of</strong> I Student Senate, University YWCA, University YMCA, <strong>Urbana</strong> Plan Commission,<br />
WEFT, WUNA<br />
1<br />
<strong>City</strong> <strong>of</strong> <strong>Urbana</strong><br />
75
4.4 APPENDIX C: PUBLIC INPUT SURVEY RESULTS<br />
Programs or Actions to Assist with GHG Emission Reductions<br />
EDUCATION<br />
More specific information on steps we can take to reduce CO2 (x3)<br />
Public education about sustainability (x3)<br />
Public workshops on water and energy conservation (x2)<br />
More PSA's regarding things individuals can do<br />
On-going meetings arranged by tonight’s organizers<br />
Information which can be emailed and distributed to help homeowners especially in low income areas<br />
Access to expertise on energy efficiency<br />
A quick assessment and recommendations <strong>of</strong> what steps we should take to reduce the most energy<br />
use<br />
Live energy usage displays<br />
TRANSPORTATION AND <strong>PLAN</strong>NING<br />
More/improved bike lanes/paths (x7)<br />
Easy access to shopping (x2)<br />
Avoid sprawl<br />
Public transportation - intercity<br />
More integrated transportation<br />
More divided bus routes; better evening and weekend bus schedules<br />
Provide transit system guides to all apartment dwellers<br />
Revitalizing downtown/Lincoln Square and other core urban areas for commercial/residential/service<br />
uses to allow biking, walking, and other more sustainable transportation<br />
A snow removal ordinance and program to allow pedestrian access via walking to bus stops<br />
More covered bike parking and bike lanes<br />
Require transportation plans for any event over 200 people<br />
More electric vehicles<br />
ENERGY<br />
More renewable energy available from the grid (x5)<br />
Easier access to residential energy audits (x2)<br />
Know when there is overproduction <strong>of</strong> electricity<br />
Home electricity use monitors<br />
Options to buy sustainable energy only<br />
Smarter buildings<br />
Building assessments<br />
FINANCIAL<br />
Loans and grants to help us pay for any retr<strong>of</strong>its (x4)<br />
Options for financing projects (x2)<br />
Documented savings/improvement by type <strong>of</strong> project<br />
Lower cost renewable energy options for home<br />
Availability <strong>of</strong> tax incentives for non-pr<strong>of</strong>its<br />
2<br />
<strong>City</strong> <strong>of</strong> <strong>Urbana</strong><br />
76
4.4 APPENDIX C: PUBLIC INPUT SURVEY RESULTS<br />
Income tax credits for energy efficient home improvements<br />
Support for non-pr<strong>of</strong>its to retr<strong>of</strong>it<br />
Affordable options<br />
Financial incentives on our power or water bills to somehow make it a no-brainer for us to put<br />
attention on reducing energy use<br />
Low interest loans for renewable energy installations<br />
Tax incentives for purchase <strong>of</strong> “green” home appliances<br />
Incentives for construction <strong>of</strong> homes meeting Passive House standard<br />
MISCELLANEOUS<br />
Commercial recycling program (x2)<br />
Accessible resources for <strong>of</strong>fsetting carbon<br />
A variety <strong>of</strong> options to reduce emissions<br />
Coordination with the university<br />
Providing more opportunities to buy locally, and to buy locally-sourced products<br />
Food waste composting program for restaurants<br />
Locate more grocery stores within walking distance<br />
Encourage native plants versus turf grass<br />
Increase local recycling options<br />
Develop games/competitions to make GHG reduction fun<br />
<strong>City</strong> should lead by example<br />
Help people prioritize – what should they do first to reduce GHG emission<br />
Barriers to GHG Emission Reductions<br />
Funding assistance programs needed (x5)<br />
Technical assistance is needed to overcome barriers (x3)<br />
Would like to see high speed and light rail systems<br />
It's a matter <strong>of</strong> getting the ball rolling and a lack <strong>of</strong> handout material<br />
The research time it takes to gather information and apply it to our business<br />
Bike paths are few and poorly designed. There should be highways for bikes.<br />
There isn't a commercial recycling program<br />
Composting difficult for apartment dwellers<br />
The businesses I would want to patronize do not exist in <strong>Urbana</strong> (copy shop, <strong>of</strong>fice supply store, etc)<br />
Resistance to making changes necessary to create easier access to active transportation modes in the<br />
political process<br />
Not aware <strong>of</strong> who provides energy audits or how to sign up for assessment <strong>of</strong> our facility. Because we<br />
don't have outside, objective advice, it is hard to get some <strong>of</strong> my colleagues to change behavior such as<br />
turning <strong>of</strong>f computers on nights and weekends. If we had outside advice from an expert with numerical<br />
calculations <strong>of</strong> what we could save that could give us the information we need to make bigger changes<br />
Lack <strong>of</strong> energy infrastructure<br />
3<br />
<strong>City</strong> <strong>of</strong> <strong>Urbana</strong><br />
77
4.4 APPENDIX C: PUBLIC INPUT SURVEY RESULTS<br />
<strong>Urbana</strong> CAP Program or Project Suggestions<br />
Better planning to avoid sprawl; encourage infill (x4)<br />
Encourage more renewable energy (x3)<br />
Community-scale renewable energy generation and purchasing (x2)<br />
Commercial recycling programs (x2)<br />
De-privatize our water distribution system (x2)<br />
Inter-Urban Light Rail/tram (x2)<br />
PACE (Property Assessed Clean Energy) financing program (x2)<br />
Residential energy audits and retr<strong>of</strong>its (x2) - maybe a systematic project where we focus on one<br />
neighborhood at a time and show that we can make a meaningful difference in a neighborhood with<br />
focused attention.<br />
Repeats <strong>of</strong> tonight's performance and regular meetings like this to bring in more people as they<br />
become aware <strong>of</strong> what is being done and what they can do<br />
Compost program for local restaurants which throw away hundreds <strong>of</strong> lbs <strong>of</strong> compostable materials<br />
every day<br />
IGBA green business certification<br />
Community education helping people understand the need/Resource information where to get good<br />
information on sustainability projects/More information and resources for owners <strong>of</strong> homes and<br />
buildings to implement conservation measures<br />
Contractor education to ensure quality contractors are available<br />
Energy/sustainability taxes<br />
Light/electric reduction/LED streetlights<br />
Better coordination between <strong>Urbana</strong>, Champaign and U <strong>of</strong> I<br />
A strong focus on core redevelopment/Incentives for urban redevelopment<br />
Focus on family and locally owned businesses/sustainable businesses, etc.<br />
More resources directed to increasing access and safety to pedestrian and bicycle infrastructure<br />
Year-round farmers market to buy local foods<br />
Renewable energy feed-in tariff policy<br />
Higher energy standards for new constructions or renovations on buildings over 3,000 sq. ft.<br />
Increase use <strong>of</strong> hybrid electric public transportation<br />
Increase use by public <strong>of</strong> smart driving techniques<br />
Encourage “grey water” capture systems and composting toilets<br />
More green ro<strong>of</strong>s and rain gardens<br />
Develop website for discussion <strong>of</strong> UCAP<br />
More bike lanes/paths<br />
Education on environmentally-preferable shopping<br />
Encourage hanging <strong>of</strong> laundry to air-dry<br />
4<br />
<strong>City</strong> <strong>of</strong> <strong>Urbana</strong><br />
78
4.4 APPENDIX C: PUBLIC INPUT SURVEY RESULTS<br />
Place no restrictions on residential wind turbines<br />
Require no minimum parking lot sizes in zoning codes<br />
Additional Input<br />
Good meeting. Interesting graphs on energy use, both residential and commercial. More people need<br />
to understand where we are today.<br />
The light rail study that was done several years ago is more pertinent than ever.<br />
While I firmly believe that there is much individual homeowners can do to reduce the community's<br />
footprint, I feel that the majority <strong>of</strong> waste comes from commercial and industrial waste. I think that a<br />
combined effort <strong>of</strong> rewards and penalties by the city could have great effects.<br />
Olympian Drive is the opposite <strong>of</strong> what the city should be pursuing - it flies counter to sustainable<br />
development and the goal <strong>of</strong> this plan. We can - and should - do better.<br />
This process is great! We're going to need to show some quick successes or give an annual report <strong>of</strong><br />
progress so we can feel like we are steadily making progress towards our goals and have some<br />
achievements we can celebrate. We need to tell <strong>City</strong> Council and the public what investment we need<br />
to make in order to make this a success. This may take staffing or marketing/outreach budgets or<br />
incentive programs and we need to be realistic and optimistic at the same time about doing this<br />
project in a big enough way that we truly make the difference.<br />
I would like recycling available in every business, especially restaurants.<br />
5<br />
<strong>City</strong> <strong>of</strong> <strong>Urbana</strong><br />
79
4.4 APPENDIX C: PUBLIC INPUT SURVEY RESULTS<br />
2012 Public Input Results<br />
The Public Review Draft Climate Action Plan and a public comment webform are both on the city website. We have received a small<br />
number <strong>of</strong> comments. Results below:<br />
Compared to other priorities <strong>of</strong> the <strong>City</strong> <strong>of</strong> <strong>Urbana</strong>, working to achieve the goals <strong>of</strong> the Draft Climate Action Plan should be a:<br />
Very High<br />
Priority<br />
High Priority<br />
Equal to others<br />
Low Priority<br />
Very Low<br />
Priority<br />
The Draft Climate Action Plan reflects my personal values:<br />
Strongly Agree<br />
Somewhat<br />
Agree<br />
Agree<br />
Somewhat<br />
Disagree<br />
Strongly<br />
Disagree<br />
Neither<br />
The Draft Climate Action Plan goal <strong>of</strong> reducing greenhouse gas emissions 25 percent by 2020 is achievable:<br />
Strongly Agree<br />
Somewhat<br />
Agree<br />
Agree<br />
Somewhat<br />
Disagree<br />
Strongly<br />
Disagree<br />
Neither<br />
The Draft Climate Action Plan goal <strong>of</strong> reducing greenhouse gas emissions 80 percent by 2050 is achievable:<br />
<strong>City</strong> <strong>of</strong> <strong>Urbana</strong><br />
80
4.4 APPENDIX C: PUBLIC INPUT SURVEY RESULTS<br />
Strongly Agree<br />
Somewhat<br />
Agree<br />
Agree<br />
Some Comments:<br />
Somewhat<br />
Disagree<br />
Strongly<br />
Disagree<br />
Neither<br />
“I strongly agree with the initiative to reduce electrical consumption emissions.”<br />
“Good broad based approach.”<br />
“Better mass transit.”<br />
<strong>City</strong> <strong>of</strong> <strong>Urbana</strong><br />
81
4.4<br />
APPENDIX D: PUBLIC INPUT FORMS<br />
2010:<br />
Submit by Email<br />
Print Form<br />
<strong>Urbana</strong> Climate Action Plan<br />
Public Input Form<br />
The <strong>City</strong> <strong>of</strong> <strong>Urbana</strong> Sustainability Advisory Commission is soliciting input from various stakeholders on the<br />
<strong>Urbana</strong> Climate Action Plan, a community-wide plan to reduce greenhouse gas emissions. The Commission<br />
is preparing a Climate Action Plan recommendation to be presented to the <strong>Urbana</strong> <strong>City</strong> Council for review<br />
and implementation. Your responses to the following questions will be used to guide the direction <strong>of</strong> the<br />
Climate Action Plan as it is developed. We look forward to your involvement. Please feel free to contact us<br />
with questions or comments. Thank you.<br />
1. Your Name (optional):__________________________________________<br />
2. Are you a resident <strong>of</strong> <strong>Urbana</strong> ____Yes ____No<br />
3. Where do you live ____________________________________________<br />
4. Do you own property in <strong>Urbana</strong> ____Yes ____No<br />
5. Do you own or manage a business in <strong>Urbana</strong> ____Yes ____No<br />
If so, please select the sectors that best describes your business.<br />
____Industrial ____Commercial ____Transportation ____Waste ____Residential<br />
6. Are you involved with any local non-pr<strong>of</strong>it organizations or community groups __ Yes __No<br />
If so, please list them: ______________________________________________________________<br />
_________________________________________________________________________________<br />
_________________________________________________________________________________<br />
_________________________________________________________________________________<br />
_________________________________________________________________________________<br />
7. Check the box below that best describes the extent to which your primary business, non-pr<strong>of</strong>it<br />
organization, or community group has considered its energy use or greenhouse gas emissions:<br />
Has not considered<br />
Identified some greenhouse gas emission sources or energy-saving measures<br />
In process <strong>of</strong> a project to reduce energy use or greenhouse gas emissions<br />
Successfully implemented a project to reduce energy use or greenhouse gas emissions<br />
8. Check the box below that best describes the extent to which you have considered your personal<br />
energy use and greenhouse gas emissions:<br />
Have not considered<br />
Identified some greenhouse gas emission sources or energy-saving measures<br />
In process <strong>of</strong> a project to reduce energy use or greenhouse gas emissions<br />
Successfully implemented a project to reduce energy use or greenhouse gas emissions<br />
1<br />
<strong>City</strong> <strong>of</strong> <strong>Urbana</strong><br />
82
4.4 APPENDIX D: PUBLIC INPUT FORMS<br />
9. List three (3) things that would assist you, or your organization, in reducing your greenhouse<br />
gas emissions.<br />
_________________________________________________________________________________<br />
_________________________________________________________________________________<br />
_________________________________________________________________________________<br />
_________________________________________________________________________________<br />
_________________________________________________________________________________<br />
_________________________________________________________________________________<br />
10. Are there any specific barriers that prevent you from utilizing these things described above If<br />
so, please specify. ___No ___Yes<br />
_________________________________________________________________________________<br />
_________________________________________________________________________________<br />
_________________________________________________________________________________<br />
_________________________________________________________________________________<br />
11. What programs or projects would you like to be pursued as part <strong>of</strong> the community-wide<br />
<strong>Urbana</strong> Climate Action Plan<br />
_________________________________________________________________________________<br />
_________________________________________________________________________________<br />
_________________________________________________________________________________<br />
_________________________________________________________________________________<br />
_________________________________________________________________________________<br />
_________________________________________________________________________________<br />
12. Please share any additional input or comments.<br />
13. Contact Information (optional):<br />
Name: ________________________________________<br />
Email: ________________________________________<br />
Mailing Address: _______________________________<br />
Phone: ________________________<br />
<strong>City</strong>, State: _____________________<br />
Check here to receive announcements about other <strong>Urbana</strong> Climate Action Plan and<br />
Sustainability efforts (provide contact information above)<br />
Check here to receive Sustainability Advisory Commission meeting agendas through<br />
e-mail (provide your email address above)<br />
Return this survey to:<br />
Anna Hochhalter, Community Development Associate/Public Arts Coordinator<br />
Community Development Services, <strong>City</strong> <strong>of</strong> <strong>Urbana</strong><br />
400 S. Vine Street, <strong>Urbana</strong>, IL 61801<br />
Phone: (217) 384-2311, or Fax: (217) 384-0200<br />
Email: alhochhalter@city.urbana.il.us<br />
2<br />
<strong>City</strong> <strong>of</strong> <strong>Urbana</strong><br />
83
4.4 APPENDIX D: PUBLIC INPUT FORMS<br />
2012:<br />
What is your zip code:<br />
Compared to other priorities <strong>of</strong><br />
the <strong>City</strong> <strong>of</strong> <strong>Urbana</strong>, working to<br />
achieve the goals <strong>of</strong> the Draft<br />
Climate Action Plan should be a:<br />
A. Very high priority<br />
B. High priority<br />
C. Equal to other priorities<br />
D. Low priority<br />
E. Very low priority<br />
The Draft Climate Action Plan<br />
reflects my personal values:<br />
A. Strongly agree<br />
B. Somewhat agree<br />
C. Agree<br />
D. Somewhat disagree<br />
E. Strongly disagree<br />
F Don’t agree or disagree<br />
The Draft Climate Action Plan<br />
goal <strong>of</strong> reducing greenhouse gas<br />
emissions 25 percent by 2020 is<br />
achievable:<br />
A. Strongly agree<br />
B. Somewhat agree<br />
C. Agree<br />
D. Somewhat disagree<br />
E. Strongly disagree<br />
F. Don’t agree or disagree<br />
The Draft Climate Action Plan<br />
goal <strong>of</strong> reducing greenhouse gas<br />
emissions 80 percent by 2050 is<br />
achievable:<br />
A. Strongly agree<br />
B. Somewhat agree<br />
C. Agree<br />
D. Somewhat disagree<br />
E. Strongly disagree<br />
F. Don’t agree or disagree<br />
Is there a strategy from the Draft<br />
Climate Action Plan that you<br />
strongly support Explain:<br />
Is there a strategy from the Draft<br />
Climate Action Plan that you do<br />
not support Explain:<br />
Is there a feasible greenhouse<br />
gas emissions reduction strategy<br />
or adaptation strategy that you<br />
think is missing from the Draft<br />
Climate Action Plan:<br />
DRAFT <strong>CLIMATE</strong> <strong>ACTION</strong> <strong>PLAN</strong> PUBLIC INPUT CARD<br />
<strong>City</strong> <strong>of</strong> <strong>Urbana</strong><br />
84
4.4 APPENDIX D: PUBLIC INPUT FORMS<br />
What is your zip code:<br />
Compared to other priorities <strong>of</strong><br />
the <strong>City</strong> <strong>of</strong> <strong>Urbana</strong>, working to<br />
achieve the goals <strong>of</strong> the Draft<br />
Climate Action Plan should be a:<br />
A. Very high priority<br />
B. High priority<br />
C. Equal to other priorities<br />
D. Low priority<br />
E. Very low priority<br />
The Draft Climate Action Plan<br />
reflects my personal values:<br />
A. Strongly agree<br />
B. Somewhat agree<br />
C. Agree<br />
D. Somewhat disagree<br />
E. Strongly disagree<br />
F Don’t agree or disagree<br />
The Draft Climate Action Plan<br />
goal <strong>of</strong> reducing greenhouse gas<br />
emissions 25 percent by 2020 is<br />
achievable:<br />
A. Strongly agree<br />
B. Somewhat agree<br />
C. Agree<br />
D. Somewhat disagree<br />
E. Strongly disagree<br />
F. Don’t agree or disagree<br />
The Draft Climate Action Plan<br />
goal <strong>of</strong> reducing greenhouse gas<br />
emissions 80 percent by 2050 is<br />
achievable:<br />
A. Strongly agree<br />
B. Somewhat agree<br />
C. Agree<br />
D. Somewhat disagree<br />
E. Strongly disagree<br />
F. Don’t agree or disagree<br />
Is there a strategy from the Draft<br />
Climate Action Plan that you<br />
strongly support Explain:<br />
Is there a strategy from the Draft<br />
Climate Action Plan that you do<br />
not support Explain:<br />
Is there a feasible greenhouse<br />
gas emissions reduction strategy<br />
or adaptation strategy that you<br />
think is missing from the Draft<br />
Climate Action Plan:<br />
DRAFT <strong>CLIMATE</strong> <strong>ACTION</strong> <strong>PLAN</strong> PUBLIC INPUT CARD<br />
<strong>City</strong> <strong>of</strong> <strong>Urbana</strong><br />
85
4.4<br />
APPENDIX E: CACP GREENHOUSE GAS EMISSIONS FACTORS<br />
How does the Clean Air and Climate Protection (CACP) S<strong>of</strong>tware Calculate Emissions<br />
To facilitate efforts to identify and reduce greenhouse gas emissions, ICLEI developed the Clean Air and Climate Protection (CACP)<br />
s<strong>of</strong>tware package. This s<strong>of</strong>tware models current and future emissions using population, energy consumption and solid waste<br />
generation data. It is worth noting that although the s<strong>of</strong>tware provides <strong>Urbana</strong> with a sophisticated and useful tool, calculating<br />
emissions from energy use with precision is difficult. The model depends upon numerous assumptions, and it is limited by the<br />
quantity and quality <strong>of</strong> available data. With this in mind, it is useful to think <strong>of</strong> any specific number generated by the model as an<br />
approximate guide to prompt, effective action.<br />
The CACP s<strong>of</strong>tware determines emissions using specific factors or coefficients according to the type <strong>of</strong> fuel used. Emissions are<br />
aggregated and reported in terms <strong>of</strong> carbon dioxide equivalent units (CO 2<br />
e). Converting all emissions to carbon dioxide equivalent<br />
units allows for the consideration <strong>of</strong> different greenhouse gases in comparable terms. For example, pound-for-pound methane<br />
is twenty-one times more powerful than carbon dioxide in its capacity to trap heat, so the model converts one ton <strong>of</strong> methane<br />
emissions to 21 tons <strong>of</strong> CO 2<br />
e.<br />
The emissions coefficients and methodology employed by the s<strong>of</strong>tware are consistent with national and international inventory<br />
standards established by the Intergovernmental Panel on Climate Change (1996 Revised IPCC Guidelines for the Preparation <strong>of</strong><br />
National GHG Emissions Inventories), the U.S. Voluntary Greenhouse Gas Reporting Guidelines (EIA form 1605), and for emissions<br />
generated from solid waste, the U.S. EPA’s Waste Reduction Model (WARM).<br />
Emissions Factors Used in Calculations<br />
Source: CACP 2009 s<strong>of</strong>tware, except as otherwise noted.<br />
Transportation Emissions Factors<br />
Emissions per gallon <strong>of</strong> gasoline equivalent energy except where noted<br />
Fuel CO2<br />
NOx<br />
(lbs)<br />
SOx<br />
(lbs)<br />
CO<br />
(lbs)<br />
VOCs<br />
(lbs)<br />
PM10<br />
(lbs)<br />
Gasoline 0.009412727 0.002987237 0.000194796 0.6760215 0.07089627 0.001454457<br />
CNG 0.000054 0.001539708 4.8785E-05 0.1178956 0.00264934 0.000256388<br />
Ethanol 0.46 0 0.82 0.57 0.66<br />
Emissions per gallon <strong>of</strong> diesel except where noted<br />
Diesel 0.009530909 0.035816328 0.004952337 0.045621 0.01472358 0.004901075<br />
Biodiesel (B20) 0.019781 0 -0.12298 0 -0.11987<br />
Biodiesel (B100) 0.102897 0 -0.47186 0 -0.48113<br />
Emission control technology multipliers (school buses)<br />
CO2 NOx SOx CO VOCs PM10<br />
Technology<br />
nondimensional multipliers<br />
Oxidation Catalyst 1 1 1 0.1 0.1 0.7<br />
Particulate Trap 1 0.975 1 0.1 0.1 0.1<br />
Bulding Energy Emissions Factors<br />
CO2e<br />
(metric tons)<br />
NOx<br />
(lbs)<br />
SOx<br />
(lbs)<br />
CO<br />
(lbs)<br />
VOCs<br />
(lbs)<br />
PM10<br />
(lbs)<br />
Natural Gas Emissions / Therm 0.005602187 0.016800507 0.000669309 0.0043341 0.00092447 0.000513236<br />
Fuel Oil Emissions / Gallon 0.01311769 0.611558929 0.040215904 0.1317418 0.04853642 0.0429894<br />
Electricity Emission Factors<br />
Selected Region<br />
Select 16 5<br />
CO2e<br />
Utility Region<br />
(metric<br />
tons/kWh)<br />
NOx<br />
(lbs/kWh)<br />
RFC West (RFCW)<br />
SOx<br />
(lbs/kWh)<br />
CO<br />
(lbs/kWh)<br />
VOC<br />
(lbs/kWh)<br />
PM10<br />
(lbs/kWh)<br />
0.000735433 0.0025807 0.0097844 0.00027 0.00003 0.000238<br />
All Regions<br />
Utility Specific<br />
ASCC Alaska Grid (AKGD) 5.71E-04 0.0024795 0.00121 0.00006 0.00000 0.00001<br />
ASCC Miscellaneous (AKMS) 2.34E-04 0.0067906 0.00053 0.00006 0.00000 0.00001<br />
ERCOT All (ERCT) 6.24E-04 0.0008763 0.00320 0.00053 0.00006 0.00046<br />
FRCC All (FRCC) 6.26E-04 0.0020728 0.00358 0.00075 0.00008 0.00066<br />
HICC Miscellaneous (HIMS) 7.83E-04 0.0073289 0.00569 0.00010 0.00000 0.00008<br />
HICC Oahu (HIOA) 8.66E-04 0.002588 0.00360 0.00010 0.00000 0.00008<br />
MRO East (MROE) 8.78E-04 0.0027473 0.00717 0.00060 0.00007 0.00053<br />
MRO West (MROW) 8.72E-04 0.0037138 0.00565 0.00095 0.00011 0.00084<br />
NPCC Long Island (NYLI) 7.34E-04 0.0016385 0.00375 0.00104 0.00012 0.00092<br />
<strong>City</strong> <strong>of</strong> <strong>Urbana</strong><br />
86
Electricity Emission Factors<br />
Selected Bulding Region Energy Emissions Factors<br />
Select CO2e 16 NOx 5 SOx CO VOCs PM10<br />
4.4 APPENDIX E: (metric CO2e<br />
CACP tons) (lbs) (lbs) (lbs) (lbs) (lbs)<br />
Natural Gas Emissions / Therm 0.005602187 (metric<br />
GREENHOUSE<br />
0.016800507 NOx 0.000669309 SOx<br />
GAS<br />
0.0043341 CO<br />
EMISSIONS<br />
0.00092447 VOC 0.000513236 PM10<br />
FACTORS<br />
Fuel Oil Emissions Utility Region / Gallon tons/kWh) 0.01311769 0.611558929 (lbs/kWh) 0.040215904 (lbs/kWh) (lbs/kWh) 0.1317418 0.04853642 (lbs/kWh) (lbs/kWh) 0.0429894<br />
RFC West (RFCW)<br />
Electricity Emission Factors<br />
Selected All Regions Region<br />
Utility Specific<br />
Select ASCC Alaska Grid (AKGD) 5.71E-04 16 0.00247955<br />
0.00121 0.00006 0.00000 0.00001<br />
ASCC Miscellaneous (AKMS) CO2e 2.34E-04 0.0067906 0.00053 0.00006 0.00000 0.00001<br />
ERCOT All (ERCT) (metric 6.24E-04 0.0008763 NOx SOx 0.00320 0.00053 CO VOC 0.00006 PM10 0.00046<br />
FRCC All (FRCC) Utility Region<br />
tons/kWh) 6.26E-04 (lbs/kWh) 0.0020728 (lbs/kWh) 0.00358 (lbs/kWh) 0.00075 (lbs/kWh) 0.00008 (lbs/kWh) 0.00066<br />
RFC HICC West Miscellaneous (RFCW) (HIMS) 7.83E-04 0.0073289 0.00569 0.00010 0.00000 0.00008<br />
HICC Oahu (HIOA) 8.66E-04 0.002588 0.00360 0.00010 0.00000 0.00008<br />
0.000735433 0.0025807 0.0097844 0.00027 0.00003 0.000238<br />
MRO East (MROE) 8.78E-04 0.0027473 0.00717 0.00060 0.00007 0.00053<br />
MRO All Regions West (MROW) 8.72E-04 0.0037138 0.00565 0.00095 0.00011 0.00084<br />
NPCC Long Island (NYLI) 7.34E-04 0.0016385 0.00375 0.00104 0.00012 0.00092<br />
Utility Specific<br />
ASCC<br />
NPCC<br />
Alaska<br />
New England<br />
Grid (AKGD)<br />
(NEWE)<br />
5.71E-04<br />
4.53E-04<br />
0.0024795<br />
0.000863<br />
0.00121<br />
0.00236<br />
0.00006<br />
0.00119<br />
0.00000<br />
0.00013<br />
0.00001<br />
0.00105<br />
ASCC<br />
NPCC<br />
Miscellaneous<br />
NYC/Westchester<br />
(AKMS)<br />
(NYCW)<br />
2.34E-04<br />
3.81E-04<br />
0.0067906<br />
0.0007288<br />
0.00053<br />
0.00060<br />
0.00006<br />
0.00104<br />
0.00000<br />
0.00012<br />
0.00001<br />
0.00092<br />
ERCOT<br />
NPCC Upstate<br />
All (ERCT)<br />
NY (NYUP)<br />
6.24E-04<br />
3.45E-04<br />
0.0008763<br />
0.0008319<br />
0.00320<br />
0.00300<br />
0.00053<br />
0.00104<br />
0.00006<br />
0.00012<br />
0.00046<br />
0.00092<br />
FRCC<br />
RFC East<br />
All (FRCC)<br />
(RFCE)<br />
6.26E-04<br />
5.46E-04<br />
0.0020728<br />
0.0016307<br />
0.00358<br />
0.00779<br />
0.00075<br />
0.00056<br />
0.00008<br />
0.00006<br />
0.00066<br />
0.00049<br />
HICC<br />
RFC Michigan<br />
Miscellaneous<br />
(RFCM)<br />
(HIMS) 7.83E-04<br />
7.51E-04<br />
0.0073289<br />
0.0023449<br />
0.00569<br />
0.00740<br />
0.00010<br />
0.00027<br />
0.00000<br />
0.00003<br />
0.00008<br />
0.00024<br />
HICC<br />
RFC West<br />
Oahu<br />
(RFCW)<br />
(HIOA) 8.66E-04<br />
7.35E-04 0.0025807<br />
0.002588 0.00360<br />
0.00978<br />
0.00010<br />
0.00027<br />
0.00000<br />
0.00003<br />
0.00008<br />
0.00024<br />
MRO<br />
SERC<br />
East<br />
Midwest<br />
(MROE)<br />
(SRMW)<br />
8.78E-04<br />
8.75E-04<br />
0.0027473<br />
0.0022458<br />
0.00717<br />
0.00641<br />
0.00060<br />
0.00060<br />
0.00007<br />
0.00007<br />
0.00053<br />
0.00053<br />
MRO<br />
SERC<br />
West<br />
Mississippi<br />
(MROW)<br />
Valley (SRMV)<br />
8.72E-04<br />
4.81E-04<br />
0.0037138<br />
0.0012421<br />
0.00565<br />
0.00181<br />
0.00095<br />
0.00019<br />
0.00011<br />
0.00002<br />
0.00084<br />
0.00017<br />
NPCC<br />
SERC South<br />
Long Island<br />
(SRSO)<br />
(NYLI) 7.34E-04<br />
7.14E-04<br />
0.0016385<br />
0.0020613<br />
0.00375<br />
0.00887<br />
0.00104<br />
0.00019<br />
0.00012<br />
0.00002<br />
0.00092<br />
0.00017<br />
SERC Tennessee Valley (SRTV) 7.23E-04 0.0024819 0.00674 0.00019 0.00002 0.00017<br />
SERC Virginia/Carolina (SRVC) 5.45E-04 0.0016053 0.00589 0.00019 0.00002 0.00017<br />
SPP North (SPNO) 9.37E-04 0.0038455 0.00666 0.00084 0.00009 0.00074<br />
SPP South (SPSO) 7.86E-04 0.0023695 0.00347 0.00084 0.00009 0.00074<br />
WECC California (CAMX) 3.43E-04 0.0006177 0.00053 0.00057 0.00006 0.00050<br />
WECC Northwest (NWPP) 4.32E-04 0.0015889 0.00124 0.00060 0.00007 0.00053<br />
WECC Rockies (RMPA) 8.97E-04 0.0028128 0.00232 0.00098 0.00011 0.00087<br />
WECC Southwest (AZNM) 6.22E-04 0.0021114 0.00108 0.00098 0.00011 0.00087<br />
Reflective Ro<strong>of</strong> Energy Savings<br />
Utility Region<br />
Electricity<br />
kWh/ft^2<br />
Natural Gas<br />
therms/ft^2<br />
RFC West (RFCW) 0.864 -0.01<br />
USA Total 0.925 -0.0087<br />
RFCM, RFCW 0.864 -0.01<br />
ERCT 1.097 -0.0038<br />
RFCE 0.865 -0.0093<br />
SRMW 0.884 -0.0106<br />
MROE, MROW 0.83 -0.0149<br />
NYLI, NYCW, NYUP 0.774 -0.0133<br />
NEWE 0.794 -0.0128<br />
FRCC 1.183 -0.0006<br />
SRMV, SRSO, SRTV, SRVC 0.939 -0.0054<br />
SPNO, SPSO 0.981 -0.0066<br />
NWPP 0.771 -0.0125<br />
RMPA, AZNM 1.048 -0.0061<br />
CAMX 0.842 -0.0033<br />
Alaska 0.73 -0.021<br />
Hawaii 1.268 0<br />
0.000735433 0.0025807 0.0097844 0.00027 0.00003 0.000238<br />
Use the Map Below to Find your Utility Region<br />
Emissions Factors Table<br />
<strong>City</strong> <strong>of</strong> <strong>Urbana</strong><br />
87
4.4 APPENDIX E: CACP GREENHOUSE GAS EMISSIONS FACTORS<br />
Waste - Life Cycle Emissions Factors MTCO2e Reduced per ton <strong>of</strong> Waste Managed<br />
Source<br />
Reduction Recycling Composting<br />
Aluminum 8.33 13.71 NA<br />
Plastic (mixed) 2.06 1.56 NA<br />
Steel 3.23 1.83 NA<br />
Glass 0.61 0.32 NA<br />
Mixed Paper, Residential Definition 5.72 2.73 NA<br />
Cardboard 4.81 2.33 NA<br />
Magazines/Third-class Mail 7.88 2.29 NA<br />
Newspaper 3.60 1.51 NA<br />
Food Waste NA NA 0.16<br />
Yard Trimmings NA NA -0.54<br />
Clay Bricks 0.32 NA NA<br />
Dimensional Lumber 0.92 1.36 NA<br />
Waste - Landfill Methane Emissions MTCO2e Reduced per ton <strong>of</strong> waste Diverted<br />
Recoverable<br />
Energy<br />
(kWh/ton)<br />
Natl. Average No Recovery Recovery<br />
Aluminum 0.00 0.00 0.00 0.00<br />
Plastic (mixed) 0.00 0.00 0.00 0.00<br />
Steel 0.00 0.00 0.00 0.00<br />
Glass 0.00 0.00 0.00 0.00<br />
Mixed Paper, Residential Definition 1.06 2.02 0.50 248.50<br />
Cardboard 1.20 2.27 0.57 279.66<br />
Magazines/Third-class Mail 0.48 0.92 0.23 112.92<br />
Newspaper 0.43 0.81 0.20 99.41<br />
Food Waste 0.77 1.47 0.37 180.85<br />
Yard Trimmings 0.42 0.79 0.20 97.42<br />
Clay Bricks 0.00 0.00 0.00 0.00<br />
Dimensional Lumber 0.62 1.17 0.29 144.51<br />
Landfill Management Button Options<br />
LFG Capture<br />
LFG Utilization<br />
FALSE<br />
FALSE<br />
<strong>City</strong> <strong>of</strong> <strong>Urbana</strong><br />
88
4.4 APPENDIX F: POPULATION, EMPLOYMENT AND TRANSPORTATION GROWTH PROJECTIONS FOR 2020<br />
Mr. Hagston,<br />
To: Bart Hagston, <strong>City</strong> <strong>of</strong> <strong>Urbana</strong> Environmental Sustainability Manager<br />
From: Andrew Levy, Planner II<br />
Date: 6/6/2011<br />
RE: VMT and Employment Projections<br />
The following information is a response to your request for information that can be used in the <strong>Urbana</strong> Climate<br />
Action Plan. I have provided additional contextual information to help you determine the use and usefulness <strong>of</strong><br />
the numbers generated by the Champaign <strong>Urbana</strong> Urbanized Area Transportation Study (CUUATS).<br />
CUUATS completed population and employment projections for the Champaign <strong>Urbana</strong> Urbanized Area as<br />
part <strong>of</strong> the Long Range Transportation Plan (LRTP) 2035 adopted in 2009. Projections and travel demand<br />
model information is based on Traffic Analysis Zones (TAZs). There are 168 TAZs in the Champaign <strong>Urbana</strong><br />
Urbanized Area. Of these, 65 contain a portion <strong>of</strong> the <strong>City</strong> <strong>of</strong> <strong>Urbana</strong> or are adjacent to the <strong>City</strong>. A map is<br />
attached showing the <strong>Urbana</strong> TAZs.<br />
The current projections were completed in 2008 as a part <strong>of</strong> the LRTP 2035. At that time, population and<br />
employment projections were completed for each TAZ. During the update process, city staff was interviewed<br />
regarding potential development areas. Population projections for the identified TAZ area are as follows:<br />
2005 – 45,829<br />
2015 – 54,793<br />
2025 – 60,288<br />
2035 – 62,616<br />
Please note that the population in 2005 is larger than the city population because the TAZ area encompasses a<br />
larger geographic area than the corporate limits. The 2010 Census population for this geographic area is<br />
49,760.<br />
CUUATS Employment Projections are divided into four categories, Industrial, Education and Government,<br />
Service, and Retail. For this summary, Service and Retail are combined to achieve the Commercial<br />
employment category. Education and Government sector is not included in this analysis. When the projections<br />
were developed, no distinction could be made between changes in employment that might occur during the<br />
2025 – 2035 time range for <strong>Urbana</strong>. The result was a decision to carryover the population and employment<br />
statistics from 2025 to 2035. With Olympian Drive and other projects moving forward at this time, there is<br />
potentially new information that could be added to the current projections. CUUATS expects to complete<br />
projections again in the near future incorporating Census 2010 data and potential development that can be<br />
estimated at that time.<br />
<strong>City</strong> <strong>of</strong> <strong>Urbana</strong><br />
89
4.4 APPENDIX F: POPULATION, EMPLOYMENT AND TRANSPORTATION GROWTH PROJECTIONS FOR 2020<br />
The current series <strong>of</strong> employment projections show employment growth between 2005 and 2035for commercial<br />
and industrial sectors (79.8% and 36.5% respectively). Each projection is based on 10-year development<br />
expectations as identified by CUUATS and <strong>City</strong> <strong>of</strong> <strong>Urbana</strong> staff. This rather than a linear type projection,<br />
development is estimated on a 10 year basis and population and employment figures are attributed to the<br />
expected development. Instead <strong>of</strong> using a 30 year trend line, 10-year annual compound growth rates can be<br />
used to determine interstitial data figures. If more development is expected in the first half <strong>of</strong> the 10 years, the<br />
trend can be modified to suit expectations. The following two tables show the current projections and<br />
interstitial data figures using a flat annual compound growth rate.<br />
CUUATS Employment Projections – 2005 to 2035<br />
2005 2015 2025 2035 Percent<br />
Growth<br />
2005-2035<br />
Commercial 12,024 15,935 21,629 21,629 79.8%<br />
Annual Compound<br />
NA 2.86% 3.10% 0% NA<br />
Growth Rate<br />
Industrial 3,496 4,581 4,771 4,771 36.5%<br />
Annual Compound<br />
Growth Rate<br />
NA 2.74% 0.41% 0% NA<br />
Possible Baseline and Horizon Projections for <strong>Urbana</strong> Climate Action Plan<br />
2007 2020 Percent<br />
Growth<br />
2007-2020<br />
Commercial 12,722 18,004 41.5%<br />
Industrial 3,690 4,674 26.7%<br />
Using these population and employment projections, Daily Vehicle Miles traveled have been modeled using the<br />
CUUATS Travel Demand Model. The calculation includes arterial streets, collector streets, and some local<br />
roads. Interstates were excluded due to the heavy volume <strong>of</strong> through traffic. Some local roads were excluded<br />
because they are not used in the Travel Demand Model. If Annual Vehicle Miles Traveled are needed, this can<br />
be calculated several different ways. The simplest is multiplying by 365 days in the year. An alternate method<br />
is to define miles traveled reductions for weekend and holiday travel. I recommend that this type <strong>of</strong><br />
modification be completed at the direction <strong>of</strong> the commission or city staff.<br />
Page | 2<br />
<strong>City</strong> <strong>of</strong> <strong>Urbana</strong><br />
90
4.4 APPENDIX F: POPULATION, EMPLOYMENT AND TRANSPORTATION GROWTH PROJECTIONS FOR 2020<br />
Vehicle Miles Traveled for <strong>Urbana</strong> Traffic Analysis Zones<br />
2005 2015 2025 2035 Percent<br />
Growth<br />
2005-2035<br />
Daily VMT 549,805 740,268 1,084,466 1,110,933 102.1%<br />
Annual VMT (365 days) 200,678,825 270,197,455 395,830,090 405,490,545 NA<br />
Annual Compound<br />
Growth Rate<br />
NA 3.02% 3.89% 0.24% NA<br />
Vehicle miles traveled for the <strong>Urbana</strong> TAZ area are expected to increase at the rates shown in the table above.<br />
The increase between 2025 and 2035 is minimal because population and employment projections were similar<br />
for both horizon years. As we receive more information about potential development, this number is expected<br />
to change.<br />
For comparison, the Illinois Department <strong>of</strong> Transportation catalogs annual VMT for each County in Illinois 1 .<br />
These numbers could be used to refine or adjust projections as needed. While VMT decreased in recent years<br />
past, 2010 saw an increase <strong>of</strong> VMT in Champaign County.<br />
If these projections do not reflect the thoughts <strong>of</strong> the <strong>Urbana</strong> Sustainability Advisory Commission, there are<br />
several methodological alternatives that could be considered.<br />
A: The existing employment projections could be used and an average growth rate applied rather than<br />
the annual compound growth rates. This would reflect a linear projection and assume that the existing<br />
projections are acceptable. An average growth rate could also be applied to Vehicle Miles Traveled.<br />
This option does not require additional analysis or use <strong>of</strong> the travel demand model.<br />
B: The same procedure as described in Option A, but the 2025 projection is used to determine average<br />
annual growth rate. This option does not require additional analysis or use <strong>of</strong> the travel demand model.<br />
C: Establish new projections based on current knowledge <strong>of</strong> development trends. In order to obtain<br />
vehicle miles traveled, the new projections will need to be completed for each TAZ. The new<br />
projections will need to be entered into the travel demand model to obtain the resulting Vehicle Miles<br />
Traveled.<br />
Note:<br />
The CUUATS travel demand model currently predicts transit trips which are included in the VMT calculation. However, the model is<br />
not sensitive to fuel price, parking fees or other policies that may impact transit ridership. This functionality is under development.<br />
Feel free to contact me with questions or concerns. This memo may be cited as the data source.<br />
Sincerely,<br />
Andrew Levy<br />
1 http://www.dot.il.gov/adttravelstats.html<br />
Page | 3<br />
<strong>City</strong> <strong>of</strong> <strong>Urbana</strong><br />
91
4.4 APPENDIX F: POPULATION, EMPLOYMENT AND TRANSPORTATION GROWTH PROJECTIONS FOR 2020<br />
Forecasted Growth Projections for Climate Action Plan<br />
Prepared by Bart Hagston<br />
These projections are based upon data provided in a 6/6/11 memo from Andrew Levy at<br />
CCRPC/CUUATS.<br />
Population<br />
CCRPC projects <strong>Urbana</strong> Traffic Analysis Zone (TAZ) population. TAZ population is larger than <strong>City</strong> <strong>of</strong><br />
<strong>Urbana</strong>. So I applied the compound annual growth rate (CAGR) I derived from CCRPC to the US Census<br />
population data for <strong>Urbana</strong>.<br />
CCRPC projects <strong>Urbana</strong> TAZ population for 2005 as 45,829 and 2015 population as 54,793 (1.8% CAGR<br />
for 2005 - 2015). Population for 2025 projected at 60,288 (0.96% CAGR for 2015 – 2025).<br />
US Census – <strong>Urbana</strong> city population in 2000 = 36,395. 2010 = 41,250 (1.26% CAGR for 2000 - 2010).<br />
I applied the 1.26% CAGR to the 2000 Census population for the years 2000 – 2007 to get the 2007<br />
population <strong>of</strong> 41,250. Since we are deducting 5,600 U <strong>of</strong> I student housing residents from the <strong>Urbana</strong><br />
CAP, that gives us a net population for the CAP <strong>of</strong> 34,129 (41,250-5,600).<br />
To get the 2020 population I applied the 1.8% CAGR derived from CCRPC for the years 2007 – 2015 and<br />
applied the 0.96% CAGR for 2016 – 2020. This resulted in a 2020 <strong>City</strong> population <strong>of</strong> 48,066. Minus the<br />
5,6000 U <strong>of</strong> I student housing residents, left a net population for CAP planning purposes <strong>of</strong> 42,466.<br />
Overall, the CAGR for 2007 – 2020 turns out to be 1.48%.<br />
Employment<br />
On page 2 <strong>of</strong> the CCRPC memo, he points out commercial and industrial employment numbers for 2007<br />
and project numbers for 2020. I took the percent growth for that time period, as stated in the memo,<br />
and broke it down into CAGR (as that is what is called for in the CACP inventory s<strong>of</strong>tware). The CAGR for<br />
commercial employment for 2007 – 2020 is 2.71% and for industrial employment for the same period it<br />
is 1.84%.<br />
VMT<br />
On page 3 <strong>of</strong> the CCRPC memo, he points out that VMT between 2005 – 2015 is projected to increase at<br />
3.02% CAGR. The CAGR for 2015 – 2025 is projected even higher. I simply used the 3.02% for the 2007<br />
2020 planning period as I did not have high confidence in the even greater growth percentage projected<br />
for 2015 -2025. The numbers provided are for the <strong>Urbana</strong> TAZ, not <strong>City</strong> <strong>of</strong> <strong>Urbana</strong>, although the growth<br />
rates are assumed to be similar. Rod Fletcher had some hand-written notes from CUUATS that indicated<br />
the VMT within <strong>Urbana</strong> city limits for 2005 was 179,200,000. So I applied the 3.02% CAGR to the 2005<br />
VMT to get the miles for 2007 and the projected VMT for 2020 (280,002,035).<br />
<strong>City</strong> <strong>of</strong> <strong>Urbana</strong><br />
92
4.4 APPENDIX G: STATE OF ILLINOIS ELECTRIC VEHICLE ADVISORY COUNCIL RECOMMENDATIONS<br />
Illinois Electric Vehicle Advisory Council December 30, 2011<br />
Final Report<br />
The EVAC’s recommendations are prioritized based on their timeframe for initiation:<br />
• Short‐term – In the next six months after this report is released, i.e., by the end <strong>of</strong> the<br />
Spring 2012 legislative session;<br />
• Medium‐term – From six to eighteen months after this report is released, i.e., by the<br />
end <strong>of</strong> the Spring 2013 legislative session;<br />
• Long‐term – From eighteen months and forward after this report is released.<br />
1. Encourage and facilitate EV infrastructure installation.<br />
1.1 The General Assembly should ensure that EV charging stations are not<br />
regulated as public utilities or Alternative Retail Electric Suppliers (ARES)<br />
solely because they provide EV charging services.<br />
1.2 DCEO and other stakeholders should convene local government <strong>of</strong>ficials<br />
and staff to streamline EV‐related permitting procedures and building<br />
code provisions across local jurisdictions.<br />
1.3 DCEO and other stakeholders should coordinate planning efforts to<br />
optimize Illinois’ network <strong>of</strong> public EV charging stations.<br />
1.4 State agencies should establish a set <strong>of</strong> technology standards for any EV<br />
charging stations purchased or installed using state funds.<br />
1.5 Electricity providers 1 , the Smart Grid Advisory Council, and other<br />
stakeholders should collaborate to ensure that smart grid infrastructure<br />
supports and leverages EV technologies and applications.<br />
Short‐term<br />
Short‐term<br />
Short‐ to<br />
medium‐term<br />
Short‐ to<br />
medium‐term<br />
Short‐ to<br />
long‐term<br />
2. Encourage EV purchases and charging infrastructure development through incentives.<br />
2.1 DCEO should use state capital funds to create an incentive program for<br />
owners <strong>of</strong> multi‐unit residential buildings to install charging stations in<br />
shared or common area parking spaces.<br />
2.2 The General Assembly and the Governor should support IEPA‐proposed<br />
legislation to generate additional revenues for the Alternate Fuels Fund<br />
through a $1 increase in the annual vehicle license plate renewal fee.<br />
2.3 DCEO and IEPA should use new and existing funding sources to support<br />
EV infrastructure installation in strategic locations.<br />
2.4 The Governor’s Office, in collaboration with state agencies, should work<br />
with Illinois’ Congressional Delegation to convert the federal EV tax<br />
credit (currently up to $7,500) to a rebate or point‐<strong>of</strong>‐sale discount.<br />
2.5 State and local governments and businesses should consider creating<br />
targeted incentives for EV drivers.<br />
Short‐term<br />
Short‐ to<br />
medium‐term<br />
Short‐ to<br />
long‐term<br />
Medium‐ to<br />
long‐term<br />
Medium‐ to<br />
long‐term<br />
1 The term “electricity providers” is used to describe collectively the investor‐owned utilities, Alternative Retail<br />
Electric Suppliers (ARES), municipal utilities, and cooperatives.<br />
Page 2<br />
<strong>City</strong> <strong>of</strong> <strong>Urbana</strong><br />
93
4.4 APPENDIX G: STATE OF ILLINOIS ELECTRIC VEHICLE ADVISORY COUNCIL RECOMMENDATIONS<br />
Illinois Electric Vehicle Advisory Council December 30, 2011<br />
Final Report<br />
2.6 Local governments and commercial fleets should consider adopting<br />
ordinances or policies to establish goals for employees’ use <strong>of</strong> EVs.<br />
2.7 The Illinois state fleet should work to achieve the EV purchase target<br />
established in Governor Quinn’s Executive Order 11 (2009).<br />
Long‐term<br />
Long‐term<br />
3. Promote efficient and renewable electricity use by EVs.<br />
3.1 Electricity providers should <strong>of</strong>fer time‐variant electricity rate options that<br />
encourage EV charging during <strong>of</strong>f‐peak hours <strong>of</strong> the day.<br />
3.2 Utilities (to the extent allowed under Integrated Distribution Company<br />
(IDC) rules), other electricity providers, and other stakeholders should<br />
promote time‐variant electricity rate options to EV owners.<br />
3.3 ICC Staff should monitor, and other stakeholders should study, early EV<br />
charging behavior in Illinois to determine whether additional programs or<br />
initiatives are needed to achieve <strong>of</strong>f‐peak vehicle charging.<br />
3.4 The General Assembly and other stakeholders should enable, support,<br />
and incentivize renewable energy installations that <strong>of</strong>fset EV charging<br />
loads and provide clean energy to the grid.<br />
3.5 Electricity providers and other stakeholders should provide renewable<br />
energy supply options for EV owners.<br />
3.6 The General Assembly, or alternatively the ICC, should ensure that<br />
renewable energy temporarily stored in batteries can qualify for netmetering.<br />
3.7 The EVAC should continue to monitor whether additional policies are<br />
needed to encourage <strong>of</strong>f‐peak vehicle charging and integration <strong>of</strong> EV<br />
charging with clean, renewable energy.<br />
Short‐ to<br />
medium‐term<br />
Short‐ to<br />
long‐term<br />
Short‐ to<br />
long‐term<br />
Short‐ to<br />
long‐term<br />
Short‐ to<br />
medium‐term<br />
Short‐ to<br />
medium‐term<br />
Medium‐term<br />
4. Educate the public on EVs, their use and benefits.<br />
4.1 The EVAC should request data annually from appointees and<br />
stakeholders to evaluate the efficacy <strong>of</strong>, and identify needed<br />
improvements to, state EV policies, programs, and incentives.<br />
4.2 The Governor and state agencies should publicize the benefits <strong>of</strong> EVs, the<br />
state’s EV policies, incentives, and other relevant program information.<br />
4.3 Auto manufacturers and dealers should inform consumers <strong>of</strong> EV<br />
features, incentives, charging procedures, electricity rate options, utility<br />
notification for charging stations, and responsible post‐life battery<br />
options.<br />
4.4 Electricity providers should provide consumers with information on<br />
electricity rate options, comparative fuel cost savings, and notification<br />
for charging station installations.<br />
Short‐to<br />
medium‐term<br />
Short‐ to<br />
medium‐term<br />
Short‐ to<br />
medium‐term<br />
Short‐ to<br />
medium‐term<br />
Page 3<br />
<strong>City</strong> <strong>of</strong> <strong>Urbana</strong><br />
94
4.4 APPENDIX G: STATE OF ILLINOIS ELECTRIC VEHICLE ADVISORY COUNCIL RECOMMENDATIONS<br />
Illinois Electric Vehicle Advisory Council December 30, 2011<br />
Final Report<br />
4.5 EV supply equipment (EVSE) providers should provide information on<br />
charging station features, specifications, costs, and incentives;<br />
installation, operation, and maintenance procedures; electricity rate<br />
options; public charging locations; and notification for installations.<br />
4.6 Local governments should provide information and instructions on EVrelated<br />
local regulations, incentives, electricity rate options, public<br />
charging locations, and utility notification for charging stations.<br />
4.7 Environmental and other public interest groups should provide<br />
information on the environmental benefits <strong>of</strong> EVs, responsible post‐life<br />
battery options, and utility notification for charging stations.<br />
4.8 First responders and public safety organizations should provide<br />
information to consumers and public safety personnel regarding safety<br />
protocols for EVs and EVSE.<br />
4.9 Educational institutions and providers and the Illinois Green Economy<br />
Network (IGEN) should provide information on EVs to their students and<br />
communities.<br />
Short‐ to<br />
medium‐term<br />
Short‐ to<br />
medium‐term<br />
Short‐ to<br />
medium‐term<br />
Short‐ to<br />
medium‐term<br />
Medium‐ to<br />
long‐term<br />
5. Support the EV and EVSE industry and associated job creation in Illinois.<br />
5.1 DCEO should attract EV/EVSE supply chain manufacturing to Illinois<br />
through the creation <strong>of</strong> a business development grant program utilizing<br />
state capital funds for EV manufacturing and infrastructure.<br />
5.2 IEPA, DCEO, and other stakeholders should provide non‐financial<br />
incentives to EV/EVSE manufacturers and service companies to promote<br />
locating and expanding in Illinois.<br />
5.3 The Governor’s Office, DCEO, Argonne National Laboratory, and<br />
universities should support research, development, and demonstration<br />
<strong>of</strong> EV‐ and EVSE‐related technologies, including smart grid integration<br />
technologies, in Illinois.<br />
5.4 DCEO, the Illinois Science and Technology Coalition (ISTC), the Clean<br />
Energy Trust, and universities should support entrepreneurs in the<br />
EV/EVSE sector through various existing services and programs.<br />
5.5 DCEO, universities, colleges, and IGEN should train new and current<br />
members <strong>of</strong> Illinois’ workforce with the knowledge, skills, and expertise<br />
that EV/EVSE businesses are seeking.<br />
5.6 IEPA should convene a state working group to explore EV battery end‐<strong>of</strong>life<br />
options, identify the optimal approach among these options, and<br />
formulate a plan for implementing the approach.<br />
Short‐ to<br />
medium‐term<br />
Short‐ to<br />
long‐term<br />
Short‐ to<br />
medium‐term<br />
Short‐ to<br />
long‐term<br />
Medium‐ to<br />
long‐term<br />
Medium‐ to<br />
long‐term<br />
Page 4<br />
<strong>City</strong> <strong>of</strong> <strong>Urbana</strong><br />
95
4.4 APPENDIX H: $ 1,000 ENERGY CHALLENGE: LOW OR NO COST <strong>ACTION</strong>S YOU CAN TAKE<br />
Take the<br />
$1,000 Energy Challenge<br />
Avg Savings/Yr<br />
Move thermostat down 3° in winter<br />
and up 3° in summer $ 140<br />
Replace 5 incandescent bulbs with CFLs 80<br />
Replace furnace filters as recommended 75<br />
Wash clothes in cold water 265<br />
Eliminate 10 miles <strong>of</strong> driving per week 99<br />
Keep car tuned up and tires properly inflated 360<br />
AND<br />
you reduce<br />
CO 2 emissions<br />
by 6.68 metric<br />
tons!<br />
TOTAL SAVINGS $1,000<br />
Sources:<br />
Ameren Illinois Utilities<br />
Alliance to Save Energy<br />
Chicago Climate Action Plan<br />
Compiled by <strong>City</strong> <strong>of</strong> <strong>Urbana</strong> Environmental Management Division<br />
Printed on paper manufactured with 50% bamboo fibers and 50% post-consumer fibers.<br />
<strong>City</strong> <strong>of</strong> <strong>Urbana</strong><br />
96
4.4 APPENDIX J: ENERGY AND EMISSIONS FLOW DIAGRAMS<br />
Estimated U.S. Energy Use in 2010: ~98.0 Quads<br />
Lawrence Livermore<br />
National Laboratory<br />
Solar<br />
0.11<br />
0.01<br />
8.44<br />
Net Electricity<br />
Imports<br />
12.71<br />
0.09<br />
Nuclear<br />
8.44<br />
Hydro<br />
2.51<br />
Wind<br />
0.92<br />
Geothermal<br />
0.21<br />
2.49<br />
0.92<br />
0.15<br />
7.52<br />
19.13<br />
Electricity<br />
Generation<br />
39.49<br />
0.10<br />
5.06<br />
0.04<br />
0.42<br />
4.95<br />
1.22<br />
Residential<br />
11.79<br />
9.43<br />
2.36<br />
26.78<br />
Rejected<br />
Energy<br />
56.13<br />
Natural<br />
Gas<br />
24.65<br />
0.02<br />
3.28<br />
0.02<br />
0.06<br />
0.11<br />
4.54<br />
0.71<br />
3.28<br />
Commercial<br />
8.71<br />
4.65<br />
1.74<br />
6.97<br />
Energy<br />
Services<br />
41.88<br />
Coal<br />
20.82<br />
1.62<br />
2.23<br />
8.11<br />
8.01<br />
Industrial<br />
23.27<br />
18.62<br />
Biomass<br />
4.29<br />
0.44<br />
0.38<br />
0.68<br />
1.10<br />
0.03<br />
20.59<br />
Petroleum<br />
35.97<br />
25.65<br />
Transportation<br />
27.45<br />
6.86<br />
Source: LLNL 2011. Data is based on DOE/EIA-0384(2010), October 2011. If this information or a reproduction <strong>of</strong> it is used, credit must be given to the Lawrence Livermore National Laboratory<br />
and the Department <strong>of</strong> Energy, under whose auspices the work was performed. Distributed electricity represents only retail electricity sales and does not include self-generation. EIA<br />
reports flows for hydro, wind, solar and geothermal in BTU-equivalent values by assuming a typical fossil fuel plant "heat rate." (see EIA report for explanation <strong>of</strong> change to geothermal in 2010).<br />
The efficiency <strong>of</strong> electricity production is calculated as the total retail electricity delivered divided by the primary energy input into electricity generation. End use efficiency is estimated as 80% for<br />
the residential, commercial and industrial sectors, and as 25% for the transportation sector. Totals may not equal sum <strong>of</strong> components due to independent rounding. LLNL-MI-410527<br />
Source: Simon, A., & Belles, R. (2011). Estimated State-Level Energy Flows in 2008, Lawrence Livermore National Lab (LLNL).<br />
<strong>City</strong> <strong>of</strong> <strong>Urbana</strong><br />
97
4.4 APPENDIX J: ENERGY AND EMISSIONS FLOW DIAGRAMS<br />
Estimated Illinois Energy Use In 2008<br />
~4554.0 Trillion BTU<br />
Lawrence Livermore<br />
National Laboratory<br />
Solar<br />
1.6<br />
Nuclear<br />
994.6<br />
994.6<br />
162.4<br />
Net Electricity<br />
Exports<br />
Hydro<br />
1.4<br />
Wind<br />
23.0<br />
Geothermal<br />
1.4<br />
Natural<br />
Gas<br />
1014.6<br />
1.4<br />
23.0<br />
35.2<br />
9.5<br />
1.6<br />
472.4<br />
1.6<br />
Electricity<br />
Generation<br />
2068.5<br />
1.4<br />
656.0<br />
225.5<br />
4.2<br />
0.5<br />
4.0<br />
24.6<br />
159.6<br />
27.1<br />
176.6<br />
11.6<br />
1412.6<br />
Residential<br />
687.2<br />
Commercial<br />
421.9<br />
240.5<br />
446.7<br />
126.6<br />
295.3<br />
Rejected<br />
Energy<br />
2715.9<br />
Coal<br />
1103.2<br />
1003.2<br />
267.7<br />
95.3<br />
10.0<br />
155.3<br />
319.3<br />
Industrial<br />
847.6<br />
169.5<br />
678.1<br />
Energy<br />
Services<br />
1675.6<br />
13.7<br />
Biomass<br />
90.3<br />
1.9<br />
42.2<br />
964.5<br />
Transportation<br />
1022.4<br />
766.8<br />
Petroleum<br />
1324.1<br />
255.6<br />
Source: LLNL 2010. Data is based on DOE/EIA-0214(2008), June 2010. If this information or a reproduction <strong>of</strong> it is used, credit must be given to the Lawrence Livermore National Laboratory and the Department<br />
<strong>of</strong> Energy, under whose auspices the work was performed. Distributed electricity represents only retail electricity sales and does not include self-generation. EIA reports flows for non-thermal resources<br />
(i.e., hydro, wind and solar) in BTU-equivalent values by assuming a typical fossil fuel plant "heat rate." The efficiency <strong>of</strong> electricity production is calculated as the total retail electricity delivered divided by the primary<br />
energy input into electricity generation. Interstate and international electricity trade are lumped into net imports or exports and are calculated using a system-wide generation efficiency. End use efficiency is estimated<br />
as 65% for the residential, 70% for the commercial, 80% for the industrial sector, and as 25% for the transportation sector. Totals may not equal sum <strong>of</strong> components due to independent rounding. LLNL-MI-410527<br />
Source: Simon, A., & Belles, R. (2011). Estimated State-Level Energy Flows in 2008, Lawrence Livermore National Lab (LLNL).<br />
<strong>City</strong> <strong>of</strong> <strong>Urbana</strong><br />
98
4.4 APPENDIX J: ENERGY AND EMISSIONS FLOW DIAGRAMS<br />
World GHG Emissions Flow Chart<br />
Sector End Use/Activity Gas<br />
Transportation 13.5%<br />
Road<br />
9.9%<br />
Air<br />
Rail, Ship, & Other Transport<br />
1.6%<br />
2.3%<br />
Electricity & Heat 24.6%<br />
Other Fuel<br />
Combustion<br />
9.0%<br />
Residential Buildings<br />
Commercial Buildings<br />
Unallocated Fuel Combustion<br />
Iron & Steel<br />
Aluminum/Non-Ferrous Metals<br />
Machinery<br />
Pulp, Paper & Printing<br />
Food & Tobacco<br />
Chemicals<br />
9.9%<br />
5.4%<br />
3.5%<br />
3.2%<br />
1.4%<br />
1.0%<br />
1.0%<br />
1.0%<br />
4.8%<br />
Carbon Dioxide<br />
(CO 2 ) 77%<br />
E N E R G Y<br />
Cement<br />
3.8%<br />
Industry<br />
10.4%<br />
Other Industry<br />
5.0%<br />
T&D Losses<br />
Coal Mining<br />
1.9%<br />
1.4%<br />
Fugitive Emissions<br />
3.9%<br />
Industrial Processes 3.4%<br />
Oil/Gas Extraction, Refining<br />
& Processing<br />
6.3%<br />
Land Use Change 18.2%<br />
Deforestation<br />
Afforestation<br />
Reforestation<br />
Harvest/Management<br />
Other<br />
18.3%<br />
-1.5%<br />
-0.5%<br />
2.5%<br />
-0.6%<br />
Agricultural Energy Use<br />
Agriculture Soils<br />
1.4%<br />
6.0%<br />
Methane<br />
(CH 4 ) 14%<br />
Agriculture 13.5%<br />
Livestock & Manure<br />
5.1%<br />
Waste<br />
3.6%<br />
Rice Cultivation<br />
Other Agriculture<br />
Landfills<br />
Wastewater, Other Waste<br />
1.5%<br />
0.9%<br />
2.0%<br />
1.6%<br />
Nitrous Oxide<br />
(N 2 O) 8%<br />
Sources & Notes: All data is for 2000. All calculations are based on CO2 equivalents, using 100-year global warming potentials from the IPCC (1996), based on a total global estimate <strong>of</strong><br />
41,755 MtCO2 equivalent. Land use change includes both emissions and absorptions; see Chapter 16. See Appendix 2 for detailed description <strong>of</strong> sector and end use/activity definitions, as well as data sources.<br />
Dotted lines represent flows <strong>of</strong> less than 0.1% percent <strong>of</strong> total GHG emissions.<br />
Source: World Resources Institute www.wri.org<br />
Baumert, K. A., Herzog, T., & Pershing, J. (2005). Navigating the Numbers Greenhouse Gas Data and International Climate Policy. World Resources Institute.<br />
HFCs, PFCs,<br />
SF 6 1%<br />
<strong>City</strong> <strong>of</strong> <strong>Urbana</strong><br />
99
4.4 APPENDIX J: ENERGY AND EMISSIONS FLOW DIAGRAMS<br />
U.S. GHG Emissions Flow Chart<br />
Sector/IPCC Reporting Category End Use/Activity Gas<br />
Transportation 27.2%<br />
Road<br />
21.6%<br />
Air<br />
3.3%<br />
Rail, Ship, & Other Transport<br />
2.3%<br />
Residential Buildings<br />
15.3%<br />
Electricity & Heat 32.4%<br />
E N E R G Y<br />
Other Fuel<br />
Combustion<br />
11.7%<br />
Commercial Buildings<br />
Unallocated Fuel Combustion<br />
Iron & Steel<br />
Aluminum/Non-Ferrous Metals<br />
Machinery<br />
Pulp, Paper & Printing<br />
Food & Tobacco<br />
12.0%<br />
4.5%<br />
2.2%<br />
1.2%<br />
1.5%<br />
2.3%<br />
1.7%<br />
Carbon Dioxide<br />
(CO 2 ) 85%<br />
Chemicals<br />
8.5%<br />
Industry<br />
12.4%<br />
Cement<br />
2.3%<br />
Other Industry<br />
5.9%<br />
Fugitive Emissions 3.0%<br />
Industrial Processes 4.5%<br />
Agriculture<br />
Waste<br />
6.2%<br />
2.6%<br />
T&D Losses 2.6%<br />
Coal Mining 1.0%<br />
Oil/Gas Extraction,<br />
3.0%<br />
Refining & Processing<br />
Agriculture Soils<br />
Livestock & Manure<br />
Landfills<br />
Wastewater, Other Waste<br />
Rice/Other Agriculture 0.1%<br />
3.6%<br />
2.5%<br />
1.9%<br />
0.8%<br />
HFCs, PFCs, SF 6 2%<br />
Methane<br />
(CH 4 ) 8%<br />
Nitrous Oxide<br />
(N 2 O) 5%<br />
Sources & Notes: Emissions data comes from the Inventory <strong>of</strong> U.S. Greenhouse Gas Emissions and Sinks: 1990-2003, U.S. EPA (using the CRF document). Allocations from “Electricity & Heat” and “Industry” to end uses<br />
are WRI estimates based on energy use data from the International Energy Agency (IEA, 2005). All data is for 2003. All calculations are based on CO2 equivalents, using 100-year global warming potentials from the IPCC<br />
(1996), based on total U.S. emissions <strong>of</strong> 6,978 MtCO2 equivalent. Emissions from fuels in international bunkers are included under Transportation. Emissions from solvents are included under Industrial Processes.<br />
Emissions and sinks from land use change and forestry (LUCF), which account for a sink <strong>of</strong> 821.6 MtCO2 equivalent, and flows less than 0.1 percent <strong>of</strong> total emissions are not shown. For detailed descriptions <strong>of</strong> sector and<br />
end use/activity definitions, see Navigating the Numbers: Greenhouse Gas Data and International Climate Policy (WRI, 2005).<br />
Source: World Resources Institute www.wri.org<br />
<strong>City</strong> <strong>of</strong> <strong>Urbana</strong><br />
100
4.4 APPENDIX K: URBANA CITY COUNCIL RESOLUTION ADOPTING THE PHASE I <strong>CLIMATE</strong> <strong>ACTION</strong> <strong>PLAN</strong><br />
<strong>City</strong> <strong>of</strong> <strong>Urbana</strong><br />
101
www.urbanaillinois.us/climateactionplan