CLIMATE ACTION PLAN - City of Urbana
CLIMATE ACTION PLAN - City of Urbana
CLIMATE ACTION PLAN - City of Urbana
- No tags were found...

You also want an ePaper? Increase the reach of your titles
YUMPU automatically turns print PDFs into web optimized ePapers that Google loves.
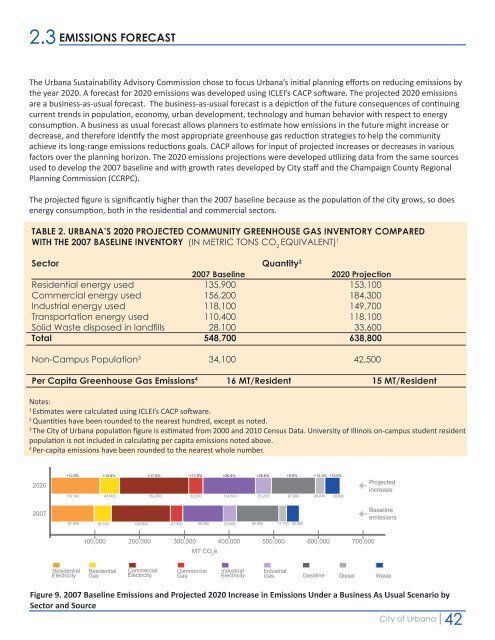
2.3<br />
EMISSIONS FORECAST<br />
The <strong>Urbana</strong> Sustainability Advisory Commission chose to focus <strong>Urbana</strong>’s initial planning efforts on reducing emissions by<br />
the year 2020. A forecast for 2020 emissions was developed using ICLEI’s CACP s<strong>of</strong>tware. The projected 2020 emissions<br />
are a business-as-usual forecast. The business-as-usual forecast is a depiction <strong>of</strong> the future consequences <strong>of</strong> continuing<br />
current trends in population, economy, urban development, technology and human behavior with respect to energy<br />
consumption. A business as usual forecast allows planners to estimate how emissions in the future might increase or<br />
decrease, and therefore identify the most appropriate greenhouse gas reduction strategies to help the community<br />
achieve its long-range emissions reductions goals. CACP allows for input <strong>of</strong> projected increases or decreases in various<br />
factors over the planning horizon. The 2020 emissions projections were developed utilizing data from the same sources<br />
used to develop the 2007 baseline and with growth rates developed by <strong>City</strong> staff and the Champaign County Regional<br />
Planning Commission (CCRPC).<br />
The projected figure is significantly higher than the 2007 baseline because as the population <strong>of</strong> the city grows, so does<br />
energy consumption, both in the residential and commercial sectors.<br />
TABLE 2. URBANA’S 2020 PROJECTED COMMUNITY GREENHOUSE GAS INVENTORY COMPARED<br />
WITH THE 2007 BASELINE INVENTORY (IN METRIC TONS CO 2<br />
EQUIVALENT) 1<br />
Sector Quantity 2<br />
2007 Baseline 2020 Projection<br />
Residential energy used 135,900 153,100<br />
Commercial energy used 156,200 184,300<br />
Industrial energy used 118,100 149,700<br />
Transportation energy used 110,400 118,100<br />
Solid Waste disposed in landfills 28,100 33,600<br />
Total 548,700 638,800<br />
Non-Campus Population 3 34,100 42,500<br />
Per Capita Greenhouse Gas Emissions 4 16 MT/Resident 15 MT/Resident<br />
Notes:<br />
1<br />
Estimates were calculated using ICLEI’s CACP s<strong>of</strong>tware.<br />
2<br />
Quantities have been rounded to the nearest hundred, except as noted.<br />
3<br />
The <strong>City</strong> <strong>of</strong> <strong>Urbana</strong> population figure is estimated from 2000 and 2010 Census Data. University <strong>of</strong> Illinois on-campus student resident<br />
population is not included in calculating per capita emissions noted above.<br />
4<br />
Per-capita emissions 2007 have Baseline been and rounded 2020 Projected to the nearest Emissions whole Increase number. in a ‘Business as Usual’ Scenario<br />
2020<br />
+12.5% +12.8% +17.8% +17.9% +26.8% +26.6% +5.8% +13.3% +13.6%<br />
110,100<br />
43,000<br />
152,000 32,300 114,500 35,200 97,900 20,200 20,100 33,500 33,600<br />
Projected<br />
increase<br />
2007<br />
97,800<br />
38,100<br />
129,000<br />
27,400<br />
90,300<br />
27,800<br />
92,600<br />
17,700 28,000<br />
Baseline<br />
emissions<br />
100,000 200,000 300,000 400,000 500,000 600,000 700,000<br />
MT CO 2<br />
e<br />
Residential Residential Commercial Commercial Industrial Industrial<br />
Electricity Gas Electricity Gas Electricity Gas<br />
Gasoline Diesel Waste<br />
Note: Figures are rounded to the nearest hundred and shown in MT CO 2<br />
e<br />
Figure 9. 2007 Baseline Emissions and Projected 2020 Increase in Emissions Under a Business As Usual Scenario by<br />
Sector and Source<br />
<strong>City</strong> <strong>of</strong> <strong>Urbana</strong><br />
42