CLIMATE ACTION PLAN - City of Urbana
CLIMATE ACTION PLAN - City of Urbana
CLIMATE ACTION PLAN - City of Urbana
- No tags were found...

You also want an ePaper? Increase the reach of your titles
YUMPU automatically turns print PDFs into web optimized ePapers that Google loves.
4.4 APPENDIX F: POPULATION, EMPLOYMENT AND TRANSPORTATION GROWTH PROJECTIONS FOR 2020<br />
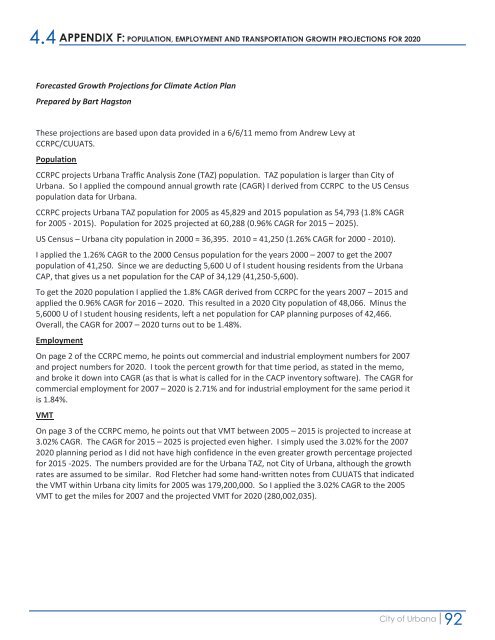
Forecasted Growth Projections for Climate Action Plan<br />
Prepared by Bart Hagston<br />
These projections are based upon data provided in a 6/6/11 memo from Andrew Levy at<br />
CCRPC/CUUATS.<br />
Population<br />
CCRPC projects <strong>Urbana</strong> Traffic Analysis Zone (TAZ) population. TAZ population is larger than <strong>City</strong> <strong>of</strong><br />
<strong>Urbana</strong>. So I applied the compound annual growth rate (CAGR) I derived from CCRPC to the US Census<br />
population data for <strong>Urbana</strong>.<br />
CCRPC projects <strong>Urbana</strong> TAZ population for 2005 as 45,829 and 2015 population as 54,793 (1.8% CAGR<br />
for 2005 - 2015). Population for 2025 projected at 60,288 (0.96% CAGR for 2015 – 2025).<br />
US Census – <strong>Urbana</strong> city population in 2000 = 36,395. 2010 = 41,250 (1.26% CAGR for 2000 - 2010).<br />
I applied the 1.26% CAGR to the 2000 Census population for the years 2000 – 2007 to get the 2007<br />
population <strong>of</strong> 41,250. Since we are deducting 5,600 U <strong>of</strong> I student housing residents from the <strong>Urbana</strong><br />
CAP, that gives us a net population for the CAP <strong>of</strong> 34,129 (41,250-5,600).<br />
To get the 2020 population I applied the 1.8% CAGR derived from CCRPC for the years 2007 – 2015 and<br />
applied the 0.96% CAGR for 2016 – 2020. This resulted in a 2020 <strong>City</strong> population <strong>of</strong> 48,066. Minus the<br />
5,6000 U <strong>of</strong> I student housing residents, left a net population for CAP planning purposes <strong>of</strong> 42,466.<br />
Overall, the CAGR for 2007 – 2020 turns out to be 1.48%.<br />
Employment<br />
On page 2 <strong>of</strong> the CCRPC memo, he points out commercial and industrial employment numbers for 2007<br />
and project numbers for 2020. I took the percent growth for that time period, as stated in the memo,<br />
and broke it down into CAGR (as that is what is called for in the CACP inventory s<strong>of</strong>tware). The CAGR for<br />
commercial employment for 2007 – 2020 is 2.71% and for industrial employment for the same period it<br />
is 1.84%.<br />
VMT<br />
On page 3 <strong>of</strong> the CCRPC memo, he points out that VMT between 2005 – 2015 is projected to increase at<br />
3.02% CAGR. The CAGR for 2015 – 2025 is projected even higher. I simply used the 3.02% for the 2007<br />
2020 planning period as I did not have high confidence in the even greater growth percentage projected<br />
for 2015 -2025. The numbers provided are for the <strong>Urbana</strong> TAZ, not <strong>City</strong> <strong>of</strong> <strong>Urbana</strong>, although the growth<br />
rates are assumed to be similar. Rod Fletcher had some hand-written notes from CUUATS that indicated<br />
the VMT within <strong>Urbana</strong> city limits for 2005 was 179,200,000. So I applied the 3.02% CAGR to the 2005<br />
VMT to get the miles for 2007 and the projected VMT for 2020 (280,002,035).<br />
<strong>City</strong> <strong>of</strong> <strong>Urbana</strong><br />
92