4.4 APPENDIX B: SOURCES AND WARMING POTENTIALS OF GREENHOUSE GASES Global Warming Potential (100 -year)* Emissions and Trends Main Sources <strong>of</strong> Emission Lifetime in Atmosphere Chemical Formula Green House Gas (i) Electricity: The combustion <strong>of</strong> fossil fuels to generate electricity is the largest single source <strong>of</strong> CO2 emissions in the nation, accounting for about 40% <strong>of</strong> total U.S. CO2 emissions and 33% <strong>of</strong> total U.S. greenhouse gas emissions in 2009. The type <strong>of</strong> fossil fuel used to generate electricity will emit different amounts <strong>of</strong> CO2. To produce a given amount <strong>of</strong> electricity, burning coal will produce more CO2 than oil or natural gas. (ii) Transportation: The combustion <strong>of</strong> fossil fuels. such as gasoline and diesel to transport people and goods is the second largest source <strong>of</strong> CO2 emissions, accounting for about 31% <strong>of</strong> total U.S. CO2 emissions and 26% <strong>of</strong> total U.S. greenhouse gas emissions in 2010. This category includes transportation sources such as highway vehicles, air travel, marine transportation, and rail. (iii) Industry: Many industrial processes emit CO2 through fossil fuel combustion. Several processes also produce CO2 emissions through chemical reactions that do not involve combustion, for example, the production and consumption <strong>of</strong> mineral products such as cement, the production <strong>of</strong> metals such as iron and steel, and the production <strong>of</strong> chemicals. Various industrial processes accounted for about 14% <strong>of</strong> total U.S. CO2 emissions and 20% <strong>of</strong> total U.S. greenhouse gas emissions in 2010. (CO2) is the primary greenhouse gas emitted through human activities. In 2010, CO2 accounted for about 84% <strong>of</strong> all U.S. greenhouse gas emissions from human activities. Carbon dioxide is naturally present in the atmosphere as part <strong>of</strong> the Earth's carbon cycle (the natural circulation <strong>of</strong> carbon among the atmosphere, oceans, soil, plants, and animals). Human activities are altering the carbon cycle--both by adding more CO2 to the atmosphere and by influencing the ability <strong>of</strong> natural sinks, like forests, to remove CO2 from the atmosphere. While CO2 emissions come from a variety <strong>of</strong> natural sources, human-related emissions are responsible for the increase that has occurred in the atmosphere since the industrial revolution. 50-200 years 1 Carbon Dioxide CO2 12 years 21 (i) Industry: Natural gas and petroleum systems are the largest source <strong>of</strong> CH4 emissions from industry in the United States. Methane is the primary component <strong>of</strong> natural gas. Some CH4 is emitted to the atmosphere during the production, processing, storage, transmission, and distribution <strong>of</strong> natural gas. Because gas is <strong>of</strong>ten found alongside petroleum, the production, refinement, transportation, and storage <strong>of</strong> crude oil is also a source <strong>of</strong> CH4 emissions. (ii) Agriculture: Domestic livestock such as cattle, buffalo, sheep, goats, and camels produce large amounts <strong>of</strong> CH4 as part <strong>of</strong> their normal digestive process. Also, when animals' manure is stored or managed in lagoons or holding tanks, CH4 is produced. Because humans raise these animals for food, the emissions are considered human-related. Globally, the Agriculture sector is the primary source <strong>of</strong> CH4 emissions. (iii) Waste from Homes and Businesses: Methane is generated in landfills as waste decomposes and in the treatment <strong>of</strong> wastewater. Landfills are the third largest source <strong>of</strong> CH4 emissions in the United States Methane (CH4) is the second most prevalent greenhouse gas emitted in the United States from human activities. In 2010, CH4 accounted for about 10% <strong>of</strong> all U.S. greenhouse gas emissions from human activities. Methane is emitted by natural sources such as wetlands, as well as human activities such as leakage from natural gas systems and the raising <strong>of</strong> livestock. Natural processes in soil and chemical reactions in the atmosphere help remove CH4 from the atmosphere. Methane's lifetime in the atmosphere is much shorter than carbon dioxide (CO2), but CH4 is more efficient at trapping radiation than CO2. Pound for pound, the comparative impact <strong>of</strong> CH4 on climate change is over 20 times greater than CO2 over a 100-year period. Methane CH4 (i) Agriculture: Nitrous oxide is emitted when people add nitrogen to the soil through the use <strong>of</strong> synthetic fertilizers. Agricultural soil management is the largest source <strong>of</strong> N2O emissions in the United States, accounting for about 68% <strong>of</strong> total U.S. N2O emissions in 2010. Nitrous oxide is also emitted during the breakdown <strong>of</strong> nitrogen in livestock manure and urine, which contributed to 6% <strong>of</strong> N2O emissions in 2010. (ii) Transportation: Nitrous oxide is emitted when transportation fuels are burned. Motor vehicles, including passenger cars and trucks, are the primary source <strong>of</strong> N2O emissions from transportation. The amount <strong>of</strong> N2O emitted from transportation depends on the type <strong>of</strong> fuel and vehicle technology, maintenance, and operating practices. (iii) Industry: Nitrous oxide is generated as a byproduct during the production <strong>of</strong> nitric acid, which is used to make synthetic commercial fertilizer, and in the production <strong>of</strong> adipic acid, which is used to make fibers, like nylon, and other synthetic products. In 2010, nitrous oxide (N2O) accounted for about 4% <strong>of</strong> all U.S. greenhouse gas emissions from human activities. Nitrous oxide is naturally present in the atmosphere as part <strong>of</strong> the Earth's nitrogen cycle, and has a variety <strong>of</strong> natural sources. However, human activities such as agriculture, fossil fuel combustion, wastewater management, and industrial processes are increasing the amount <strong>of</strong> N2O in the atmosphere. Nitrous oxide molecules stay in the atmosphere for an average <strong>of</strong> 120 years before being removed by a sink or destroyed through chemical reactions. The impact <strong>of</strong> 1 pound <strong>of</strong> N2O on warming the atmosphere is over 300 times that <strong>of</strong> 1 pound <strong>of</strong> carbon dioxide. 120 years 310 Nitrous Oxide N2O Fluorinated gases have no natural sources and only come from human-related activities. They are emitted through a variety <strong>of</strong> industrial processes such as aluminum and semiconductor manufacturing. Many fluorinated gases have very high global warming potentials (GWPs) relative to other greenhouse gases, so small atmospheric concentrations can have large effects on global temperatures. They can also have long atmospheric lifetimes--in some cases, lasting thousands <strong>of</strong> years. Like other longlived greenhouse gases, fluorinated gases are well-mixed in the atmosphere, spreading around the world after they're emitted. Fluorinated gases are removed from the atmosphere only when they are destroyed by sunlight in the far upper atmosphere. In general, fluorinated gases are the most potent and longest lasting type <strong>of</strong> greenhouse gases emitted by human activities. HFCs: 140-11,700 PFCs: 6,500-9,200 SF6: 23,900 HFCs: 1-270 years PFCs: 800-50,000 years SF6: 3,200 years (i) Substitution <strong>of</strong> Ozone Depleting substances: Hydr<strong>of</strong>luorocarbons are used as refrigerants, aerosol propellants, solvents, and fire retardants. The major emissions source <strong>of</strong> these compounds is their use as refrigerants--for example, in air conditioning systems in both vehicles and buildings. These chemicals were developed as a replacement for chlor<strong>of</strong>luorocarbons (CFCs) and hydrochlor<strong>of</strong>luorocarbons (HCFCs) because they do not deplete the stratospheric ozone layer. Chlor<strong>of</strong>luorocarbons and HCFCs are being phased out under an international agreement, called the Montreal Protocol. Unfortunately, HFCs are potent greenhouse gases with long atmospheric lifetimes and high GWPs, and they are released into the atmosphere through leaks, servicing, and disposal <strong>of</strong> equipment in which they are used. (ii) Industry: Perfluorocarbons are compounds produced as a by-product <strong>of</strong> various industrial processes associated with aluminum production and the manufacturing <strong>of</strong> semiconductors. Like HFCs, PFCs generally have long atmospheric lifetimes and high GWPs. Sulfur hexafluoride is used in magnesium processing and semiconductor manufacturing, as well as a tracer gas for leak detection. HFC-23 is produced as a by-product <strong>of</strong> HCFC-22 production. (iii) Transmission and Distribution <strong>of</strong> Electricity: Sulfur hexafluoride is used in electrical transmission equipment, including circuit breakers. The GWP <strong>of</strong> SF6 is 23,900, making it the most potent greenhouse gases that the Intergovernmental Panel on Climate Change has evaluated. HFCs, PFCs, SF6 F-gases Human activities such as transportation, agriculture, industry and waste decomposition have increased the ozone concentration through the release <strong>of</strong> gases such as carbon monoxide, hydrocarbons, and nitrogen oxides. 22 days Ozone is continuously produced and destroyed in the atmosphere by chemical reactions. In the troposphere, the lowest 5 to 10 miles <strong>of</strong> the atmosphere near the surface, human activities have increased the ozone concentration through the release <strong>of</strong> gases such as carbon monoxide, hydrocarbons, and nitrogen oxides. These gases undergo chemical reactions to produce ozone in the presence <strong>of</strong> sunlight. In addition to trapping heat, excess ozone in the troposphere causes respiratory illnesses and other human health problems. Ozone O3 Irrigation and combustion processes, surface warming caused by other human-produced greenhouse gases leads to an increase in atmposheric water vapor. Water vapor is the most important and abundant greenhouse gas in the atmosphere. Human activities produce only a very small increase in water vapor through irrigation and combustion processes. However, the surface warming caused by humanproduced increases in other greenhouse gases leads to an increase in atmospheric water vapor, since a warmer climate increases evaporation and allows the atmosphere to hold more moisture. This creates an amplifying "feedback loop," leading to more warming. Water Vapor * Depending on how well a gas absorbs energy and how long it stays in the atmosphere, certain greenhouse gases are more effective at warming the Earth than others. The Global Warming Potential (GWP) for a gas is a measure <strong>of</strong> the total energy that a gas absorbs over a particular period <strong>of</strong> time (usually 100 years) compared to carbon dioxide. SOURCES: 1. E.P.A, U. (2012, June 14). Greenhouse Gas Emissions. Retrieved July 28, 2012, from U.S. E.P.A Climate Change: http://epa.gov/climatechange/ghgemissions/ 2. Global Climate Change Impacts in the United States, Thomas R. Karl, Jerry M. Melillo, and Thomas C. Peterson, (eds.). Cambridge University Press, 2009 <strong>City</strong> <strong>of</strong> <strong>Urbana</strong> 74
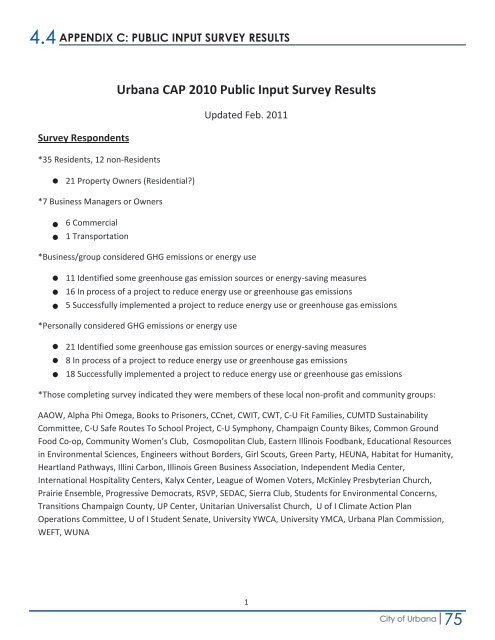
4.4 APPENDIX C: PUBLIC INPUT SURVEY RESULTS Survey Respondents *35 Residents, 12 non-Residents <strong>Urbana</strong> CAP 2010 Public Input Survey Results 21 Property Owners (Residential) *7 Business Managers or Owners 6 Commercial 1 Transportation Updated Feb. 2011 *Business/group considered GHG emissions or energy use 11 Identified some greenhouse gas emission sources or energy-saving measures 16 In process <strong>of</strong> a project to reduce energy use or greenhouse gas emissions 5 Successfully implemented a project to reduce energy use or greenhouse gas emissions *Personally considered GHG emissions or energy use 21 Identified some greenhouse gas emission sources or energy-saving measures 8 In process <strong>of</strong> a project to reduce energy use or greenhouse gas emissions 18 Successfully implemented a project to reduce energy use or greenhouse gas emissions *Those completing survey indicated they were members <strong>of</strong> these local non-pr<strong>of</strong>it and community groups: AAOW, Alpha Phi Omega, Books to Prisoners, CCnet, CWIT, CWT, C-U Fit Families, CUMTD Sustainability Committee, C-U Safe Routes To School Project, C-U Symphony, Champaign County Bikes, Common Ground Food Co-op, Community Women’s Club, Cosmopolitan Club, Eastern Illinois Foodbank, Educational Resources in Environmental Sciences, Engineers without Borders, Girl Scouts, Green Party, HEUNA, Habitat for Humanity, Heartland Pathways, Illini Carbon, Illinois Green Business Association, Independent Media Center, International Hospitality Centers, Kalyx Center, League <strong>of</strong> Women Voters, McKinley Presbyterian Church, Prairie Ensemble, Progressive Democrats, RSVP, SEDAC, Sierra Club, Students for Environmental Concerns, Transitions Champaign County, UP Center, Unitarian Universalist Church, U <strong>of</strong> I Climate Action Plan Operations Committee, U <strong>of</strong> I Student Senate, University YWCA, University YMCA, <strong>Urbana</strong> Plan Commission, WEFT, WUNA 1 <strong>City</strong> <strong>of</strong> <strong>Urbana</strong> 75
- Page 1 and 2:
CLIMATE ACTION PLAN PHASE 1: INITIA
- Page 3 and 4:
A MESSAGE FROM THE MAYOR August 31,
- Page 5 and 6:
5 GOALS : 15 ACTIONS THE URBANA CLI
- Page 7:
to reach long-term emissions reduct
- Page 10 and 11:
1.1 INTRODUCTION Never in the past
- Page 12 and 13:
1.2 CLIMATE CHANGE CONCEPTS A. GREE
- Page 14 and 15:
1.3 THE BENEFITS OF LOCAL ACTION Ur
- Page 16 and 17:
1.5 A PHASED APPROACH The phased st
- Page 18 and 19:
1.7 CITY OF URBANA CLIMATE PLANNING
- Page 20 and 21:
1.8 PUBLIC ENGAGEMENT In addition t
- Page 22 and 23:
1.9 CURRENT PLANS D. 2004 CHAMPAIGN
- Page 24 and 25: 1.10 CURRENT ACTIONS Urbana busines
- Page 26 and 27: 1.10 CURRENT ACTIONS has verified a
- Page 28 and 29: 1.10 CURRENT ACTIONS Urbana’s Her
- Page 30 and 31: 1.10 CURRENT ACTIONS successful, wi
- Page 32 and 33: 1.10 CURRENT ACTIONS D. CITY OF URB
- Page 35 and 36: 2. METHODOLOGY, INVENTORY, & PROJEC
- Page 37 and 38: 2.1 OVERVIEW B. UNIVERSITY OF ILLIN
- Page 39 and 40: 2.2 BASELINE INVENTORY A. 2007 EMIS
- Page 41 and 42: 2.2 BASELINE INVENTORY D. COMPARING
- Page 43 and 44: 110,100 43,000 152,000 32,300 114,5
- Page 45 and 46: 2.5 URBANA’S ENERGY USE C. AMEREN
- Page 47: 2.5 URBANA’S ENERGY USE RECs may
- Page 51 and 52: 3.1 PRIORITY ACTIONS Phase I of the
- Page 53 and 54: 3.1 80% 90% EMISSIONS REDUCTION TAR
- Page 55 and 56: 3.2 GOAL 1: REDUCE EMISSIONS FROM B
- Page 57 and 58: 3.2 GOAL 1: REDUCE EMISSIONS FROM B
- Page 59 and 60: 3.2 GOAL 2: REDUCE EMISSIONS FROM G
- Page 61 and 62: 3.2 GOAL 4: PREPARE FOR CLIMATE CHA
- Page 63 and 64: 3.2 GOAL 5: PURSUE COORDINATION AND
- Page 65 and 66: 3.3 CONSOLIDATED IMPLEMENTATION TAB
- Page 67: 3.4 FUTURE STEPS AND CHALLENGES TO
- Page 70 and 71: 4.1 TABLE OF FIGURES FIGURE 1. FIGU
- Page 72 and 73: 4.3 ACRONYMS AND ABBREVIATIONS ACS
- Page 76 and 77: 4.4 APPENDIX C: PUBLIC INPUT SURVEY
- Page 78 and 79: 4.4 APPENDIX C: PUBLIC INPUT SURVEY
- Page 80 and 81: 4.4 APPENDIX C: PUBLIC INPUT SURVEY
- Page 82 and 83: 4.4 APPENDIX D: PUBLIC INPUT FORMS
- Page 84 and 85: 4.4 APPENDIX D: PUBLIC INPUT FORMS
- Page 86 and 87: 4.4 APPENDIX E: CACP GREENHOUSE GAS
- Page 88 and 89: 4.4 APPENDIX E: CACP GREENHOUSE GAS
- Page 90 and 91: 4.4 APPENDIX F: POPULATION, EMPLOYM
- Page 92 and 93: 4.4 APPENDIX F: POPULATION, EMPLOYM
- Page 94 and 95: 4.4 APPENDIX G: STATE OF ILLINOIS E
- Page 96 and 97: 4.4 APPENDIX H: $ 1,000 ENERGY CHAL
- Page 98 and 99: 4.4 APPENDIX J: ENERGY AND EMISSION
- Page 100 and 101: 4.4 APPENDIX J: ENERGY AND EMISSION
- Page 102: www.urbanaillinois.us/climateaction