CLIMATE ACTION PLAN - City of Urbana
CLIMATE ACTION PLAN - City of Urbana
CLIMATE ACTION PLAN - City of Urbana
- No tags were found...

Create successful ePaper yourself
Turn your PDF publications into a flip-book with our unique Google optimized e-Paper software.
2.2 BASELINE INVENTORY<br />
D. COMPARING URBANA’S PER CAPITA COMMERCIAL AND RESIDENTIAL BUILDING AND TRANSPORTATION<br />
SECTOR EMISSIONS WITH CITIES NATION-WIDE<br />
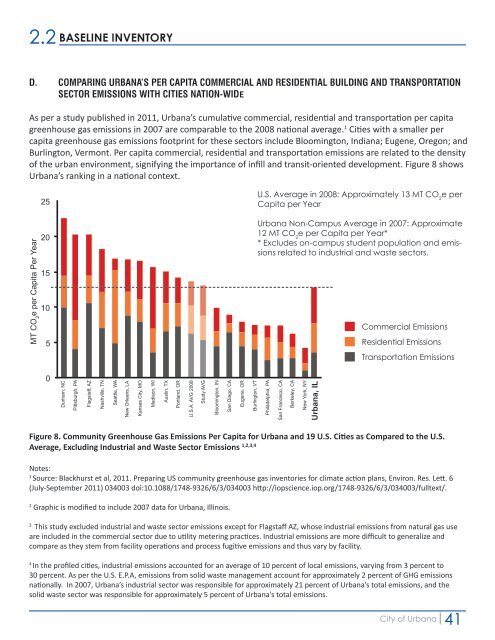
As per a study published in 2011, <strong>Urbana</strong>’s cumulative commercial, residential and transportation per capita<br />
greenhouse gas emissions in 2007 are comparable to the 2008 national average. 1 Cities with a smaller per<br />
capita greenhouse gas emissions footprint for these sectors include Bloomington, Indiana; Eugene, Oregon; and<br />
Burlington, Vermont. Per capita commercial, residential and transportation emissions are related to the density<br />
<strong>of</strong> the urban environment, signifying the importance <strong>of</strong> infill and transit-oriented development. Figure 8 shows<br />
<strong>Urbana</strong>’s ranking in a national context.<br />
MT CO 2<br />
e per Capita Per Year<br />
25<br />
20<br />
15<br />
10<br />
5<br />
U.S. Average in 2008: Approximately 13 MT CO 2<br />
e per<br />
Capita per Year<br />
<strong>Urbana</strong> Non-Campus Average in 2007: Approximate<br />
12 MT CO 2<br />
e per Capita per Year*<br />
* Excludes on-campus student population and emissions<br />
related to industrial and waste sectors.<br />
Commercial Emissions<br />
Residential Emissions<br />
Transportation Emissions<br />
0<br />
Durham, NC<br />
Pittsburgh, PA<br />
Flagstaff, AZ<br />
Nashville, TN<br />
Seattle, WA<br />
New Orleans, LA<br />
Kansas <strong>City</strong>, MO<br />
Madison, WI<br />
Austin, TX<br />
Portland, OR<br />
U.S.A. AVG 2008<br />
Study AVG<br />
Bloomington, IN<br />
San Diego, CA<br />
Eugene, OR<br />
Burlington, VT<br />
Philadelphia, PA<br />
San Francisco, CA<br />
Berkeley, CA<br />
New York, NY<br />
<strong>Urbana</strong>, IL<br />
Figure 8. Community Greenhouse Gas Emissions Per Capita for <strong>Urbana</strong> and 19 U.S. Cities as Compared to the U.S.<br />
Average, Excluding Industrial and Waste Sector Emissions 1,2,3,4<br />
Notes:<br />
1<br />
Source: Blackhurst et al, 2011. Preparing US community greenhouse gas inventories for climate action plans, Environ. Res. Lett. 6<br />
(July-September 2011) 034003 doi:10.1088/1748-9326/6/3/034003 http://iopscience.iop.org/1748-9326/6/3/034003/fulltext/.<br />
2<br />
Graphic is modified to include 2007 data for <strong>Urbana</strong>, Illinois.<br />
3<br />
This study excluded industrial and waste sector emissions except for Flagstaff AZ, whose industrial emissions from natural gas use<br />
are included in the commercial sector due to utility metering practices. Industrial emissions are more difficult to generalize and<br />
compare as they stem from facility operations and process fugitive emissions and thus vary by facility.<br />
4<br />
In the pr<strong>of</strong>iled cities, industrial emissions accounted for an average <strong>of</strong> 10 percent <strong>of</strong> local emissions, varying from 3 percent to<br />
30 percent. As per the U.S. E.P.A, emissions from solid waste management account for approximately 2 percent <strong>of</strong> GHG emissions<br />
nationally. In 2007, <strong>Urbana</strong>’s industrial sector was responsible for approximately 21 percent <strong>of</strong> <strong>Urbana</strong>’s total emissions, and the<br />
solid waste sector was responsible for approximately 5 percent <strong>of</strong> <strong>Urbana</strong>’s total emissions.<br />
<strong>City</strong> <strong>of</strong> <strong>Urbana</strong><br />
41