CLIMATE ACTION PLAN - City of Urbana
CLIMATE ACTION PLAN - City of Urbana
CLIMATE ACTION PLAN - City of Urbana
- No tags were found...

You also want an ePaper? Increase the reach of your titles
YUMPU automatically turns print PDFs into web optimized ePapers that Google loves.
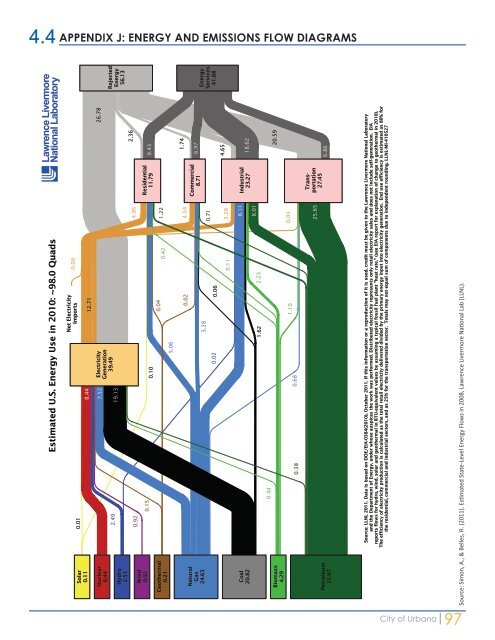
4.4 APPENDIX J: ENERGY AND EMISSIONS FLOW DIAGRAMS<br />
Estimated U.S. Energy Use in 2010: ~98.0 Quads<br />
Lawrence Livermore<br />
National Laboratory<br />
Solar<br />
0.11<br />
0.01<br />
8.44<br />
Net Electricity<br />
Imports<br />
12.71<br />
0.09<br />
Nuclear<br />
8.44<br />
Hydro<br />
2.51<br />
Wind<br />
0.92<br />
Geothermal<br />
0.21<br />
2.49<br />
0.92<br />
0.15<br />
7.52<br />
19.13<br />
Electricity<br />
Generation<br />
39.49<br />
0.10<br />
5.06<br />
0.04<br />
0.42<br />
4.95<br />
1.22<br />
Residential<br />
11.79<br />
9.43<br />
2.36<br />
26.78<br />
Rejected<br />
Energy<br />
56.13<br />
Natural<br />
Gas<br />
24.65<br />
0.02<br />
3.28<br />
0.02<br />
0.06<br />
0.11<br />
4.54<br />
0.71<br />
3.28<br />
Commercial<br />
8.71<br />
4.65<br />
1.74<br />
6.97<br />
Energy<br />
Services<br />
41.88<br />
Coal<br />
20.82<br />
1.62<br />
2.23<br />
8.11<br />
8.01<br />
Industrial<br />
23.27<br />
18.62<br />
Biomass<br />
4.29<br />
0.44<br />
0.38<br />
0.68<br />
1.10<br />
0.03<br />
20.59<br />
Petroleum<br />
35.97<br />
25.65<br />
Transportation<br />
27.45<br />
6.86<br />
Source: LLNL 2011. Data is based on DOE/EIA-0384(2010), October 2011. If this information or a reproduction <strong>of</strong> it is used, credit must be given to the Lawrence Livermore National Laboratory<br />
and the Department <strong>of</strong> Energy, under whose auspices the work was performed. Distributed electricity represents only retail electricity sales and does not include self-generation. EIA<br />
reports flows for hydro, wind, solar and geothermal in BTU-equivalent values by assuming a typical fossil fuel plant "heat rate." (see EIA report for explanation <strong>of</strong> change to geothermal in 2010).<br />
The efficiency <strong>of</strong> electricity production is calculated as the total retail electricity delivered divided by the primary energy input into electricity generation. End use efficiency is estimated as 80% for<br />
the residential, commercial and industrial sectors, and as 25% for the transportation sector. Totals may not equal sum <strong>of</strong> components due to independent rounding. LLNL-MI-410527<br />
Source: Simon, A., & Belles, R. (2011). Estimated State-Level Energy Flows in 2008, Lawrence Livermore National Lab (LLNL).<br />
<strong>City</strong> <strong>of</strong> <strong>Urbana</strong><br />
97