CLIMATE ACTION PLAN - City of Urbana
CLIMATE ACTION PLAN - City of Urbana
CLIMATE ACTION PLAN - City of Urbana
- No tags were found...

You also want an ePaper? Increase the reach of your titles
YUMPU automatically turns print PDFs into web optimized ePapers that Google loves.
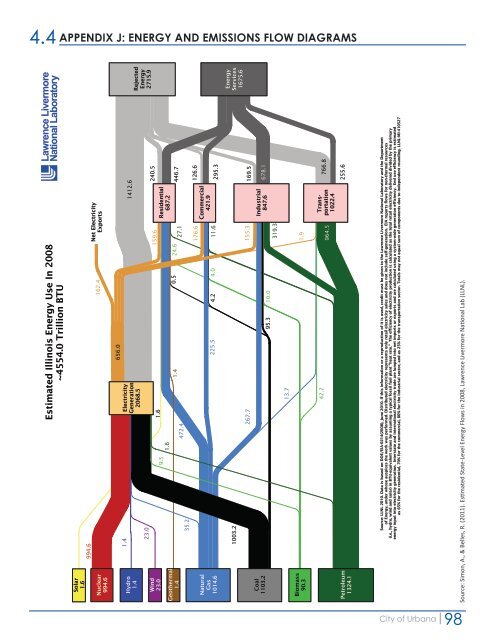
4.4 APPENDIX J: ENERGY AND EMISSIONS FLOW DIAGRAMS<br />
Estimated Illinois Energy Use In 2008<br />
~4554.0 Trillion BTU<br />
Lawrence Livermore<br />
National Laboratory<br />
Solar<br />
1.6<br />
Nuclear<br />
994.6<br />
994.6<br />
162.4<br />
Net Electricity<br />
Exports<br />
Hydro<br />
1.4<br />
Wind<br />
23.0<br />
Geothermal<br />
1.4<br />
Natural<br />
Gas<br />
1014.6<br />
1.4<br />
23.0<br />
35.2<br />
9.5<br />
1.6<br />
472.4<br />
1.6<br />
Electricity<br />
Generation<br />
2068.5<br />
1.4<br />
656.0<br />
225.5<br />
4.2<br />
0.5<br />
4.0<br />
24.6<br />
159.6<br />
27.1<br />
176.6<br />
11.6<br />
1412.6<br />
Residential<br />
687.2<br />
Commercial<br />
421.9<br />
240.5<br />
446.7<br />
126.6<br />
295.3<br />
Rejected<br />
Energy<br />
2715.9<br />
Coal<br />
1103.2<br />
1003.2<br />
267.7<br />
95.3<br />
10.0<br />
155.3<br />
319.3<br />
Industrial<br />
847.6<br />
169.5<br />
678.1<br />
Energy<br />
Services<br />
1675.6<br />
13.7<br />
Biomass<br />
90.3<br />
1.9<br />
42.2<br />
964.5<br />
Transportation<br />
1022.4<br />
766.8<br />
Petroleum<br />
1324.1<br />
255.6<br />
Source: LLNL 2010. Data is based on DOE/EIA-0214(2008), June 2010. If this information or a reproduction <strong>of</strong> it is used, credit must be given to the Lawrence Livermore National Laboratory and the Department<br />
<strong>of</strong> Energy, under whose auspices the work was performed. Distributed electricity represents only retail electricity sales and does not include self-generation. EIA reports flows for non-thermal resources<br />
(i.e., hydro, wind and solar) in BTU-equivalent values by assuming a typical fossil fuel plant "heat rate." The efficiency <strong>of</strong> electricity production is calculated as the total retail electricity delivered divided by the primary<br />
energy input into electricity generation. Interstate and international electricity trade are lumped into net imports or exports and are calculated using a system-wide generation efficiency. End use efficiency is estimated<br />
as 65% for the residential, 70% for the commercial, 80% for the industrial sector, and as 25% for the transportation sector. Totals may not equal sum <strong>of</strong> components due to independent rounding. LLNL-MI-410527<br />
Source: Simon, A., & Belles, R. (2011). Estimated State-Level Energy Flows in 2008, Lawrence Livermore National Lab (LLNL).<br />
<strong>City</strong> <strong>of</strong> <strong>Urbana</strong><br />
98