CLIMATE ACTION PLAN - City of Urbana
CLIMATE ACTION PLAN - City of Urbana
CLIMATE ACTION PLAN - City of Urbana
- No tags were found...

You also want an ePaper? Increase the reach of your titles
YUMPU automatically turns print PDFs into web optimized ePapers that Google loves.
2.2<br />
BASELINE INVENTORY<br />
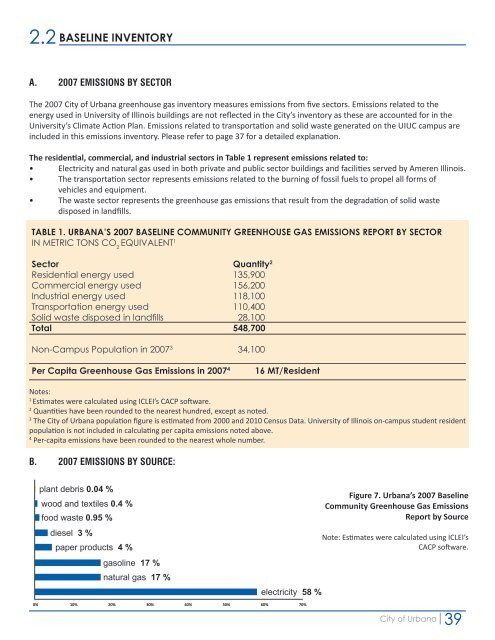
A. 2007 EMISSIONS BY SECTOR<br />
The 2007 <strong>City</strong> <strong>of</strong> <strong>Urbana</strong> greenhouse gas inventory measures emissions from five sectors. Emissions related to the<br />
energy used in University <strong>of</strong> Illinois buildings are not reflected in the <strong>City</strong>’s inventory as these are accounted for in the<br />
University’s Climate Action Plan. Emissions related to transportation and solid waste generated on the UIUC campus are<br />
included in this emissions inventory. Please refer to page 37 for a detailed explanation.<br />
The residential, commercial, and industrial sectors in Table 1 represent emissions related to:<br />
• Electricity and natural gas used in both private and public sector buildings and facilities served by Ameren Illinois.<br />
• The transportation sector represents emissions related to the burning <strong>of</strong> fossil fuels to propel all forms <strong>of</strong><br />
vehicles and equipment.<br />
• The waste sector represents the greenhouse gas emissions that result from the degradation <strong>of</strong> solid waste<br />
disposed in landfills.<br />
TABLE 1. URBANA’S 2007 BASELINE COMMUNITY GREENHOUSE GAS EMISSIONS REPORT BY SECTOR<br />
IN METRIC TONS CO 2<br />
EQUIVALENT 1<br />
Sector Quantity 2<br />
Residential energy used 135,900<br />
Commercial energy used 156,200<br />
Industrial energy used 118,100<br />
Transportation energy used 110,400<br />
Solid waste disposed in landfills 28,100<br />
Total 548,700<br />
Non-Campus Population in 2007 3 34,100<br />
Per Capita Greenhouse Gas Emissions in 2007 4<br />
16 MT/Resident<br />
Notes:<br />
1<br />
Estimates were calculated using ICLEI’s CACP s<strong>of</strong>tware.<br />
2<br />
Quantities have been rounded to the nearest hundred, except as noted.<br />
3<br />
The <strong>City</strong> <strong>of</strong> <strong>Urbana</strong> population figure is estimated from 2000 and 2010 Census Data. University <strong>of</strong> Illinois on-campus student resident<br />
population is not included in calculating per capita emissions noted above.<br />
4<br />
Per-capita emissions have been rounded to the nearest whole number.<br />
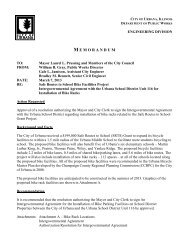
B. 2007 EMISSIONS BY SOURCE:<br />
Plant Debris<br />
and Textiles<br />
Food Waste<br />
Diesel<br />
per Products<br />
Gasoline<br />
Natural Gas<br />
Electricity<br />
plant debris 0.04 %<br />
wood and textiles 0.4 %<br />
food waste 0.95 %<br />
diesel 3 %<br />
paper products 4 %<br />
gasoline 17 %<br />
natural gas 17 %<br />
electricity 58 %<br />
Figure 7. <strong>Urbana</strong>’s 2007 Baseline<br />
Community Greenhouse Gas Emissions<br />
Report by Source<br />
Note: Estimates were calculated using ICLEI’s<br />
CACP s<strong>of</strong>tware.<br />
0% 10% 20% 30% 40% 50% 60% 70%<br />
Series1<br />
<strong>City</strong> <strong>of</strong> <strong>Urbana</strong><br />
39