CLIMATE ACTION PLAN - City of Urbana
CLIMATE ACTION PLAN - City of Urbana
CLIMATE ACTION PLAN - City of Urbana
- No tags were found...

You also want an ePaper? Increase the reach of your titles
YUMPU automatically turns print PDFs into web optimized ePapers that Google loves.
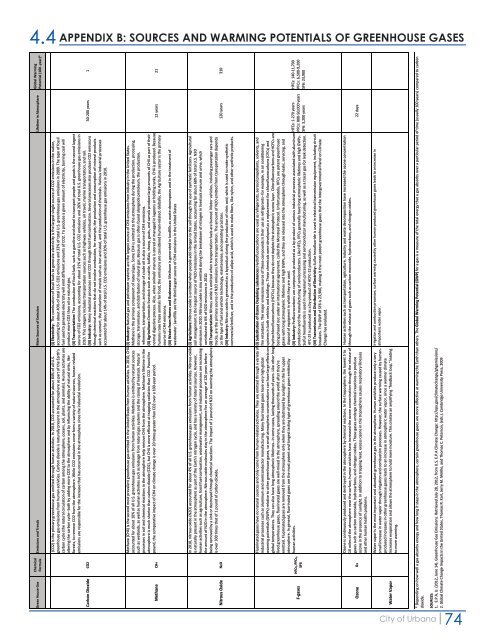
4.4 APPENDIX B: SOURCES AND WARMING POTENTIALS OF GREENHOUSE GASES<br />
Global Warming<br />
Potential (100 -year)*<br />
Emissions and Trends Main Sources <strong>of</strong> Emission Lifetime in Atmosphere<br />
Chemical<br />
Formula<br />
Green House Gas<br />
(i) Electricity: The combustion <strong>of</strong> fossil fuels to generate electricity is the largest single source <strong>of</strong> CO2 emissions in the nation,<br />
accounting for about 40% <strong>of</strong> total U.S. CO2 emissions and 33% <strong>of</strong> total U.S. greenhouse gas emissions in 2009. The type <strong>of</strong> fossil<br />
fuel used to generate electricity will emit different amounts <strong>of</strong> CO2. To produce a given amount <strong>of</strong> electricity, burning coal will<br />
produce more CO2 than oil or natural gas.<br />
(ii) Transportation: The combustion <strong>of</strong> fossil fuels. such as gasoline and diesel to transport people and goods is the second largest<br />
source <strong>of</strong> CO2 emissions, accounting for about 31% <strong>of</strong> total U.S. CO2 emissions and 26% <strong>of</strong> total U.S. greenhouse gas emissions in<br />
2010. This category includes transportation sources such as highway vehicles, air travel, marine transportation, and rail.<br />
(iii) Industry: Many industrial processes emit CO2 through fossil fuel combustion. Several processes also produce CO2 emissions<br />
through chemical reactions that do not involve combustion, for example, the production and consumption <strong>of</strong> mineral products<br />
such as cement, the production <strong>of</strong> metals such as iron and steel, and the production <strong>of</strong> chemicals. Various industrial processes<br />
accounted for about 14% <strong>of</strong> total U.S. CO2 emissions and 20% <strong>of</strong> total U.S. greenhouse gas emissions in 2010.<br />
(CO2) is the primary greenhouse gas emitted through human activities. In 2010, CO2 accounted for about 84% <strong>of</strong> all U.S.<br />
greenhouse gas emissions from human activities. Carbon dioxide is naturally present in the atmosphere as part <strong>of</strong> the Earth's<br />
carbon cycle (the natural circulation <strong>of</strong> carbon among the atmosphere, oceans, soil, plants, and animals). Human activities are<br />
altering the carbon cycle--both by adding more CO2 to the atmosphere and by influencing the ability <strong>of</strong> natural sinks, like<br />
forests, to remove CO2 from the atmosphere. While CO2 emissions come from a variety <strong>of</strong> natural sources, human-related<br />
emissions are responsible for the increase that has occurred in the atmosphere since the industrial revolution.<br />
50-200 years 1<br />
Carbon Dioxide CO2<br />
12 years 21<br />
(i) Industry: Natural gas and petroleum systems are the largest source <strong>of</strong> CH4 emissions from industry in the United States.<br />
Methane is the primary component <strong>of</strong> natural gas. Some CH4 is emitted to the atmosphere during the production, processing,<br />
storage, transmission, and distribution <strong>of</strong> natural gas. Because gas is <strong>of</strong>ten found alongside petroleum, the production,<br />
refinement, transportation, and storage <strong>of</strong> crude oil is also a source <strong>of</strong> CH4 emissions.<br />
(ii) Agriculture: Domestic livestock such as cattle, buffalo, sheep, goats, and camels produce large amounts <strong>of</strong> CH4 as part <strong>of</strong> their<br />
normal digestive process. Also, when animals' manure is stored or managed in lagoons or holding tanks, CH4 is produced. Because<br />
humans raise these animals for food, the emissions are considered human-related. Globally, the Agriculture sector is the primary<br />
source <strong>of</strong> CH4 emissions.<br />
(iii) Waste from Homes and Businesses: Methane is generated in landfills as waste decomposes and in the treatment <strong>of</strong><br />
wastewater. Landfills are the third largest source <strong>of</strong> CH4 emissions in the United States<br />
Methane (CH4) is the second most prevalent greenhouse gas emitted in the United States from human activities. In 2010, CH4<br />
accounted for about 10% <strong>of</strong> all U.S. greenhouse gas emissions from human activities. Methane is emitted by natural sources<br />
such as wetlands, as well as human activities such as leakage from natural gas systems and the raising <strong>of</strong> livestock. Natural<br />
processes in soil and chemical reactions in the atmosphere help remove CH4 from the atmosphere. Methane's lifetime in the<br />
atmosphere is much shorter than carbon dioxide (CO2), but CH4 is more efficient at trapping radiation than CO2. Pound for<br />
pound, the comparative impact <strong>of</strong> CH4 on climate change is over 20 times greater than CO2 over a 100-year period.<br />
Methane CH4<br />
(i) Agriculture: Nitrous oxide is emitted when people add nitrogen to the soil through the use <strong>of</strong> synthetic fertilizers. Agricultural<br />
soil management is the largest source <strong>of</strong> N2O emissions in the United States, accounting for about 68% <strong>of</strong> total U.S. N2O<br />
emissions in 2010. Nitrous oxide is also emitted during the breakdown <strong>of</strong> nitrogen in livestock manure and urine, which<br />
contributed to 6% <strong>of</strong> N2O emissions in 2010.<br />
(ii) Transportation: Nitrous oxide is emitted when transportation fuels are burned. Motor vehicles, including passenger cars and<br />
trucks, are the primary source <strong>of</strong> N2O emissions from transportation. The amount <strong>of</strong> N2O emitted from transportation depends<br />
on the type <strong>of</strong> fuel and vehicle technology, maintenance, and operating practices.<br />
(iii) Industry: Nitrous oxide is generated as a byproduct during the production <strong>of</strong> nitric acid, which is used to make synthetic<br />
commercial fertilizer, and in the production <strong>of</strong> adipic acid, which is used to make fibers, like nylon, and other synthetic products.<br />
In 2010, nitrous oxide (N2O) accounted for about 4% <strong>of</strong> all U.S. greenhouse gas emissions from human activities. Nitrous oxide<br />
is naturally present in the atmosphere as part <strong>of</strong> the Earth's nitrogen cycle, and has a variety <strong>of</strong> natural sources. However,<br />
human activities such as agriculture, fossil fuel combustion, wastewater management, and industrial processes are increasing<br />
the amount <strong>of</strong> N2O in the atmosphere. Nitrous oxide molecules stay in the atmosphere for an average <strong>of</strong> 120 years before<br />
being removed by a sink or destroyed through chemical reactions. The impact <strong>of</strong> 1 pound <strong>of</strong> N2O on warming the atmosphere<br />
is over 300 times that <strong>of</strong> 1 pound <strong>of</strong> carbon dioxide.<br />
120 years 310<br />
Nitrous Oxide N2O<br />
Fluorinated gases have no natural sources and only come from human-related activities. They are emitted through a variety <strong>of</strong><br />
industrial processes such as aluminum and semiconductor manufacturing. Many fluorinated gases have very high global<br />
warming potentials (GWPs) relative to other greenhouse gases, so small atmospheric concentrations can have large effects on<br />
global temperatures. They can also have long atmospheric lifetimes--in some cases, lasting thousands <strong>of</strong> years. Like other longlived<br />
greenhouse gases, fluorinated gases are well-mixed in the atmosphere, spreading around the world after they're<br />
emitted. Fluorinated gases are removed from the atmosphere only when they are destroyed by sunlight in the far upper<br />
atmosphere. In general, fluorinated gases are the most potent and longest lasting type <strong>of</strong> greenhouse gases emitted by<br />
human activities.<br />
HFCs: 140-11,700<br />
PFCs: 6,500-9,200<br />
SF6: 23,900<br />
HFCs: 1-270 years<br />
PFCs: 800-50,000 years<br />
SF6: 3,200 years<br />
(i) Substitution <strong>of</strong> Ozone Depleting substances: Hydr<strong>of</strong>luorocarbons are used as refrigerants, aerosol propellants, solvents, and<br />
fire retardants. The major emissions source <strong>of</strong> these compounds is their use as refrigerants--for example, in air conditioning<br />
systems in both vehicles and buildings. These chemicals were developed as a replacement for chlor<strong>of</strong>luorocarbons (CFCs) and<br />
hydrochlor<strong>of</strong>luorocarbons (HCFCs) because they do not deplete the stratospheric ozone layer. Chlor<strong>of</strong>luorocarbons and HCFCs are<br />
being phased out under an international agreement, called the Montreal Protocol. Unfortunately, HFCs are potent greenhouse<br />
gases with long atmospheric lifetimes and high GWPs, and they are released into the atmosphere through leaks, servicing, and<br />
disposal <strong>of</strong> equipment in which they are used.<br />
(ii) Industry: Perfluorocarbons are compounds produced as a by-product <strong>of</strong> various industrial processes associated with aluminum<br />
production and the manufacturing <strong>of</strong> semiconductors. Like HFCs, PFCs generally have long atmospheric lifetimes and high GWPs.<br />
Sulfur hexafluoride is used in magnesium processing and semiconductor manufacturing, as well as a tracer gas for leak detection.<br />
HFC-23 is produced as a by-product <strong>of</strong> HCFC-22 production.<br />
(iii) Transmission and Distribution <strong>of</strong> Electricity: Sulfur hexafluoride is used in electrical transmission equipment, including circuit<br />
breakers. The GWP <strong>of</strong> SF6 is 23,900, making it the most potent greenhouse gases that the Intergovernmental Panel on Climate<br />
Change has evaluated.<br />
HFCs, PFCs,<br />
SF6<br />
F-gases<br />
Human activities such as transportation, agriculture, industry and waste decomposition have increased the ozone concentration<br />
through the release <strong>of</strong> gases such as carbon monoxide, hydrocarbons, and nitrogen oxides.<br />
22 days<br />
Ozone is continuously produced and destroyed in the atmosphere by chemical reactions. In the troposphere, the lowest 5 to<br />
10 miles <strong>of</strong> the atmosphere near the surface, human activities have increased the ozone concentration through the release <strong>of</strong><br />
gases such as carbon monoxide, hydrocarbons, and nitrogen oxides. These gases undergo chemical reactions to produce<br />
ozone in the presence <strong>of</strong> sunlight. In addition to trapping heat, excess ozone in the troposphere causes respiratory illnesses<br />
and other human health problems.<br />
Ozone O3<br />
Irrigation and combustion processes, surface warming caused by other human-produced greenhouse gases leads to an increase in<br />
atmposheric water vapor.<br />
Water vapor is the most important and abundant greenhouse gas in the atmosphere. Human activities produce only a very<br />
small increase in water vapor through irrigation and combustion processes. However, the surface warming caused by humanproduced<br />
increases in other greenhouse gases leads to an increase in atmospheric water vapor, since a warmer climate<br />
increases evaporation and allows the atmosphere to hold more moisture. This creates an amplifying "feedback loop," leading<br />
to more warming.<br />
Water Vapor<br />
* Depending on how well a gas absorbs energy and how long it stays in the atmosphere, certain greenhouse gases are more effective at warming the Earth than others. The Global Warming Potential (GWP) for a gas is a measure <strong>of</strong> the total energy that a gas absorbs over a particular period <strong>of</strong> time (usually 100 years) compared to carbon<br />
dioxide.<br />
SOURCES:<br />
1. E.P.A, U. (2012, June 14). Greenhouse Gas Emissions. Retrieved July 28, 2012, from U.S. E.P.A Climate Change: http://epa.gov/climatechange/ghgemissions/<br />
2. Global Climate Change Impacts in the United States, Thomas R. Karl, Jerry M. Melillo, and Thomas C. Peterson, (eds.). Cambridge University Press, 2009<br />
<strong>City</strong> <strong>of</strong> <strong>Urbana</strong><br />
74