CLIMATE ACTION PLAN - City of Urbana
CLIMATE ACTION PLAN - City of Urbana
CLIMATE ACTION PLAN - City of Urbana
- No tags were found...

You also want an ePaper? Increase the reach of your titles
YUMPU automatically turns print PDFs into web optimized ePapers that Google loves.
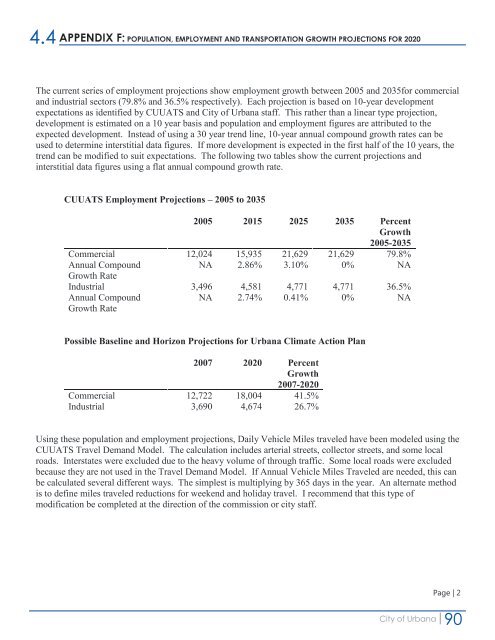
4.4 APPENDIX F: POPULATION, EMPLOYMENT AND TRANSPORTATION GROWTH PROJECTIONS FOR 2020<br />
The current series <strong>of</strong> employment projections show employment growth between 2005 and 2035for commercial<br />
and industrial sectors (79.8% and 36.5% respectively). Each projection is based on 10-year development<br />
expectations as identified by CUUATS and <strong>City</strong> <strong>of</strong> <strong>Urbana</strong> staff. This rather than a linear type projection,<br />
development is estimated on a 10 year basis and population and employment figures are attributed to the<br />
expected development. Instead <strong>of</strong> using a 30 year trend line, 10-year annual compound growth rates can be<br />
used to determine interstitial data figures. If more development is expected in the first half <strong>of</strong> the 10 years, the<br />
trend can be modified to suit expectations. The following two tables show the current projections and<br />
interstitial data figures using a flat annual compound growth rate.<br />
CUUATS Employment Projections – 2005 to 2035<br />
2005 2015 2025 2035 Percent<br />
Growth<br />
2005-2035<br />
Commercial 12,024 15,935 21,629 21,629 79.8%<br />
Annual Compound<br />
NA 2.86% 3.10% 0% NA<br />
Growth Rate<br />
Industrial 3,496 4,581 4,771 4,771 36.5%<br />
Annual Compound<br />
Growth Rate<br />
NA 2.74% 0.41% 0% NA<br />
Possible Baseline and Horizon Projections for <strong>Urbana</strong> Climate Action Plan<br />
2007 2020 Percent<br />
Growth<br />
2007-2020<br />
Commercial 12,722 18,004 41.5%<br />
Industrial 3,690 4,674 26.7%<br />
Using these population and employment projections, Daily Vehicle Miles traveled have been modeled using the<br />
CUUATS Travel Demand Model. The calculation includes arterial streets, collector streets, and some local<br />
roads. Interstates were excluded due to the heavy volume <strong>of</strong> through traffic. Some local roads were excluded<br />
because they are not used in the Travel Demand Model. If Annual Vehicle Miles Traveled are needed, this can<br />
be calculated several different ways. The simplest is multiplying by 365 days in the year. An alternate method<br />
is to define miles traveled reductions for weekend and holiday travel. I recommend that this type <strong>of</strong><br />
modification be completed at the direction <strong>of</strong> the commission or city staff.<br />
Page | 2<br />
<strong>City</strong> <strong>of</strong> <strong>Urbana</strong><br />
90