CLIMATE ACTION PLAN - City of Urbana
CLIMATE ACTION PLAN - City of Urbana
CLIMATE ACTION PLAN - City of Urbana
- No tags were found...

Create successful ePaper yourself
Turn your PDF publications into a flip-book with our unique Google optimized e-Paper software.
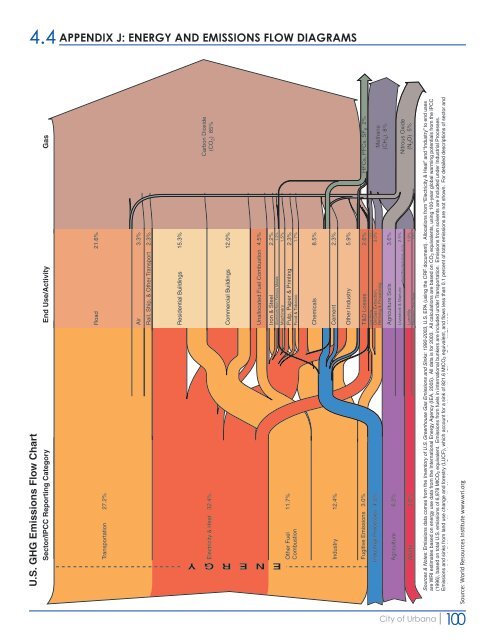
4.4 APPENDIX J: ENERGY AND EMISSIONS FLOW DIAGRAMS<br />
U.S. GHG Emissions Flow Chart<br />
Sector/IPCC Reporting Category End Use/Activity Gas<br />
Transportation 27.2%<br />
Road<br />
21.6%<br />
Air<br />
3.3%<br />
Rail, Ship, & Other Transport<br />
2.3%<br />
Residential Buildings<br />
15.3%<br />
Electricity & Heat 32.4%<br />
E N E R G Y<br />
Other Fuel<br />
Combustion<br />
11.7%<br />
Commercial Buildings<br />
Unallocated Fuel Combustion<br />
Iron & Steel<br />
Aluminum/Non-Ferrous Metals<br />
Machinery<br />
Pulp, Paper & Printing<br />
Food & Tobacco<br />
12.0%<br />
4.5%<br />
2.2%<br />
1.2%<br />
1.5%<br />
2.3%<br />
1.7%<br />
Carbon Dioxide<br />
(CO 2 ) 85%<br />
Chemicals<br />
8.5%<br />
Industry<br />
12.4%<br />
Cement<br />
2.3%<br />
Other Industry<br />
5.9%<br />
Fugitive Emissions 3.0%<br />
Industrial Processes 4.5%<br />
Agriculture<br />
Waste<br />
6.2%<br />
2.6%<br />
T&D Losses 2.6%<br />
Coal Mining 1.0%<br />
Oil/Gas Extraction,<br />
3.0%<br />
Refining & Processing<br />
Agriculture Soils<br />
Livestock & Manure<br />
Landfills<br />
Wastewater, Other Waste<br />
Rice/Other Agriculture 0.1%<br />
3.6%<br />
2.5%<br />
1.9%<br />
0.8%<br />
HFCs, PFCs, SF 6 2%<br />
Methane<br />
(CH 4 ) 8%<br />
Nitrous Oxide<br />
(N 2 O) 5%<br />
Sources & Notes: Emissions data comes from the Inventory <strong>of</strong> U.S. Greenhouse Gas Emissions and Sinks: 1990-2003, U.S. EPA (using the CRF document). Allocations from “Electricity & Heat” and “Industry” to end uses<br />
are WRI estimates based on energy use data from the International Energy Agency (IEA, 2005). All data is for 2003. All calculations are based on CO2 equivalents, using 100-year global warming potentials from the IPCC<br />
(1996), based on total U.S. emissions <strong>of</strong> 6,978 MtCO2 equivalent. Emissions from fuels in international bunkers are included under Transportation. Emissions from solvents are included under Industrial Processes.<br />
Emissions and sinks from land use change and forestry (LUCF), which account for a sink <strong>of</strong> 821.6 MtCO2 equivalent, and flows less than 0.1 percent <strong>of</strong> total emissions are not shown. For detailed descriptions <strong>of</strong> sector and<br />
end use/activity definitions, see Navigating the Numbers: Greenhouse Gas Data and International Climate Policy (WRI, 2005).<br />
Source: World Resources Institute www.wri.org<br />
<strong>City</strong> <strong>of</strong> <strong>Urbana</strong><br />
100