CLIMATE ACTION PLAN - City of Urbana
CLIMATE ACTION PLAN - City of Urbana
CLIMATE ACTION PLAN - City of Urbana
- No tags were found...

Create successful ePaper yourself
Turn your PDF publications into a flip-book with our unique Google optimized e-Paper software.
110,100 43,000<br />
152,000 32,300 114,500 35,200 97,900 20,100 33,500<br />
2007<br />
2.4<br />
97,800 38,100<br />
129,000<br />
27,400<br />
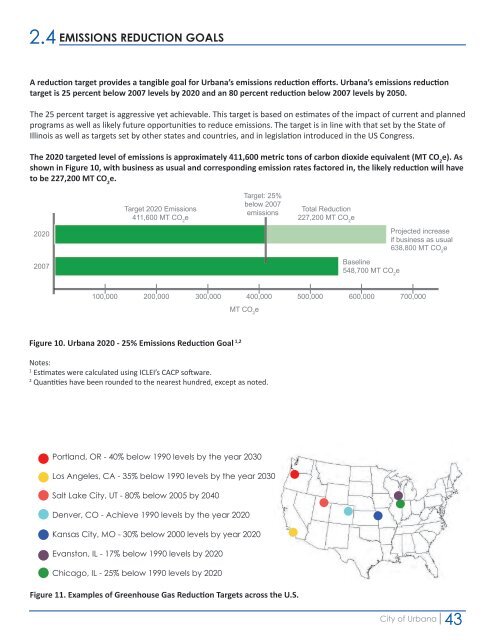
EMISSIONS REDUCTION GOALS<br />
A reduction target provides a tangible goal for <strong>Urbana</strong>’s emissions reduction efforts. <strong>Urbana</strong>’s emissions reduction<br />
Residential Residential Commercial Commercial Industrial Industrial<br />
target is 25 percent below 2007 levels by 2020 and an 80 percent reduction below 2007 levels by 2050.<br />
The 25 percent target is aggressive yet achievable. This target is based on estimates <strong>of</strong> the impact <strong>of</strong> current and planned<br />
programs as well as likely future opportunities to reduce emissions. The target is in line with that set by the State <strong>of</strong><br />
Illinois as well as targets set by other states and countries, and in legislation introduced in the US Congress.<br />
The 2020 targeted level <strong>of</strong> emissions is approximately 411,600 metric tons <strong>of</strong> carbon dioxide equivalent (MT CO 2<br />
e). As<br />
shown in Figure 10, with business as usual and corresponding emission rates factored in, the likely reduction will have<br />
to be 227,200 MT CO 2<br />
e.<br />
2020<br />
100,000 200,000 300,000 400,000 500,000 600,000 700,000<br />
MT CO 2<br />
e<br />
Electricity Gas Electricity Gas Electricity Gas<br />
Gasoline Diesel Waste<br />
Note: Figures are rounded to the nearest hundred and shown in MT CO 2<br />
e<br />
GHG Emissions Reduction Goal: 25% below 2007 levels by 2020<br />
Target 2020 Emissions<br />
411,600 MT CO 2<br />
e<br />
90,300<br />
27,800<br />
Target: 25%<br />
below 2007<br />
emissions<br />
92,600<br />
17,700 28,000<br />
Total Reduction<br />
227,200 MT CO 2<br />
e<br />
Baseline<br />
emissions<br />
Projected increase<br />
if business as usual<br />
638,800 MT CO 2<br />
e<br />
2007<br />
Baseline<br />
548,700 MT CO 2<br />
e<br />
100,000 200,000 300,000 400,000 500,000 600,000 700,000<br />
MT CO 2<br />
e<br />
Note: Figures are rounded to the nearest hundred and shown in MT CO 2<br />
e<br />
Figure 10. <strong>Urbana</strong> 2020 - 25% Emissions Reduction Goal 1,2<br />
Notes:<br />
1<br />
Estimates were calculated using ICLEI’s CACP s<strong>of</strong>tware.<br />
2<br />
Quantities have been rounded to the nearest hundred, except as noted.<br />
Portland, OR - 40% below 1990 levels by the year 2030<br />
Los Angeles, CA - 35% below 1990 levels by the year 2030<br />
Salt Lake <strong>City</strong>, UT - 80% below 2005 by 2040<br />
Denver, CO - Achieve 1990 levels by the year 2020<br />
Kansas <strong>City</strong>, MO - 30% below 2000 levels by year 2020<br />
Evanston, IL - 17% below 1990 levels by 2020<br />
Chicago, IL - 25% below 1990 levels by 2020<br />
Figure 11. Examples <strong>of</strong> Greenhouse Gas Reduction Targets across the U.S.<br />
<strong>City</strong> <strong>of</strong> <strong>Urbana</strong><br />
43