CLIMATE ACTION PLAN - City of Urbana
CLIMATE ACTION PLAN - City of Urbana
CLIMATE ACTION PLAN - City of Urbana
- No tags were found...

You also want an ePaper? Increase the reach of your titles
YUMPU automatically turns print PDFs into web optimized ePapers that Google loves.
3.2<br />
GOAL 2:<br />
REDUCE EMISSIONS FROM GASOLINE CONSUMPTION<br />
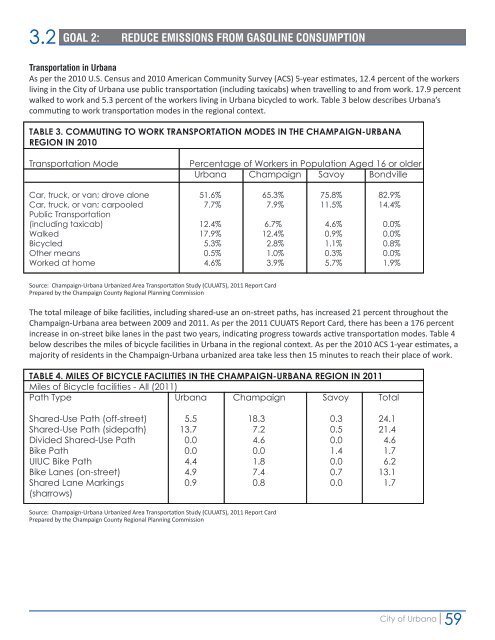
Transportation in <strong>Urbana</strong><br />
As per the 2010 U.S. Census and 2010 American Community Survey (ACS) 5-year estimates, 12.4 percent <strong>of</strong> the workers<br />
living in the <strong>City</strong> <strong>of</strong> <strong>Urbana</strong> use public transportation (including taxicabs) when travelling to and from work. 17.9 percent<br />
walked to work and 5.3 percent <strong>of</strong> the workers living in <strong>Urbana</strong> bicycled to work. Table 3 below describes <strong>Urbana</strong>’s<br />
commuting to work transportation modes in the regional context.<br />
TABLE 3. COMMUTING TO WORK TRANSPORTATION MODES IN THE CHAMPAIGN-URBANA<br />
REGION IN 2010<br />
Transportation Mode<br />
Percentage <strong>of</strong> Workers in Population Aged 16 or older<br />
<strong>Urbana</strong> Champaign Savoy Bondville<br />
Car, truck, or van; drove alone 51.6% 65.3% 75.8% 82.9%<br />
Car, truck, or van; carpooled 7.7% 7.9% 11.5% 14.4%<br />
Public Transportation<br />
(including taxicab) 12.4% 6.7% 4.6% 0.0%<br />
Walked 17.9% 12.4% 0.9% 0.0%<br />
Bicycled 5.3% 2.8% 1.1% 0.8%<br />
Other means 0.5% 1.0% 0.3% 0.0%<br />
Worked at home 4.6% 3.9% 5.7% 1.9%<br />
Source: Champaign-<strong>Urbana</strong> Urbanized Area Transportation Study (CUUATS), 2011 Report Card<br />
Prepared by the Champaign County Regional Planning Commission<br />
The total mileage <strong>of</strong> bike facilities, including shared-use an on-street paths, has increased 21 percent throughout the<br />
Champaign-<strong>Urbana</strong> area between 2009 and 2011. As per the 2011 CUUATS Report Card, there has been a 176 percent<br />
increase in on-street bike lanes in the past two years, indicating progress towards active transportation modes. Table 4<br />
below describes the miles <strong>of</strong> bicycle facilities in <strong>Urbana</strong> in the regional context. As per the 2010 ACS 1-year estimates, a<br />
majority <strong>of</strong> residents in the Champaign-<strong>Urbana</strong> urbanized area take less then 15 minutes to reach their place <strong>of</strong> work.<br />
TABLE 4. MILES OF BICYCLE FACILITIES IN THE CHAMPAIGN-URBANA REGION IN 2011<br />
Miles <strong>of</strong> Bicycle facilities - All (2011)<br />
Path Type <strong>Urbana</strong> Champaign Savoy Total<br />
Shared-Use Path (<strong>of</strong>f-street) 5.5 18.3 0.3 24.1<br />
Shared-Use Path (sidepath) 13.7 7.2 0.5 21.4<br />
Divided Shared-Use Path 0.0 4.6 0.0 4.6<br />
Bike Path 0.0 0.0 1.4 1.7<br />
UIUC Bike Path 4.4 1.8 0.0 6.2<br />
Bike Lanes (on-street) 4.9 7.4 0.7 13.1<br />
Shared Lane Markings 0.9 0.8 0.0 1.7<br />
(sharrows)<br />
Source: Champaign-<strong>Urbana</strong> Urbanized Area Transportation Study (CUUATS), 2011 Report Card<br />
Prepared by the Champaign County Regional Planning Commission<br />
<strong>City</strong> <strong>of</strong> <strong>Urbana</strong><br />
59