CLIMATE ACTION PLAN - City of Urbana
CLIMATE ACTION PLAN - City of Urbana
CLIMATE ACTION PLAN - City of Urbana
- No tags were found...

Create successful ePaper yourself
Turn your PDF publications into a flip-book with our unique Google optimized e-Paper software.
2.1<br />
OVERVIEW<br />
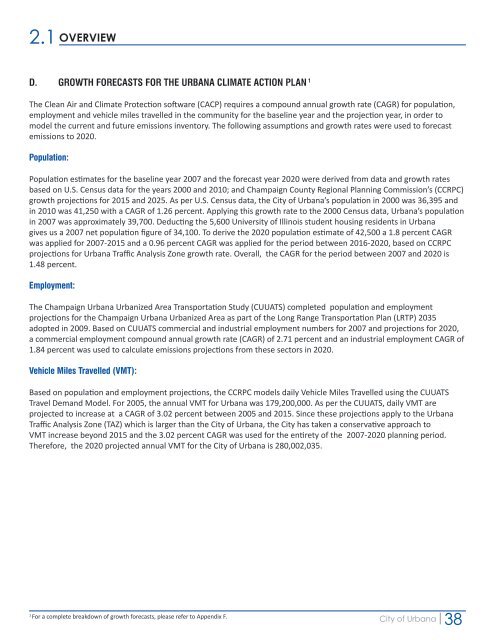
D. GROWTH FORECASTS FOR THE URBANA <strong>CLIMATE</strong> <strong>ACTION</strong> <strong>PLAN</strong> 1<br />
The Clean Air and Climate Protection s<strong>of</strong>tware (CACP) requires a compound annual growth rate (CAGR) for population,<br />
employment and vehicle miles travelled in the community for the baseline year and the projection year, in order to<br />
model the current and future emissions inventory. The following assumptions and growth rates were used to forecast<br />
emissions to 2020.<br />
Population:<br />
Population estimates for the baseline year 2007 and the forecast year 2020 were derived from data and growth rates<br />
based on U.S. Census data for the years 2000 and 2010; and Champaign County Regional Planning Commission’s (CCRPC)<br />
growth projections for 2015 and 2025. As per U.S. Census data, the <strong>City</strong> <strong>of</strong> <strong>Urbana</strong>’s population in 2000 was 36,395 and<br />
in 2010 was 41,250 with a CAGR <strong>of</strong> 1.26 percent. Applying this growth rate to the 2000 Census data, <strong>Urbana</strong>’s population<br />
in 2007 was approximately 39,700. Deducting the 5,600 University <strong>of</strong> Illinois student housing residents in <strong>Urbana</strong><br />
gives us a 2007 net population figure <strong>of</strong> 34,100. To derive the 2020 population estimate <strong>of</strong> 42,500 a 1.8 percent CAGR<br />
was applied for 2007-2015 and a 0.96 percent CAGR was applied for the period between 2016-2020, based on CCRPC<br />
projections for <strong>Urbana</strong> Traffic Analysis Zone growth rate. Overall, the CAGR for the period between 2007 and 2020 is<br />
1.48 percent.<br />
Employment:<br />
The Champaign <strong>Urbana</strong> Urbanized Area Transportation Study (CUUATS) completed population and employment<br />
projections for the Champaign <strong>Urbana</strong> Urbanized Area as part <strong>of</strong> the Long Range Transportation Plan (LRTP) 2035<br />
adopted in 2009. Based on CUUATS commercial and industrial employment numbers for 2007 and projections for 2020,<br />
a commercial employment compound annual growth rate (CAGR) <strong>of</strong> 2.71 percent and an industrial employment CAGR <strong>of</strong><br />
1.84 percent was used to calculate emissions projections from these sectors in 2020.<br />
Vehicle Miles Travelled (VMT):<br />
Based on population and employment projections, the CCRPC models daily Vehicle Miles Travelled using the CUUATS<br />
Travel Demand Model. For 2005, the annual VMT for <strong>Urbana</strong> was 179,200,000. As per the CUUATS, daily VMT are<br />
projected to increase at a CAGR <strong>of</strong> 3.02 percent between 2005 and 2015. Since these projections apply to the <strong>Urbana</strong><br />
Traffic Analysis Zone (TAZ) which is larger than the <strong>City</strong> <strong>of</strong> <strong>Urbana</strong>, the <strong>City</strong> has taken a conservative approach to<br />
VMT increase beyond 2015 and the 3.02 percent CAGR was used for the entirety <strong>of</strong> the 2007-2020 planning period.<br />
Therefore, the 2020 projected annual VMT for the <strong>City</strong> <strong>of</strong> <strong>Urbana</strong> is 280,002,035.<br />
1<br />
For a complete breakdown <strong>of</strong> growth forecasts, please refer to Appendix F.<br />
<strong>City</strong> <strong>of</strong> <strong>Urbana</strong><br />
38