CLIMATE ACTION PLAN - City of Urbana
CLIMATE ACTION PLAN - City of Urbana
CLIMATE ACTION PLAN - City of Urbana
- No tags were found...

Create successful ePaper yourself
Turn your PDF publications into a flip-book with our unique Google optimized e-Paper software.
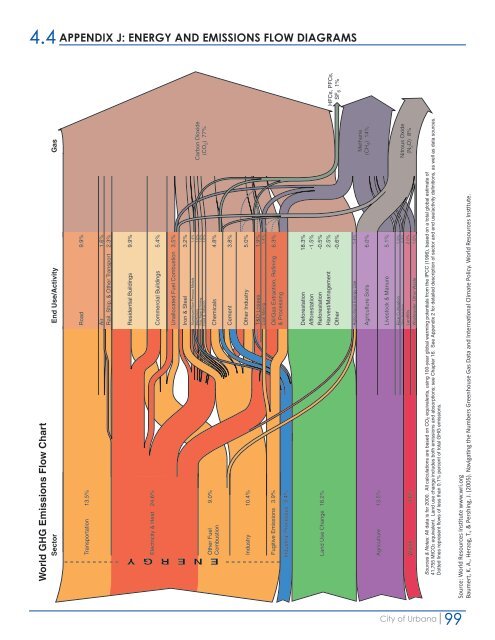
4.4 APPENDIX J: ENERGY AND EMISSIONS FLOW DIAGRAMS<br />
World GHG Emissions Flow Chart<br />
Sector End Use/Activity Gas<br />
Transportation 13.5%<br />
Road<br />
9.9%<br />
Air<br />
Rail, Ship, & Other Transport<br />
1.6%<br />
2.3%<br />
Electricity & Heat 24.6%<br />
Other Fuel<br />
Combustion<br />
9.0%<br />
Residential Buildings<br />
Commercial Buildings<br />
Unallocated Fuel Combustion<br />
Iron & Steel<br />
Aluminum/Non-Ferrous Metals<br />
Machinery<br />
Pulp, Paper & Printing<br />
Food & Tobacco<br />
Chemicals<br />
9.9%<br />
5.4%<br />
3.5%<br />
3.2%<br />
1.4%<br />
1.0%<br />
1.0%<br />
1.0%<br />
4.8%<br />
Carbon Dioxide<br />
(CO 2 ) 77%<br />
E N E R G Y<br />
Cement<br />
3.8%<br />
Industry<br />
10.4%<br />
Other Industry<br />
5.0%<br />
T&D Losses<br />
Coal Mining<br />
1.9%<br />
1.4%<br />
Fugitive Emissions<br />
3.9%<br />
Industrial Processes 3.4%<br />
Oil/Gas Extraction, Refining<br />
& Processing<br />
6.3%<br />
Land Use Change 18.2%<br />
Deforestation<br />
Afforestation<br />
Reforestation<br />
Harvest/Management<br />
Other<br />
18.3%<br />
-1.5%<br />
-0.5%<br />
2.5%<br />
-0.6%<br />
Agricultural Energy Use<br />
Agriculture Soils<br />
1.4%<br />
6.0%<br />
Methane<br />
(CH 4 ) 14%<br />
Agriculture 13.5%<br />
Livestock & Manure<br />
5.1%<br />
Waste<br />
3.6%<br />
Rice Cultivation<br />
Other Agriculture<br />
Landfills<br />
Wastewater, Other Waste<br />
1.5%<br />
0.9%<br />
2.0%<br />
1.6%<br />
Nitrous Oxide<br />
(N 2 O) 8%<br />
Sources & Notes: All data is for 2000. All calculations are based on CO2 equivalents, using 100-year global warming potentials from the IPCC (1996), based on a total global estimate <strong>of</strong><br />
41,755 MtCO2 equivalent. Land use change includes both emissions and absorptions; see Chapter 16. See Appendix 2 for detailed description <strong>of</strong> sector and end use/activity definitions, as well as data sources.<br />
Dotted lines represent flows <strong>of</strong> less than 0.1% percent <strong>of</strong> total GHG emissions.<br />
Source: World Resources Institute www.wri.org<br />
Baumert, K. A., Herzog, T., & Pershing, J. (2005). Navigating the Numbers Greenhouse Gas Data and International Climate Policy. World Resources Institute.<br />
HFCs, PFCs,<br />
SF 6 1%<br />
<strong>City</strong> <strong>of</strong> <strong>Urbana</strong><br />
99