FUZZY CLUSTERING, GENETIC ALGORITHMS AND NEURO ... - ITM
FUZZY CLUSTERING, GENETIC ALGORITHMS AND NEURO ... - ITM
FUZZY CLUSTERING, GENETIC ALGORITHMS AND NEURO ... - ITM

Create successful ePaper yourself
Turn your PDF publications into a flip-book with our unique Google optimized e-Paper software.
604 P.F. VAN LITH et al.<br />
kþ1 ¼ k þ w ,k<br />
ð6Þ<br />
Downloaded by [University of Groningen] at 04:43 19 September 2012<br />
where subscript k denotes the time step. t is the sampling time and<br />
w ,k is the process noise for at time step k. Process noise is simulated<br />
by adding white noise to the original process state (S, X, P and V ) at<br />
every time step. This noisy state was then used to calculate the state at<br />
the next time step, so some correlation in the process noise occurs.<br />
The process state vector for the Kalman filter is defined as<br />
X Kalman,k ¼ col( , X k , S k , P k , V k ). Using the model equations, the<br />
filter is able to make estimations of based on both process measurements<br />
(generated by the reference model) and the estimates of X,<br />
S, P and V. The filter was tuned by adjusting the diagonal elements<br />
of the noise covariance matrix Q using trial and error. The initial<br />
process state was taken the same as the process measurements at<br />
t ¼ 0. An initial estimate for the unmeasured at t ¼ 0 was also made<br />
to initialize the filter. The filter results were analyzed by observability<br />
and robustness measures from [8] and by reviewing the autocorrelation<br />
of the innovation of the filter.<br />
The Kalman filter that was developed estimates for one batch run<br />
only. Although this results in input–output data in the form of estimates<br />
of S, X, and , data from one batch run do not provide sufficient<br />
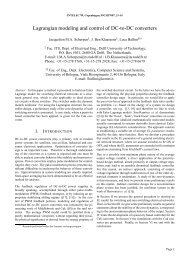
information for the input–output mapping for . Figure 2a illustrates<br />
this. To obtain sufficient information about the mapping, the filter is<br />
applied to several batch runs, each executed under different conditions,<br />
by varying the input flow rate and the initial conditions of the reactor.<br />
This provides more information about the relationship between S, X,<br />
and , as shown in Fig. 2b.<br />
FIGURE 2 as a function of S and X for one batch run (a); and as a function of S<br />
and X for 6 additional batch runs (b).