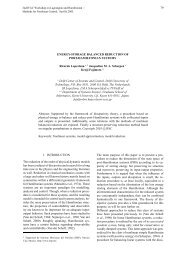
MODELLING TOLUENE OXIDATION Incorporation of Mass ... - ITM
MODELLING TOLUENE OXIDATION Incorporation of Mass ... - ITM
MODELLING TOLUENE OXIDATION Incorporation of Mass ... - ITM

Create successful ePaper yourself
Turn your PDF publications into a flip-book with our unique Google optimized e-Paper software.
0263–8762/05/$30.00+0.00<br />
# 2005 Institution <strong>of</strong> Chemical Engineers<br />
www.icheme.org/journals Trans IChemE, Part A, February 2005<br />
doi: 10.1205/cherd.04161 Chemical Engineering Research and Design, 83(A2): 187–195<br />
<strong>MODELLING</strong> <strong>TOLUENE</strong> <strong>OXIDATION</strong><br />
<strong>Incorporation</strong> <strong>of</strong> <strong>Mass</strong> Transfer Phenomena<br />
J. A. A. HOORN 1 , J. VAN SOOLINGEN 1 and G. F. VERSTEEG 2<br />
1 DSM Research, Geleen, Netherlands<br />
2 Department <strong>of</strong> Chemical Engineering, University <strong>of</strong> Twente, Enschede, Netherlands<br />
The kinetics <strong>of</strong> the oxidation <strong>of</strong> toluene have been studied in close interaction with the<br />
gas–liquid mass transfer occurring in the reactor. Kinetic parameters for a simple<br />
model have been estimated on basis <strong>of</strong> experimental observations performed under<br />
industrial conditions. The conclusions for the mass transfer and reaction regime on basis <strong>of</strong><br />
experimental observations and model calculations are in good agreement: toluene oxidation<br />
under industrial conditions can be characterized as a slow reaction with respect to mass<br />
transfer.<br />
Keywords: chemical reactors; kinetics; mass transfer; mathematical modelling; multiphase<br />
reactions; reaction engineering.<br />
INTRODUCTION<br />
The site <strong>of</strong> DSM Special Products Rotterdam has the<br />
largest toluene oxidation plant in the world, producing benzoic<br />
acid that for the major part is converted to phenol. In<br />
addition, benzoic acid and its derivative sodium benzoate<br />
also find their applications in the food and fine chemicals<br />
industry. The DSM site at Rotterdam also has the largest<br />
production unit for benzaldehyde, a specialty chemical.<br />
Since the development <strong>of</strong> the process (Keading et al.,<br />
1965) a large number <strong>of</strong> studies on the chemistry <strong>of</strong> toluene<br />
oxidation and related hydrocarbons have been published.<br />
Most <strong>of</strong> the earlier publications have in common that the<br />
main focus is on the kinetics and that other process items<br />
are not considered (Borgaonkar et al., 1984; Lozar et al.,<br />
2001; Mulkay and Rouchaud, 1967; Quiroga et al., 1980;<br />
Scott and Chester, 1972). This approach is not sufficient<br />
when considering scale-up and modelling <strong>of</strong> the plant reactors.<br />
For safety reasons, oxygen levels in the reactor <strong>of</strong>f-gas<br />
have to be kept below the explosion limits. This means that<br />
at least in part <strong>of</strong> the reactor the oxygen partial pressure is<br />
so low that the liquid concentration is significantly<br />
decreased. In the range <strong>of</strong> low oxygen concentrations, the<br />
radical chain mechanism produces different by-products<br />
(Bateman, 1951). In addition, it is expected that the mass<br />
transfer <strong>of</strong> oxygen influences the productivity <strong>of</strong> the reactor.<br />
It is essential to quantify kinetics in close interaction<br />
with the mass transfer phenomena occurring in the reactor<br />
in order to increase the control <strong>of</strong> the productivity and<br />
selectivity.<br />
Correspondence to: J. A. A. Hoorn, DSM Research, CT&A-ACES,<br />
PO Box 18, 6160 MD Geleen, The Netherlands.<br />
E-mail: johan.hoorn@dsm.com<br />
KINETICS AND MASS TRANSFER<br />
The oxidation <strong>of</strong> toluene with air at elevated temperatures<br />
and pressures proceeds via a mechanism consisting<br />
<strong>of</strong> a chain <strong>of</strong> radical reactions and is initialized by cobalt<br />
ions. The use <strong>of</strong> elementary reactions in this radical mechanism<br />
is at this moment too complicated (lack <strong>of</strong> basic data<br />
and the need for extensive numerical solving techniques) to<br />
be <strong>of</strong> much practical use in the analyses on mass transfer<br />
and reaction. Instead a more simplified kinetic description<br />
is applied in the present study. The kinetic scheme in<br />
Figure 1 is directly derived from the stoichiometric<br />
equations (assuming elementary reactions) and has been<br />
proposed earlier for toluene oxidation (Quiroga et al.,<br />
1980) as well as xylene oxidation (Cao et al., 1994). For<br />
oxidation reactions proceeding through radical intermediates,<br />
a zero-order reaction rate is commonly encountered<br />
(Helfferich, 2001). Morimoto and Ogata (1967) concluded<br />
from their batch experiments that for oxygen levels below<br />
42 vol% (the oxygen concentration in the reactor was<br />
kept constant by maintaining a constant pressure through<br />
suppletion <strong>of</strong> pure oxygen to the oxygen/nitrogen mixture)<br />
the reaction order in oxygen can be taken as one, whereas at<br />
higher oxygen levels the order is zero. Bhattacharya et al.<br />
(1973) give a reaction order for oxygen <strong>of</strong> 1 2<br />
, but the experimental<br />
conditions are not fully given. The rates for<br />
the reactions in Figure 1 are assumed to be first-order in<br />
the reactants, also for oxygen. As it mathematically can<br />
be shown, it is not possible to determine the individual<br />
rate constants for reactions 1, 2 and 4 independently without<br />
experiments comprising benzyl alcohol added to the<br />
feed. These experiments have not been performed while<br />
the availability <strong>of</strong> the experimental set-up for kinetic experiments<br />
was very limited. In addition, benzyl alcohol is<br />
187
188 HOORN et al.<br />
Figure 1. Basic scheme for the kinetics.<br />
known to inhibit the oxidation (Morimoto and Ogata, 1967)<br />
making the operation <strong>of</strong> a continuous tank reactor more<br />
difficult than it is already. A correlation between R 1 and<br />
R 2 was made on basis <strong>of</strong> the observation that in the<br />
oxidation mechanism the primary termination reaction<br />
takes place between two alkoxy radicals (Russell, 1957;<br />
Kondratiev, 1969) whereby alcohol and aldehyde are<br />
formed in a 1 : 1 ratio. For this reason, the parameters k 1<br />
and k 2 were replaced by a single parameter k 12 giving the<br />
following expressions for the reaction rates:<br />
R 1 ¼ k 12 c TOL c O2 (1)<br />
R 2 ¼ k 12 c TOL c O2 (2)<br />
R 3 ¼ k 3 c BALD c O2 (3)<br />
R 4 ¼ k 4 c BALC c O2 (4)<br />
The influence <strong>of</strong> the catalyst was not included in the rate<br />
equations because all experimental data have been performed<br />
at a constant cobalt concentration. The expression<br />
for the Hatta number (w) depends on the reaction rate<br />
equation. For a first-order irreversible reaction with respect<br />
to the absorbing component w is defined by:<br />
pffiffiffiffiffiffiffiffiffi<br />
k D<br />
w ¼<br />
(5)<br />
k L<br />
For systems consisting <strong>of</strong> multiple reactions involving<br />
the gaseous component the most commonly applied simplification<br />
is to evaluate the Hatta number on the assumption<br />
that an overall pseudo zero-order or first-order rate equation<br />
is applicable. The model <strong>of</strong> the xylene oxidation by Cao<br />
et al. (1994) comprises a zero order reaction for oxygen<br />
where Hatta is calculated according to the correlation <strong>of</strong><br />
Hikita and Asai (1964). This approach is also applied by<br />
Suresh et al. (1988) in the modelling <strong>of</strong> the cyclohexane<br />
oxidation. Pohorecki et al. (2001) apply a first order dependence<br />
for oxygen in the cyclohexane oxidation with a<br />
kinetic scheme that has a close resemblance to the toluene<br />
oxidation scheme given in Figure 1. The mass transfer<br />
flux for a first-order irreversible reaction according to<br />
the Danckwerts modification <strong>of</strong> the penetration theory is<br />
defined by (Westerterp et al., 1984):<br />
<br />
<br />
c A,b<br />
J ¼ k L c A,i<br />
1 þ w 2<br />
p<br />
<br />
ffiffiffiffiffiffiffiffiffiffiffiffiffi<br />
1 þ w 2<br />
The extremes for small and large Hatta numbers are<br />
convenient for simple evaluations on basis <strong>of</strong> analytical<br />
solutions.<br />
(6)<br />
w . 2 J ¼ k L c A,i w (7)<br />
w , 0:3 J ¼ k L (c A,i c A,b ) (8)<br />
The enhancement factor is the ratio <strong>of</strong> the flux in presence<br />
<strong>of</strong> reaction [equation (6)] and pure physical mass<br />
transfer under identical conditions [expression is equivalent<br />
to equation (8)].<br />
E ¼<br />
p ffiffiffiffiffiffiffiffiffiffiffiffiffi<br />
1 þ w 2 <br />
c A,i<br />
(c A,b )=(1 þ w 2 ) <br />
c A,i c A,b<br />
(9)<br />
The extremes for small and large Hatta numbers are:<br />
w . 2 E ¼ w (10)<br />
w , 0:3 E ¼ 1 (11)<br />
The Hatta number and the enhancement factor are calculated<br />
from experimental observations, respectively<br />
included in the modelling.<br />
EXPERIMENTS AND OBSERVATIONS<br />
The reactor and auxiliary equipment for the toluene<br />
oxidation experiments are operated in a continuous mode,<br />
Trans IChemE, Part A, Chemical Engineering Research and Design, 2005, 83(A2): 187–195
<strong>MODELLING</strong> <strong>TOLUENE</strong> <strong>OXIDATION</strong> 189<br />
a schematic drawing <strong>of</strong> the set-up is given in Figure 2. All<br />
equipment is accommodated in an explosion pro<strong>of</strong> facility.<br />
From the continuous monitoring <strong>of</strong> the reactor temperature<br />
and the oxygen concentration in the <strong>of</strong>f-gas during experiments<br />
it appeared that small fluctuations are present in<br />
the reaction set-up. The standard deviations <strong>of</strong> the results<br />
<strong>of</strong> five reference experiments having identical process conditions<br />
are shown in Table 1 as an indication <strong>of</strong> the extent<br />
<strong>of</strong> experimental inaccuracies. The range <strong>of</strong> process variables<br />
<strong>of</strong> all experiments is included for comparison. A<br />
number <strong>of</strong> experiments have been performed with insufficient<br />
tracing in part <strong>of</strong> the piping from the reactor vessel<br />
to the condenser causing a partial condensation <strong>of</strong> the<br />
vapour and subsequent reflux <strong>of</strong> components to the reactor.<br />
The rate <strong>of</strong> oxygen transferred to the liquid phase (F GL )<br />
was calculated from the difference between the gas feed<br />
and <strong>of</strong>f-gas flow. Both the liquid and the gas phase were<br />
assumed to be ideally mixed; the residence times for the<br />
liquid were in the order <strong>of</strong> one hour. To address the gas<br />
phase mixing qualitatively a visual check was performed<br />
in an glass vessel comprising identical baffle and stirrer<br />
configuration. With cyclohexane as liquid at room temperature<br />
and nitrogen as gas feed, it was observed that at 1600<br />
rpm stirrer speed a significant amount <strong>of</strong> gas backmixing<br />
occured into the liquid by means <strong>of</strong> vortex formation<br />
around the stirrer and turbulences behind the baffles. In<br />
addition, it was assumed that no oxygen is present in the<br />
liquid feed and the system operates at steady state. The<br />
oxygen concentration in the liquid at saturation was calculated<br />
according to Henry’s law. The Henry coefficients<br />
were calculated from gas–liquid equilibirum data retrieved<br />
from the Dortmund Data Bank (program version DDBSP<br />
2003; http://www.ddbst.com, president and CEO <strong>of</strong><br />
DDBST is Pr<strong>of</strong>. Dr J. Gmehling, access date 26 November<br />
2004). Typical values are in the range <strong>of</strong> 1500–2000 bar.<br />
The partial pressure <strong>of</strong> oxygen was determined from the<br />
<strong>of</strong>f-gas and condensate composition. In Figure 3 the conversion<br />
rates for oxygen are shown as function <strong>of</strong> the<br />
oxygen concentration in the liquid. The conversion rate<br />
for oxygen is defined as the transfer rate <strong>of</strong> oxygen divided<br />
by the liquid volume; in this way the outflow <strong>of</strong> dissolved<br />
oxygen is neglected. The experimentally observed oxygen<br />
transfer rate F GL is related with the flux through the interfacial<br />
area:<br />
F GL ¼ J V R a (12)<br />
In case w . 2 substitution <strong>of</strong> the expression for the<br />
observed transfer rate gives (taking into account the definition<br />
for the Hatta number):<br />
k ¼ 1 <br />
D F 2<br />
GL<br />
(13)<br />
V R a c A,i<br />
For w , 0.3 the bulk concentration can be calculated<br />
from a balance for oxygen in the liquid phase:<br />
0 ¼ f V c A,b ð1 1ÞV R k c A,b þ J V R a (14)<br />
The outflow <strong>of</strong> dissolved oxygen is considered to be much<br />
smaller than the reaction term and the transfer rate through<br />
the gas–liquid interface; therefore equation (14) can be<br />
simplified to:<br />
0 ¼ (1 1) V R k c A,b þ J V R a (15)<br />
with the substitution for J [equation (8)]:<br />
c A,b 1<br />
¼<br />
c A,i 1 þ Al w 2 (16)<br />
where Al is the Hinterland ratio:<br />
Al ¼ (1 1) k L<br />
(17)<br />
a D<br />
Combining the expression for the bulk concentration<br />
with the flux and the observed conversion rate gives an<br />
equation that can be solved with respect to the kinetic<br />
rate constant:<br />
<br />
<br />
c A,i<br />
F GL ¼ V R a k L c A,i<br />
1 þ Al w 2<br />
(18)<br />
Solving for k gives:<br />
k2 L<br />
F GL<br />
k ¼<br />
Al D <br />
(19)<br />
V R k L a c A,i F GL<br />
Values for specific surface areas were estimated with the<br />
correlation <strong>of</strong> Shridhar and Potter (1980), diffusion coefficients<br />
were estimated with the correlation <strong>of</strong> Wilke<br />
and Chang (1955). <strong>Mass</strong> transfer coefficients were estimated<br />
for water with the equation <strong>of</strong> van’t Riet (1979).<br />
To translate the mass transfer coefficients from water to<br />
toluene at reactor conditions, a result from Higbie’s penetration<br />
theory was applied:<br />
k L (toluene, 150 8 C)<br />
k L (water, 25 8 ¼<br />
C)<br />
sffiffiffiffiffiffiffiffiffiffiffiffiffiffiffiffiffiffiffiffiffiffiffiffiffiffiffiffiffiffiffiffiffiffiffi<br />
D(toluene, 150 8 C)<br />
D(water, 25 8 C)<br />
(20)<br />
Figure 2. Experimental set-up.<br />
The experimental conditions in the experiments were<br />
such that the volumetric mass transfer coefficient could<br />
be taken as constant at a value <strong>of</strong> 0.75 s 21 . The interfacial<br />
Trans IChemE, Part A, Chemical Engineering Research and Design, 2005, 83(A2): 187–195
190 HOORN et al.<br />
Table 1. Data from a series <strong>of</strong> standard experiments.<br />
Range <strong>of</strong> operation including<br />
all experiments<br />
Standard deviation<br />
in reference experiments<br />
Reactor temperature 8C 140–160 0.8%<br />
Reactor pressure bar 4–7 0.2%<br />
Off-gas inert flow Nl/h 100–300 1.1%<br />
Feed flow toluene kg/h 1–2 1.0%<br />
Feed flow air Nl/h 100–300 0.3%<br />
Flow liquid discharge kg/h 0.5–1.5 2.1%<br />
Flow condensate kg/h 0.5–1.5 2.3%<br />
Off-gas oxygen level vol% 0–6 32.5%<br />
Condensate Balc mol/h 0.0003–0.005 12.5%<br />
Bald mol/h 0.003–0.02 7.3%<br />
BzA mol/h 0–0.02 20.8%<br />
H 2 O mol/h 0.6–1.6 11.0%<br />
Tol mol/h 2.1–5.6 4.8%<br />
Liquid discharge Balc mol/h 0.003–0.05 3.9%<br />
Bald mol/h 0.03–0.2 1.8%<br />
BzA mol/h 0.4–1.1 3.3%<br />
Tol mol/h 1.5–10.9 1.5%<br />
area was taken as a constant at 300 m 2 /m 3 . Under the<br />
hypothesis that the reaction is fast, i.e., w . 2, the<br />
calculated rate constant [equation (13)] is 100 s 21<br />
(+56 s 21 , standard deviation for the experimental observations).<br />
The corresponding Hatta number on basis <strong>of</strong> this<br />
rate constant can then be estimated to be 0.60 + 0.16.<br />
This is not in line with the assumption <strong>of</strong> a fast reaction<br />
with w . 2. For the hypothesis <strong>of</strong> a slow reaction, i.e., w<br />
, 0.3, the calculated rate constant is 2.2 + 3.2 s 21<br />
giving a Hatta number <strong>of</strong> 0.079 + 0.048 which is in line<br />
with the assumption made for the Hatta number. Therefore,<br />
it is concluded that on basis <strong>of</strong> the experimental observations<br />
the reaction rate is slow in comparison to the<br />
mass transfer rate <strong>of</strong> oxygen.<br />
<strong>MODELLING</strong> OF THE EXPERIMENTAL REACTOR<br />
A model was constructed to determine the kinetic parameters<br />
under conditions <strong>of</strong> mass transfer limitations<br />
while taking into account partial condensation <strong>of</strong> the<br />
vapour phase. To include a description <strong>of</strong> the partial condensation<br />
between the reactor and the condenser the<br />
model comprised two flash calculations for the reactor<br />
part <strong>of</strong> the set-up. A scheme <strong>of</strong> the model is given in<br />
Figure 4. For an overview on the model equations see<br />
Appendix. The model calculations were performed in<br />
Aspen Custom Modeler. Thermodynamic properties for<br />
the liquid phase were calculated with Aspen Plus Properties.<br />
The pure component properties were taken from the<br />
DIPPR Handbook (http://dippr.byu.edu, American Institute<br />
<strong>of</strong> Chemical Engineers, access date 25 May 2004) or<br />
DDBST (http://www.ddbst.com). The interaction between<br />
components was described by the NRTL-model. The<br />
thermodynamic property files generated in Aspen Plus<br />
were included in the ACM file. The liquid from the<br />
second flash is totally refluxed to the first flash (‘liquid<br />
recycle’). The temperature <strong>of</strong> the second flash was varied<br />
for each experiment in such a way that the differences<br />
between experimental and model values for the gas and<br />
liquid mole flows <strong>of</strong> all components were minimized. The<br />
calculations to determine the temperatures <strong>of</strong> the second<br />
flash were performed with a simulated combined feed <strong>of</strong><br />
the liquid discharge and vapour flows. For experiments performed<br />
with the correct tracing, the temperature <strong>of</strong><br />
the second flash was fixed at the temperature <strong>of</strong> the first<br />
Figure 3. Observed conversion rates for oxygen as function <strong>of</strong> the oxygen<br />
concentration in the liquid at saturation.<br />
Figure 4. Schematic drawing <strong>of</strong> model. The symbols in this scheme are<br />
utilized in the overview <strong>of</strong> model equations.<br />
Trans IChemE, Part A, Chemical Engineering Research and Design, 2005, 83(A2): 187–195
<strong>MODELLING</strong> <strong>TOLUENE</strong> <strong>OXIDATION</strong> 191<br />
Table 2. Statistics for vapour–liquid calculations.<br />
SSO (mol 2 /h 2 ) SSR (mol 2 /h 2 ) Standard deviation<br />
SSR without reflux<br />
(mol 2 /h 2 )<br />
Standard deviation<br />
without reflux<br />
Condensate Balc 3.24 . 10 25 5.61 . 10 26 35.5% 8.74 . 10 25 127.5%<br />
Bald 9.29 . 10 24 1.69 . 10 24 21.7% 1.38 . 10 23 61.3%<br />
BzA 4.45 . 10 24 1.87 . 10 24 34.2% 1.34 . 10 24 37.3%<br />
H 2 O 1.26 . 10 1 2.23 . 10 21 11.0% 2.57 . 10 21 12.6%<br />
Tol 1.61 . 10 2 2.72 . 10 0 11.0% 3.34 . 10 1 36.1%<br />
Liquid discharge Balc 6.92 . 10 23 5.61 . 10 26 2.4% 8.74 . 10 25 9.4%<br />
Bald 1.53 . 10 21 1.69 . 10 24 3.0% 1.38 . 10 23 8.7%<br />
BzA 5.09 . 10 0 1.87 . 10 24 0.5% 1.34 . 10 24 0.4%<br />
Tol 4.84 . 10 2 2.72 . 10 0 11.0% 3.34 . 10 1 38.5%<br />
flash. The temperatures <strong>of</strong> the second flash were 5 to 158C<br />
lower than the reactor temperature depending on the<br />
composition <strong>of</strong> the condensate flow. The liquid recycle<br />
amounts to 10–20% (mole flow basis) compared to the<br />
vapour flow feeding the second flash. The statistical results<br />
<strong>of</strong> the calculations are given in Table 2. The kinetic<br />
parameters in Figure 1 were estimated by a least squares<br />
minimization procedure. In the estimation procedure (and<br />
in the subsequent model calculations) the temperatures in<br />
the second flash were fixed at the values calculated earlier.<br />
The most suitable variables as experimental data points and<br />
the optimal weighting were identified after some trial and<br />
error. Best results were obtained with the toluene conversion,<br />
selectivities for benzyl alcohol, benzaldehyde and<br />
benzoic acid and the oxygen <strong>of</strong>f-gas concentration. The<br />
weights <strong>of</strong> the experimental values for a particular variable<br />
were set as reciprocals <strong>of</strong> the average values, except for<br />
oxygen which was given a lower value (10% <strong>of</strong> the reciprocal<br />
average). The results are given in Table 3. In Table 4<br />
the sums <strong>of</strong> the squared residuals <strong>of</strong> model prediction<br />
and experimental values (SSR) are shown. The model<br />
results for the data applied in the estimation procedure<br />
are shown in the parity plots in Figures 5–8. Comparison<br />
between experimental values and model calculations for<br />
the oxygen concentration in the <strong>of</strong>f-gas are shown in<br />
Figure 9. The residuals for benzyl alcohol, benzaldehyde<br />
and benzoic acid selectivity are shown in Figures 10<br />
and 11. Residual values are given as the difference in<br />
selectivity between experiment and model relative to the<br />
observed experimental value. The calculated pseudo<br />
first-order rate constant is k fo ¼ 295 + 14 s 21 , the Hatta<br />
number is w ¼ 0.92+0.05 and the enhancement factor is<br />
E ¼ 1.36+0.03.<br />
DISCUSSION<br />
From Table 1 it appears that the input process parameters<br />
are controlled with acceptable accuracy <strong>of</strong> approximately<br />
1%. The response variables differ in accuracy in the<br />
range <strong>of</strong> 1.5% for toluene in the liquid discharge flow to<br />
20% for benzoic acid in the condensate flow. Benzoic<br />
acid concentrations in the condensate flow are difficult<br />
to analyse because at room temperature the condensate separates<br />
into a water and an organic phase. The low accuracy<br />
for the oxygen measurement is a combination <strong>of</strong> the<br />
analytical measurement and the length <strong>of</strong> the sample pipe<br />
from the <strong>of</strong>f-gas vessel to the instrument. The simulation<br />
<strong>of</strong> the partial condensation in the piping to the condenser<br />
vessel is successfully performed by modelling the reactor<br />
part with an additional flash calculation (Figure 4) and<br />
this is illustrated when the results in Table 2 are compared.<br />
The differences between model predictions and experimental<br />
observations are clearly reduced with respect to the situation<br />
where there is no liquid recycle. When compared<br />
to the indication <strong>of</strong> experimental errors in Table 1, the<br />
model describing the partial condensation has a scatter in<br />
the model predictions that is much closer to the<br />
Table 3. Estimated parameter values and correlation matrix.<br />
Parameter values Reactions Correlation matrix<br />
k 12 0.015 + 0.004 m 3 /mol/s Tol ! Balc k 12 k 3 k 4<br />
Tol ! Bald k 12 1<br />
k 3 1.35 + 0.36 m 3 /mol/s Bald ! BzA k 3 0.98 1<br />
k 4 3.9 + 1.0 m 3 /mol/s Balc ! Bald k 4 0.99 0.98 1<br />
Table 4. Sum <strong>of</strong> squares for experiments and model.<br />
Experiment SSO<br />
Model SSR<br />
O 2 <strong>of</strong>f-gas 7.2 . 10 1 4.3 . 10 1<br />
Tol conversion 7.2 . 10 22 1.8 . 10 23<br />
Balc selectivity 9.6 . 10 23 1.4 . 10 24<br />
Bald selectivity 2.4 . 10 21 1.7 . 10 23<br />
BzA selectivity 7.5 . 10 0 1.6 . 23<br />
10 Figure 5. Comparison between experimental<br />
calculations for the conversion <strong>of</strong> toluene.<br />
values and model<br />
Trans IChemE, Part A, Chemical Engineering Research and Design, 2005, 83(A2): 187–195
192 HOORN et al.<br />
Figure 6. Comparison between experimental values and model<br />
calculations for the selectivity <strong>of</strong> benzyl alcohol.<br />
Figure 9. Comparison between experimental values and model calculations<br />
for the oxygen concentration in the <strong>of</strong>f-gas.<br />
Figure 7. Comparison between experimental values and model<br />
calculations for the selectivity <strong>of</strong> benzaldehyde.<br />
Figure 8. Comparison between experimental values and model<br />
calculations for the selectivity <strong>of</strong> benzoic acid.<br />
Figure 10. Residuals between experimental and model values as function<br />
<strong>of</strong> the residence time based on the liquid feed flow rate; (W) ¼ benzyl<br />
alcohol; (A) ¼ benzaldehyde; (þ) ¼ benzoic acid.<br />
Trans IChemE, Part A, Chemical Engineering Research and Design, 2005, 83(A2): 187–195
<strong>MODELLING</strong> <strong>TOLUENE</strong> <strong>OXIDATION</strong> 193<br />
determination <strong>of</strong> the reaction rate order in oxygen the<br />
results in Figure 3 do not exclude other than simple first<br />
order kinetics. The choice for a first-order oxygen dependence<br />
is quite arbitrary and has been done for practical<br />
reasons, a zero-order model is more difficult to handle<br />
because <strong>of</strong> the discontinuities with the reaction rates.<br />
When some reaction rate equation other than a power<br />
law is required to improve the model accuracy, mass transfer<br />
rates have to be solved by numerical procedures. The<br />
combination <strong>of</strong> these numerical solutions with parameter<br />
estimation procedures has not been performed so far. The<br />
value <strong>of</strong> the Hatta number that was directly derived from<br />
the experimental observations indicates that the oxidation<br />
<strong>of</strong> toluene can be considered to be slow. The Hatta<br />
number <strong>of</strong> 0.09 derived from the experimental observations<br />
is in good agreement with the value calculated with the<br />
model. The enhancement factor calculated by the model<br />
is also close to unity. The results obtained with the<br />
model show a more narrow distribution <strong>of</strong> errors. The standard<br />
deviations in the average Hatta number is smaller (5%<br />
relative) than with the experimentally determined Hatta<br />
number (50%). The low values <strong>of</strong> Hatta and the enhancement<br />
factor imply the presence <strong>of</strong> an oxygen concentration<br />
in the liquid bulk, suggesting that reaction <strong>of</strong> oxygen with<br />
some kind <strong>of</strong> radical intermediate can not be the rate-determining<br />
step in the overall mechanism. This is in general<br />
agreement with the picture for autoxidation reactions<br />
(Helfferich, 2001).<br />
CONCLUSIONS<br />
Experiments performed in a reactor that was operated<br />
under industrial conditions have been successfully applied<br />
in the estimation <strong>of</strong> kinetic parameters in a model with<br />
inclusion <strong>of</strong> the description <strong>of</strong> mass transfer phenomena.<br />
Analyses <strong>of</strong> the mass transfer characteristics reveal that<br />
toluene oxidation under industrial conditions is a slow reaction<br />
with respect to mass transfer.<br />
Figure 11. Residuals between experimental and model values as function<br />
<strong>of</strong> the experimental observed oxygen concentration in the <strong>of</strong>f-gas;<br />
(W) ¼ benzyl alcohol; (A) ¼ benzaldehyde; (þ) ¼ benzoic acid.<br />
experimental error than the model version without the<br />
reflux mechanism. Tables 3 and 4 summarize results <strong>of</strong><br />
the estimated kinetic parameters. The values <strong>of</strong> the standard<br />
deviations as well as the correlation parameters are in<br />
acceptable limits for further scale-up purposes, but<br />
improvement is still desired. The residual sums are acceptable<br />
in comparison to the experimental values. This picture<br />
is confirmed by the graphs <strong>of</strong> the residual plots <strong>of</strong> the<br />
toluene conversion and the selectivity’s <strong>of</strong> benzyl alcohol,<br />
benzaldehyde and benzoic acid (Figures 5–8). The parity<br />
plot for oxygen exhibits a fair <strong>of</strong>f-set (Figure 9). This is<br />
caused by the low weighting value for oxygen which was<br />
based on the inaccuracy <strong>of</strong> the experimental value. The<br />
residuals are larger when the liquid residence time<br />
increases or when the oxygen concentration is higher.<br />
(There is no direct relation between liquid residence time<br />
and oxygen concentration because the gas flow rate is set<br />
independent <strong>of</strong> the liquid feed flow rate.) For the<br />
NOMENCLATURE<br />
a interfacial area per unit volume <strong>of</strong> dispersion, m 2 /m 3<br />
Al<br />
Hinterland ratio<br />
c concentration, kmol/m 3<br />
c A,b concentration <strong>of</strong> A in the liquid bulk, kmol/m 3<br />
c A,i concentration <strong>of</strong> A at the gas–liquid interface, kmol/m 3<br />
c O2,sat saturation concentration <strong>of</strong> oxygen, kmol/m 3<br />
c O2,out oxygen concentration in the gas outflow, kmol/m 3<br />
D diffusion coefficient, m 2 /s<br />
E<br />
enhancement factor<br />
F<br />
flow, kmol/s<br />
F GL<br />
flow across gas–liquid interface, kmol/s<br />
J flow across gas–liquid interface, kmol/m 2 /s<br />
k<br />
reaction rate constant (second order), m 3 /kmol/s<br />
k reaction rate constant (first order), s 21<br />
k fo reaction rate constant (pseudo first order), s 21<br />
k L<br />
liquid side mass transfer coefficient, m/s<br />
k L a<br />
volumetric liquid side mass transfer coefficient, l/s<br />
n<br />
reaction order<br />
p<br />
partial pressure, bar<br />
P tot<br />
total pressure (absolute), bar<br />
R reaction rate, kmol/m 3 /s<br />
V R dispersion volume (liquid þ gas), m 3<br />
w<br />
mole fraction in liquid, mol/mol<br />
x<br />
mole fraction in liquid, mol/mol<br />
Trans IChemE, Part A, Chemical Engineering Research and Design, 2005, 83(A2): 187–195
194 HOORN et al.<br />
x O2,sat<br />
y<br />
z<br />
oxygen mole fraction in liquid at saturation, mol/mol<br />
mole fraction in vapour, mol/mol<br />
mole fraction in vapour, mol/mol<br />
Greek symbols<br />
1 gas volume per unit volume dispersion, m 3 /m 3<br />
x<br />
conversion, mol/mol<br />
f<br />
fugacity coefficient<br />
f V volumetric flow, m 3 /s<br />
w<br />
Hatta number<br />
r mol,L liquid molar density, kmol/m 3<br />
s<br />
selectivity, mol/mol<br />
residence time, s<br />
t L<br />
Scott, E.J.Y., Chester, A.W., 1972, Kinetics <strong>of</strong> the cobaltcatalyzed<br />
autoxidation <strong>of</strong> toluene in acetic acid. J Phys Chem, 76:<br />
1520–1524.<br />
Shridhar, T., Potter, O.E., 1980, Interfacial areas in gas-liquid stirred<br />
vessels. Chem Eng Sci, 35: 683–695.<br />
Suresh, A.K., Sridhar, T., Potter, O.E., 1988, Autocatalytic oxidation<br />
<strong>of</strong> cyclohexane—mass transfer and chemical reaction. AIChE J, 34:<br />
81–93.<br />
Westerterp, K.R., van Swaaij, W.P.M., Beenackers, A.A.C.M., 1984,<br />
Chemical reactor design and operation, 371–377. (John Wiley &<br />
Sons, New York, USA).<br />
Wilke, C.R., Chang, P., 1955, Correlation <strong>of</strong> diffusion coefficients in dilute<br />
solutions. AIChE J, 1: 264–270.<br />
Sub/superscripts (see also Figure 4 for descriptions)<br />
i<br />
any component<br />
BALC benzyl alcohol<br />
BALD benzaldehyde<br />
BzA<br />
benzoic acid<br />
H2O<br />
water<br />
N2<br />
nitrogen<br />
O2<br />
oxygen<br />
TOL<br />
toluene<br />
F feed flow to Flash 1<br />
G gas vapour flow from Flash 2<br />
L liquid discharge flow from Flash 1<br />
V vapour flow from Flash 1 to Flash 2<br />
R liquid recycle flow from Flash 2 to Flash 1<br />
Abbreviations<br />
ACM<br />
SSO<br />
SSR<br />
Aspen Custom Modeler<br />
Sum <strong>of</strong> Squared Observations<br />
Sum <strong>of</strong> Squared Residuals<br />
REFERENCES<br />
Bateman, L., 1951, Olefin oxidation. Quart Revs (London), 8: 147–167.<br />
Bhattacharya, D., Guha, D.K., Roy, A.N., 1973, Liquid phase air oxidation<br />
<strong>of</strong> toluene to benzoic acid. II. Kinetics and mechanism. Chem Age India,<br />
24: 87–90.<br />
Borgaonkar, H.V., Raverkar, S.R., Chandalia, S.B., 1984, Liquid phase<br />
oxidation <strong>of</strong> toluene to benzaldehyde by air. Ind Eng Chem Prod Res<br />
Dev, 23: 455–458.<br />
Cao, G., Servida, A., Pisu, M., Morbidelli, M., 1994, Kinetics <strong>of</strong> p-xylene<br />
liquid-phase catalytic oxidation. AIChE J, 40: 1156–1166.<br />
Helfferich, F.G., 2001, Kinetics <strong>of</strong> homogeneous multistep reactions, in<br />
Compton, R.G. and Hancock, G. (eds). Comprehensive Chemical<br />
Kinetics, vol. 38, 283–286 (Elsevier, Amsterdam, The Netherlands).<br />
Hikita, H., Asai, S., 1964, Gas absorption with (m,n)-th order irreversible<br />
chemical reaction. Int Chem Eng, 4: 332–340.<br />
Keading, W.W., Lindblom, R.O., Temple, R.G., Mahon, H.I., 1965,<br />
Oxidation <strong>of</strong> toluene and other alkylated aromatic hydrocarbons to benzoic<br />
acids and phenols. Ind Eng Chem Process Des Dev, 4: 97–101.<br />
Kondratiev, V.N, 1969, The theory <strong>of</strong> kinetics, in Bamford, C.H. and<br />
Tipper, C.F.H. (eds). Comprehensive Chemical Kinetics, vol. 2,<br />
165–173 (Elsevier, Amsterdam, The Netherlands).<br />
Lozar, J., Falgayrac, G., Savall, A., 2001, Kinetics <strong>of</strong> the electrochemically<br />
assisted autoxidation <strong>of</strong> toluene in acetic acid. Ind Eng Chem Res, 40:<br />
6055–6062.<br />
Morimoto, T., Ogata, Y., 1967, Kinetics <strong>of</strong> the autoxidation <strong>of</strong> toluene<br />
catalyzed by cobaltic acetate. J Chem Soc (B), 62–66.<br />
Mulkay, P., Rouchaud, J., 1967, Solvatation des catalyseurs d’oxydation<br />
en phase liquide homogène. Bull Soc Chim Fr, 12: 4653–4657.<br />
Pohorecki, R., Baldyga, J., Moniuk, W., Podgórska, W., Zdrójkowski, A.,<br />
Wierzchowski, P.T., 2001, Kinetic model <strong>of</strong> cyclohexane oxidation.<br />
Chem Eng Sci, 56: 1285–1291.<br />
Quiroga, O.D., Gottifredi, J.C., Capretto de Castillo, M.E., 1980, Liquid<br />
phase catalytic toluene oxidation, formulation <strong>of</strong> a kinetic model.<br />
Lat Am J Chem Eng Appl Chem, 10: 77–88.<br />
Russell, G.A., 1957, Deuterium-isotope effects in the autoxidation <strong>of</strong><br />
aralkyl hydrocarbons. Mechanism <strong>of</strong> the interaction <strong>of</strong> peroxy radicals.<br />
J Am. Chem Soc, 79: 3871–3877.<br />
van’t Riet, K., 1979, Review <strong>of</strong> measuring methods and results in nonviscous<br />
gas-liquid mass transfer in stirred vessels. Ind Eng Chem Process<br />
Des Dev, 18: 357–364.<br />
The manuscript was received 2 June 2004 and accepted for publication<br />
after revision 13 December 2004.<br />
APPENDIX<br />
Overall pseudo first-order rate constant for oxygen<br />
k fo ¼ 3 2 k 12 c TOL þ 1 2 ð k 3 c BALD þ k 4 c BALC Þ<br />
Definition <strong>of</strong> Hatta number and mass transfer equations<br />
pffiffiffiffiffiffiffiffiffiffiffiffi<br />
k fo D<br />
w ¼<br />
k L<br />
F GL ¼ J V R a<br />
E ¼<br />
p ffiffiffiffiffiffiffiffiffiffiffiffiffi<br />
1 þ w 2 <br />
J ¼ k L c O2,sat<br />
c O2,sat<br />
c O2,sat<br />
c O2<br />
<br />
E<br />
(c O2 )=(1 þ w 2 ) <br />
c O2<br />
Reaction rate expressions (according to Figure 1)<br />
R 1 ¼ k 12 c TOL c O2<br />
R 2 ¼ k 12 c TOL c O2<br />
R 3 ¼ k 3 c BALD c O2<br />
R 4 ¼ k 4 c BALC c O2<br />
R BALC ¼ R 2 R 4<br />
R BALD ¼ R 1 R 3 þ R 4<br />
R BzA ¼ R 3<br />
R H2O ¼ R 1 þ R 4<br />
1<br />
R O2 ¼ R 1<br />
2 (R 2 þ R 3 þ R 4 )<br />
R TOL ¼ R 1 R 2<br />
Definition for toluene conversion<br />
x ¼ F F,TOL<br />
F L,TOL þ F G,TOL<br />
<br />
F F,TOL<br />
Definition for benzoic acid, benzaldehyde and benzyl<br />
alcohol selectivity<br />
F L,i þ F G,i<br />
s i ¼ P<br />
j F L,j þ P j F G,j<br />
Trans IChemE, Part A, Chemical Engineering Research and Design, 2005, 83(A2): 187–195
<strong>MODELLING</strong> <strong>TOLUENE</strong> <strong>OXIDATION</strong> 195<br />
Definition for <strong>of</strong>f-gas oxygen concentration<br />
F G,O2<br />
c O2,out ¼<br />
F G,N2 þ F G,O2<br />
Mole fractions and concentrations for all components<br />
c i ¼ r mol,L x i<br />
x i ¼<br />
F L,i<br />
P<br />
i F L,i<br />
y i ¼<br />
F G,i<br />
P<br />
i F G,i<br />
z i ¼<br />
F VAP,i<br />
P<br />
i F VAP,i<br />
w i ¼<br />
F REC,i<br />
P<br />
i F REC,i<br />
<strong>Mass</strong> balances for all components except oxygen for<br />
Flash 1 and Flash 2 (see Figure 4)<br />
f L,i x i ¼ f V,i z i<br />
f G,i y i ¼ f R,i w i<br />
F F,i þ F R,i þ V R i ¼ F L,i þ F V,i<br />
F V,i ¼ F G,i þ F R,i<br />
<strong>Mass</strong> balances for oxygen<br />
f L,O2 x O2,sat ¼ f V,O2 z O2<br />
f G,O2 y O2 ¼ f R,O2 w O2<br />
F F,O2 ¼ F GL,O2 þ F V,O2<br />
F GL,O2 þ F R,O2 þ V R R O2 ¼ F L,O2<br />
F V,O2 ¼ F G,O2 þ F R,O2<br />
Trans IChemE, Part A, Chemical Engineering Research and Design, 2005, 83(A2): 187–195