MODELLING TOLUENE OXIDATION Incorporation of Mass ... - ITM
MODELLING TOLUENE OXIDATION Incorporation of Mass ... - ITM
MODELLING TOLUENE OXIDATION Incorporation of Mass ... - ITM

Create successful ePaper yourself
Turn your PDF publications into a flip-book with our unique Google optimized e-Paper software.
190 HOORN et al.<br />
Table 1. Data from a series <strong>of</strong> standard experiments.<br />
Range <strong>of</strong> operation including<br />
all experiments<br />
Standard deviation<br />
in reference experiments<br />
Reactor temperature 8C 140–160 0.8%<br />
Reactor pressure bar 4–7 0.2%<br />
Off-gas inert flow Nl/h 100–300 1.1%<br />
Feed flow toluene kg/h 1–2 1.0%<br />
Feed flow air Nl/h 100–300 0.3%<br />
Flow liquid discharge kg/h 0.5–1.5 2.1%<br />
Flow condensate kg/h 0.5–1.5 2.3%<br />
Off-gas oxygen level vol% 0–6 32.5%<br />
Condensate Balc mol/h 0.0003–0.005 12.5%<br />
Bald mol/h 0.003–0.02 7.3%<br />
BzA mol/h 0–0.02 20.8%<br />
H 2 O mol/h 0.6–1.6 11.0%<br />
Tol mol/h 2.1–5.6 4.8%<br />
Liquid discharge Balc mol/h 0.003–0.05 3.9%<br />
Bald mol/h 0.03–0.2 1.8%<br />
BzA mol/h 0.4–1.1 3.3%<br />
Tol mol/h 1.5–10.9 1.5%<br />
area was taken as a constant at 300 m 2 /m 3 . Under the<br />
hypothesis that the reaction is fast, i.e., w . 2, the<br />
calculated rate constant [equation (13)] is 100 s 21<br />
(+56 s 21 , standard deviation for the experimental observations).<br />
The corresponding Hatta number on basis <strong>of</strong> this<br />
rate constant can then be estimated to be 0.60 + 0.16.<br />
This is not in line with the assumption <strong>of</strong> a fast reaction<br />
with w . 2. For the hypothesis <strong>of</strong> a slow reaction, i.e., w<br />
, 0.3, the calculated rate constant is 2.2 + 3.2 s 21<br />
giving a Hatta number <strong>of</strong> 0.079 + 0.048 which is in line<br />
with the assumption made for the Hatta number. Therefore,<br />
it is concluded that on basis <strong>of</strong> the experimental observations<br />
the reaction rate is slow in comparison to the<br />
mass transfer rate <strong>of</strong> oxygen.<br />
<strong>MODELLING</strong> OF THE EXPERIMENTAL REACTOR<br />
A model was constructed to determine the kinetic parameters<br />
under conditions <strong>of</strong> mass transfer limitations<br />
while taking into account partial condensation <strong>of</strong> the<br />
vapour phase. To include a description <strong>of</strong> the partial condensation<br />
between the reactor and the condenser the<br />
model comprised two flash calculations for the reactor<br />
part <strong>of</strong> the set-up. A scheme <strong>of</strong> the model is given in<br />
Figure 4. For an overview on the model equations see<br />
Appendix. The model calculations were performed in<br />
Aspen Custom Modeler. Thermodynamic properties for<br />
the liquid phase were calculated with Aspen Plus Properties.<br />
The pure component properties were taken from the<br />
DIPPR Handbook (http://dippr.byu.edu, American Institute<br />
<strong>of</strong> Chemical Engineers, access date 25 May 2004) or<br />
DDBST (http://www.ddbst.com). The interaction between<br />
components was described by the NRTL-model. The<br />
thermodynamic property files generated in Aspen Plus<br />
were included in the ACM file. The liquid from the<br />
second flash is totally refluxed to the first flash (‘liquid<br />
recycle’). The temperature <strong>of</strong> the second flash was varied<br />
for each experiment in such a way that the differences<br />
between experimental and model values for the gas and<br />
liquid mole flows <strong>of</strong> all components were minimized. The<br />
calculations to determine the temperatures <strong>of</strong> the second<br />
flash were performed with a simulated combined feed <strong>of</strong><br />
the liquid discharge and vapour flows. For experiments performed<br />
with the correct tracing, the temperature <strong>of</strong><br />
the second flash was fixed at the temperature <strong>of</strong> the first<br />
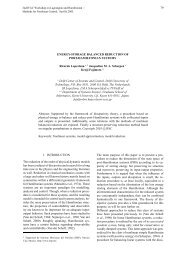
Figure 3. Observed conversion rates for oxygen as function <strong>of</strong> the oxygen<br />
concentration in the liquid at saturation.<br />
Figure 4. Schematic drawing <strong>of</strong> model. The symbols in this scheme are<br />
utilized in the overview <strong>of</strong> model equations.<br />
Trans IChemE, Part A, Chemical Engineering Research and Design, 2005, 83(A2): 187–195