Download the PDF file (1300 KB) - Esker
Download the PDF file (1300 KB) - Esker
Download the PDF file (1300 KB) - Esker

Create successful ePaper yourself
Turn your PDF publications into a flip-book with our unique Google optimized e-Paper software.
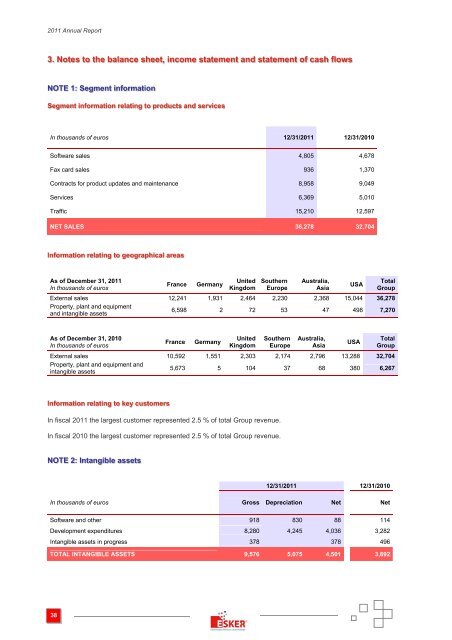
2011 Annual Report<br />
3. Notes to <strong>the</strong> balance sheet, income statement and statement of cash flows<br />
NOTE 1: Segment information<br />
Segment information relating to products and services<br />
In thousands of euros 12/31/2011 12/31/2010<br />
Software sales 4,805 4,678<br />
Fax card sales 936 1,370<br />
Contracts for product updates and maintenance 8,958 9,049<br />
Services 6,369 5,010<br />
Traffic 15,210 12,597<br />
NET SALES 36,278 32,704<br />
Information relating to geographical areas<br />
As of December 31, 2011<br />
In thousands of euros<br />
France<br />
Germany<br />
United<br />
Kingdom<br />
Sou<strong>the</strong>rn<br />
Europe<br />
Australia,<br />
Asia<br />
USA<br />
Total<br />
Group<br />
External sales 12,241 1,931 2,464 2,230 2,368 15,044 36,278<br />
Property, plant and equipment<br />
and intangible assets<br />
6,598 2 72 53 47 498 7,270<br />
As of December 31, 2010<br />
In thousands of euros<br />
France<br />
Germany<br />
United<br />
Kingdom<br />
Sou<strong>the</strong>rn<br />
Europe<br />
Australia,<br />
Asia<br />
USA<br />
Total<br />
Group<br />
External sales 10,592 1,551 2,303 2,174 2,796 13,288 32,704<br />
Property, plant and equipment and<br />
intangible assets<br />
5,673 5 104 37 68 380 6,267<br />
Information relating to key customers<br />
In fiscal 2011 <strong>the</strong> largest customer represented 2.5 % of total Group revenue.<br />
In fiscal 2010 <strong>the</strong> largest customer represented 2.5 % of total Group revenue.<br />
NOTE 2: Intangible assets<br />
12/31/2011 12/31/2010<br />
In thousands of euros Gross Depreciation Net Net<br />
Software and o<strong>the</strong>r 918 830 88 114<br />
Development expenditures 8,280 4,245 4,036 3,282<br />
Intangible assets in progress 378 378 496<br />
TOTAL INTANGIBLE ASSETS 9,576 5,075 4,501 3,892<br />
38