

annual-report-2014
annual-report-2014
annual-report-2014

Create successful ePaper yourself
Turn your PDF publications into a flip-book with our unique Google optimized e-Paper software.
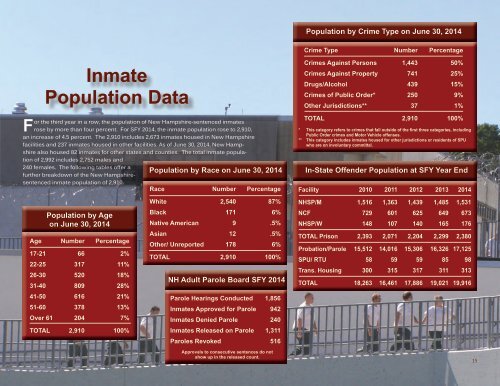
Population by Crime Type on June 30, <strong>2014</strong><br />
Crime Type Number Percentage<br />
F<br />
Inmate<br />
Population Data<br />
or the third year in a row, the population of New Hampshire-sentenced inmates<br />
rose by more than four percent. For SFY <strong>2014</strong>, the inmate population rose to 2,910,<br />
an increase of 4.5 percent. The 2,910 includes 2,673 inmates housed in New Hampshire<br />
facilities and 237 inmates housed in other facilities. As of June 30, <strong>2014</strong>, New Hampshire<br />
also housed 82 inmates for other states and counties. The total inmate population<br />
of 2,992 includes 2,752 males and<br />
240 females. The following tables offer a<br />
further breakdown of the New Hampshiresentenced<br />
inmate population of 2,910.<br />
Race Number Percentage<br />
Population by Age<br />
on June 30, <strong>2014</strong><br />
Age Number Percentage<br />
17-21 66 2%<br />
22-25 317 11%<br />
26-30 520 18%<br />
31-40 809 28%<br />
41-50 616 21%<br />
51-60 378 13%<br />
Over 61 204 7%<br />
TOTAL 2,910 100%<br />
Population by Race on June 30, <strong>2014</strong><br />
White 2,540 87%<br />
Black 171 6%<br />
Native American 9 .5%<br />
Asian 12 .5%<br />
Other/ Un<strong>report</strong>ed 178 6%<br />
TOTAL 2,910 100%<br />
NH Adult Parole Board SFY <strong>2014</strong><br />
Parole Hearings Conducted 1,856<br />
Inmates Approved for Parole 942<br />
Inmates Denied Parole 240<br />
Inmates Released on Parole 1,311<br />
Paroles Revoked 516<br />
Approvals to consecutive sentences do not<br />
show up in the released count.<br />
Crimes Against Persons 1,443 50%<br />
Crimes Against Property 741 25%<br />
Drugs/Alcohol 439 15%<br />
Crimes of Public Order* 250 9%<br />
Other Jurisdictions** 37 1%<br />
TOTAL 2,910 100%<br />
* This category refers to crimes that fall outside of the first three categories, including<br />
Public Order crimes and Motor Vehicle offenses.<br />
** This category includes inmates housed for other jurisdictions or residents of SPU<br />
who are on involuntary committal.<br />
In-State Offender Population at SFY Year End<br />
Facility 2010 2011 2012 2013 <strong>2014</strong><br />
NHSP/M 1,516 1,363 1,439 1,485 1,531<br />
NCF 729 601 625 649 673<br />
NHSP/W 148 107 140 165 176<br />
TOTAL Prison 2,393 2,071 2,204 2,299 2,380<br />
Probation/Parole 15,512 14,016 15,306 16,326 17,125<br />
SPU/ RTU 58 59 59 85 98<br />
Trans. Housing 300 315 317 311 313<br />
TOTAL 18,263 16,461 17,886 19,021 19,916<br />
15