Mangrove biodiversity survey south of the Onilahy River - Frontier ...
Mangrove biodiversity survey south of the Onilahy River - Frontier ...
Mangrove biodiversity survey south of the Onilahy River - Frontier ...

Create successful ePaper yourself
Turn your PDF publications into a flip-book with our unique Google optimized e-Paper software.
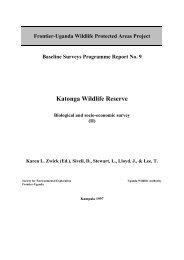
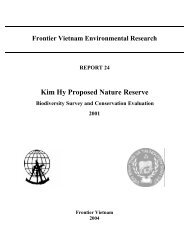
Density (m² per hectare)<br />
0.005<br />
0.004<br />
0.003<br />
0.002<br />
0.001<br />
0<br />
1 2 3 4 5 6 7 8 9 10 11 12 13 14 15 16 17 18<br />
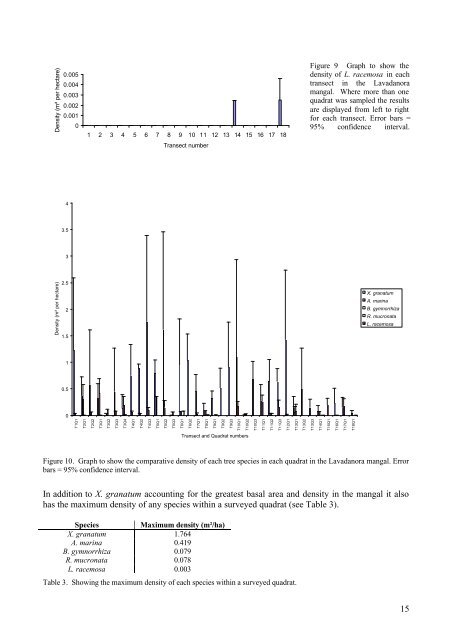
Figure 9 Graph to show <strong>the</strong><br />
density <strong>of</strong> L. racemosa in each<br />
transect in <strong>the</strong> Lavadanora<br />
mangal. Where more than one<br />
quadrat was sampled <strong>the</strong> results<br />
are displayed from left to right<br />
for each transect. Error bars =<br />
95% confidence interval.<br />
Transect number<br />
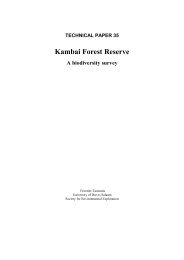
4<br />
3.5<br />
3<br />
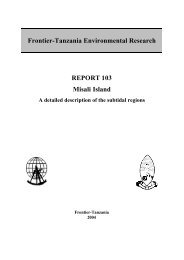
Density (m² per hectare)<br />
2.5<br />
2<br />
1.5<br />
X. granatum<br />
A. marina<br />
B. gymnorrhiza<br />
R. mucronata<br />
L. racemosa<br />
1<br />
0.5<br />
0<br />
T1Q1<br />
T2Q1<br />
T2Q2<br />
T3Q1<br />
T3Q2<br />
T3Q3<br />
T3Q4<br />
T4Q1<br />
T4Q2<br />
T4Q3<br />
T5Q1<br />
T5Q2<br />
T5Q3<br />
T6Q1<br />
T6Q2<br />
T7Q1<br />
T8Q1<br />
T9Q1<br />
T9Q2<br />
T9Q3<br />
T10Q1<br />
T10Q2<br />
T10Q3<br />
T11Q1<br />
T11Q2<br />
T11Q3<br />
T12Q1<br />
T13Q1<br />
T13Q2<br />
T13Q3<br />
T14Q1<br />
T15Q1<br />
T16Q1<br />
T17Q1<br />
T18Q1<br />
Transect and Quadrat numbers<br />
Figure 10. Graph to show <strong>the</strong> comparative density <strong>of</strong> each tree species in each quadrat in <strong>the</strong> Lavadanora mangal. Error<br />
bars = 95% confidence interval.<br />
In addition to X. granatum accounting for <strong>the</strong> greatest basal area and density in <strong>the</strong> mangal it also<br />
has <strong>the</strong> maximum density <strong>of</strong> any species within a <strong>survey</strong>ed quadrat (see Table 3).<br />
Species<br />
Maximum density (m²/ha)<br />
X. granatum 1.764<br />
A. marina 0.419<br />
B. gymnorrhiza 0.079<br />
R. mucronata 0.078<br />
L. racemosa 0.003<br />
Table 3. Showing <strong>the</strong> maximum density <strong>of</strong> each species within a <strong>survey</strong>ed quadrat.<br />
15