Mangrove biodiversity survey south of the Onilahy River - Frontier ...
Mangrove biodiversity survey south of the Onilahy River - Frontier ...
Mangrove biodiversity survey south of the Onilahy River - Frontier ...
You also want an ePaper? Increase the reach of your titles
YUMPU automatically turns print PDFs into web optimized ePapers that Google loves.
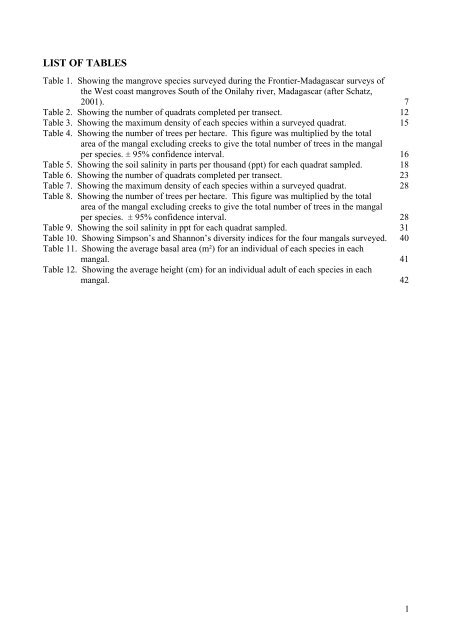
LIST OF TABLES<br />
Table 1. Showing <strong>the</strong> mangrove species <strong>survey</strong>ed during <strong>the</strong> <strong>Frontier</strong>-Madagascar <strong>survey</strong>s <strong>of</strong><br />
<strong>the</strong> West coast mangroves South <strong>of</strong> <strong>the</strong> <strong>Onilahy</strong> river, Madagascar (after Schatz,<br />
2001). 7<br />
Table 2. Showing <strong>the</strong> number <strong>of</strong> quadrats completed per transect. 12<br />
Table 3. Showing <strong>the</strong> maximum density <strong>of</strong> each species within a <strong>survey</strong>ed quadrat. 15<br />
Table 4. Showing <strong>the</strong> number <strong>of</strong> trees per hectare. This figure was multiplied by <strong>the</strong> total<br />
area <strong>of</strong> <strong>the</strong> mangal excluding creeks to give <strong>the</strong> total number <strong>of</strong> trees in <strong>the</strong> mangal<br />
per species. ± 95% confidence interval. 16<br />
Table 5. Showing <strong>the</strong> soil salinity in parts per thousand (ppt) for each quadrat sampled. 18<br />
Table 6. Showing <strong>the</strong> number <strong>of</strong> quadrats completed per transect. 23<br />
Table 7. Showing <strong>the</strong> maximum density <strong>of</strong> each species within a <strong>survey</strong>ed quadrat. 28<br />
Table 8. Showing <strong>the</strong> number <strong>of</strong> trees per hectare. This figure was multiplied by <strong>the</strong> total<br />
area <strong>of</strong> <strong>the</strong> mangal excluding creeks to give <strong>the</strong> total number <strong>of</strong> trees in <strong>the</strong> mangal<br />
per species. ± 95% confidence interval. 28<br />
Table 9. Showing <strong>the</strong> soil salinity in ppt for each quadrat sampled. 31<br />
Table 10. Showing Simpson’s and Shannon’s diversity indices for <strong>the</strong> four mangals <strong>survey</strong>ed. 40<br />
Table 11. Showing <strong>the</strong> average basal area (m²) for an individual <strong>of</strong> each species in each<br />
mangal. 41<br />
Table 12. Showing <strong>the</strong> average height (cm) for an individual adult <strong>of</strong> each species in each<br />
mangal. 42<br />
1


