TPF-I SWG Report - Exoplanet Exploration Program - NASA
TPF-I SWG Report - Exoplanet Exploration Program - NASA
TPF-I SWG Report - Exoplanet Exploration Program - NASA

Create successful ePaper yourself
Turn your PDF publications into a flip-book with our unique Google optimized e-Paper software.
JPL Publication 07-1<br />
Terrestrial Planet Finder Interferometer<br />
Science Working Group <strong>Report</strong><br />
Edited by:<br />
P. R. Lawson, O. P. Lay, K. J. Johnston, and C. A. Beichman<br />
Jet Propulsion Laboratory<br />
California Institute of Technology<br />
Pasadena, California<br />
National Aeronautics and<br />
Space Administration<br />
Jet Propulsion Laboratory<br />
California Institute of Technology<br />
Pasadena, California<br />
1 March 2007
This research was carried out at the Jet Propulsion Laboratory, California Institute of Technology, under a<br />
contract with the National Aeronautics and Space Administration.<br />
Reference herein to any specific commercial product, process, or service by trade name, trademark,<br />
manufacturer, or otherwise, does not constitute or imply its endorsement by the United States Government<br />
or the Jet Propulsion Laboratory, California Institute of Technology.<br />
ii
Abstract<br />
Over the past two years, the focus of the project for the interferometric version of the Terrestrial Planet<br />
Finder (<strong>TPF</strong>-I) has been on the development of the scientific rational for the mission, the assessment of<br />
<strong>TPF</strong>-I architectures, the laboratory demonstration of key technologies, and the development of a detailed<br />
technology roadmap. The Science Working Group (<strong>SWG</strong>), in conjunction with European colleagues<br />
working on the European Space Agency’s (ESA’s) Darwin project, has reaffirmed the goals of <strong>TPF</strong>-I as<br />
part of a broad vision for the detection and characterization of Earth-like planets orbiting nearby stars and<br />
for the search for life on those planets. The <strong>SWG</strong> also helped to assess the performance of different<br />
interferometric configurations for <strong>TPF</strong>-I/Darwin. Building on earlier <strong>SWG</strong> reports, this document restates<br />
the scientific case for <strong>TPF</strong>-I, assesses suitable target stars and relevant wavelengths for observation,<br />
discusses dramatic new capabilities for general astrophysical observations, and summarizes how Spitzer<br />
has improved our knowledge of the incidence of zodiacal emission on the search for planets. This<br />
document discusses in some detail on laboratory advances in interferometric nulling and formation flying.<br />
Laboratory experiments have now achieved stable narrow- and broad-band nulling the levels of 10 -6 and<br />
2.0×10 -5 , respectively. A testbed has demonstrated formation flying using two realistic spacecraft<br />
mockups. With a suitably funded program of technology development, as summarized herein and<br />
described in more detail in the Technology Plan for the Terrestrial Planet Finder Interferometer (2005),<br />
the National Aeronautics and Space Administration (<strong>NASA</strong>) and ESA would be able to start within the<br />
coming decade a full-scale <strong>TPF</strong>-I/Darwin mission capable of finding Earths orbiting more than 150<br />
nearby stars, or a scaled back interferometer capable of studying more than 30 stars. Finding evidence for<br />
life on just one of those planets would revolutionize our understanding of our place in the cosmos.<br />
iii
Approvals<br />
Prepared by:<br />
___________________ ______<br />
Approved by:<br />
<strong>NASA</strong>/JPL<br />
___________________ ______<br />
Peter R. Lawson<br />
<strong>TPF</strong>-I Systems Manager,<br />
Terrestrial Planet Finder<br />
date<br />
Daniel R. Coulter date<br />
Project Manager,<br />
Terrestrial Planet Finder<br />
Approved by:<br />
<strong>TPF</strong>-I <strong>SWG</strong><br />
___________________ ______<br />
Approved by:<br />
<strong>NASA</strong>/JPL<br />
___________________ ______<br />
Kenneth Johnston<br />
<strong>TPF</strong>-I <strong>SWG</strong> Co-Chair,<br />
US Naval Observatory<br />
date<br />
Wesley A. Traub<br />
Chief Scientist,<br />
Navigator <strong>Program</strong><br />
date<br />
Approved by:<br />
<strong>TPF</strong>-I <strong>SWG</strong><br />
___________________ ______<br />
Approved by:<br />
<strong>NASA</strong>/JPL<br />
___________________ ______<br />
Charles Beichman date<br />
<strong>TPF</strong>-I <strong>SWG</strong> Co-Chair,<br />
California Institute of Technology<br />
Michael Devirian<br />
Manager,<br />
Navigator <strong>Program</strong><br />
date<br />
v
Acknowledgements<br />
Twenty-two representatives from the astronomical community and one ex officio member were named to<br />
the <strong>TPF</strong>-Interferometer Science Working Group (<strong>TPF</strong>-I <strong>SWG</strong>). They work closely with the <strong>TPF</strong> project to<br />
develop the science rationale for the mid-IR observing program, to help guide the appropriate technology,<br />
and to interface with their counterparts on the European Space Agency's Terrestrial <strong>Exoplanet</strong> Science<br />
Advisory Team and Darwin project. As representatives of the broad astronomical community, the <strong>TPF</strong>-I<br />
<strong>SWG</strong> acts as the science conscience of the project, ensuring that the broad <strong>TPF</strong>-I science goals are worthy<br />
of the mission and that the mission will be able to fulfill them. Specific tasks of the <strong>TPF</strong>-I <strong>SWG</strong> includes,<br />
but are not limited to:<br />
1. Refining, as necessary, <strong>TPF</strong>-I science goals as embodied in the Design Reference Mission and<br />
assessing the impact of altering mission design parameters (orbit, mission duration, telescope size,<br />
instrument complement, etc.) on these science goals.<br />
2. Assessing design concepts, technology, and implementation plans relative to the overall scientific<br />
performance of the mission.<br />
3. Assisting <strong>NASA</strong> in explaining the goals of <strong>TPF</strong>-I to the larger astronomy community and in<br />
preparing materials for review by external scientific advisory groups and oversight committees.<br />
4. Producing a Science Requirements Document. This document will include the prioritized science<br />
objectives and requirements for the planet finding and characterization and general astrophysics<br />
aspects of the <strong>TPF</strong>-I mission.<br />
The duration of the appointments of each <strong>TPF</strong>-I <strong>SWG</strong> member is approximately 3 years.<br />
The Terrestrial Planet Finder Interferometer Science Working Group <strong>Report</strong> has been assembled with the<br />
efforts of many individuals. In addition to the members of the <strong>TPF</strong>-I <strong>SWG</strong> listed in Table 1, the editors<br />
are pleased to acknowledge contributions by Stefan Martin, Robert Peters, Robert Gappinger, Alexander<br />
Ksendzov, Kent Wallace, Rosemary Diaz, Kurt Liewer, Frank Loya, Marty Marcin, Andrew Booth, Gary<br />
Blackwood, Eric Bloemhof, Dan Coulter, Jim DeCino, Serge Dubovitsky, Philip Dumont, Andy Eatchel,<br />
Nick Elias, Steven Gunter, Curt Henry, Louise Hamlin, Ron Holm, Mike Lieber, Chris Lindensmith,<br />
Martin Lo, Ken Marsh, David Miller, Chia-Yen Peng, Ben Platt, George Purcell, Robert Smythe, Jeff<br />
Tien, John Treichler, Velu Velusamy, Brent Ware, and Matthew Wette. The editors are also most grateful<br />
for the assistance of Roger Carlson at JPL Publications.<br />
vii
Table 1. Members of the <strong>TPF</strong>-I Science Working Group (2005–2008)<br />
Name<br />
Akeson, Rachel<br />
Bally, John<br />
Beichman, Charles (ex officio)<br />
Crisp, David<br />
Danchi, William<br />
Falkowski, Paul<br />
Fridlund, Malcolm<br />
Hinz, Phil<br />
Hollis, Jan M. (Mike)<br />
Hyland, David<br />
Johnston, Kenneth (chair)<br />
Lane, Ben<br />
Laughlin, Gregory<br />
Liseau, Rene<br />
Mennesson, Bertrand<br />
Monnier, John<br />
Noecker, Charley<br />
Quillen, Alice<br />
Röttgering, Huub<br />
Serabyn, Gene<br />
Wilner, David<br />
Woolf, Nick<br />
Institution<br />
Michelson Science Center, California Institute of<br />
Technology (CalTech)<br />
University of Colorado<br />
Michelson Science Center, CalTech<br />
Jet Propulsion Laboratory<br />
Goddard Space Flight Center (GSFC)<br />
Rutgers University<br />
ESA/ESTEC<br />
University of Arizona<br />
GSFC<br />
Texas A&M University<br />
US Naval Observatory<br />
Massachusetts Institute of Technology (MIT)<br />
UC Santa Cruz<br />
Stockholm Observatory, Sweden<br />
Jet Propulsion Laboratory<br />
University of Michigan<br />
Ball Aerospace<br />
University of Rochester<br />
Leiden University, Netherlands<br />
Jet Propulsion Laboratory<br />
Harvard-Smithsonian Center for Astrophysics<br />
University of Arizona<br />
viii
Table of Contents<br />
1 Introduction.........................................................................................................1<br />
1.1 Purpose and Scope ........................................................................................................................... 2<br />
1.2 Science Objectives........................................................................................................................... 4<br />
1.3 Development of the Interferometer Architecture............................................................................. 4<br />
1.4 References........................................................................................................................................ 7<br />
2 <strong>Exoplanet</strong> Science ...............................................................................................9<br />
2.1 Science Requirements...................................................................................................................... 9<br />
2.1.1 Planetary Detection and Characterization.......................................................................... 9<br />
2.1.2 Observing Modes............................................................................................................. 13<br />
2.1.3 Mission Summary............................................................................................................ 14<br />
2.2 Wavelength Coverage.................................................................................................................... 14<br />
2.3 Physical Characterization............................................................................................................... 15<br />
2.3.1 Temperature, Radius, and Albedo ................................................................................... 15<br />
2.3.2 Orbital Flux Variation...................................................................................................... 16<br />
2.4 Biomarkers..................................................................................................................................... 17<br />
2.4.1 Biomarker Signatures in the Mid Infrared....................................................................... 18<br />
2.4.2 Resolution Needed........................................................................................................... 20<br />
2.4.3 Planets Around Different Stars........................................................................................ 20<br />
2.4.4 Detection of Water........................................................................................................... 21<br />
2.4.5 Biomarkers and Their Evolution over Geological Timescales ........................................ 23<br />
2.5 Suitable Targets ............................................................................................................................. 23<br />
2.5.1 Science Criteria................................................................................................................23<br />
2.5.2 Engineering Criteria......................................................................................................... 24<br />
2.6 Exozodiacal Dust ........................................................................................................................... 25<br />
2.6.1 Zodiacal Dust as a Constituent of Planetary Systems...................................................... 25<br />
2.6.2 Zodiacal Emission as a Source of Noise.......................................................................... 26<br />
2.6.3 Summary of Current Observational Results on EZ Disks ............................................... 30<br />
2.6.4 Theoretical Implications of Current Observations........................................................... 31<br />
ix
2.6.5 Prospects for Future Observations................................................................................... 32<br />
2.7 References...................................................................................................................................... 33<br />
2.7.1 Science Requirements...................................................................................................... 33<br />
2.7.2 Physical Characterization ................................................................................................ 33<br />
2.7.3 Biomarkers....................................................................................................................... 33<br />
2.7.4 Suitable Targets ............................................................................................................... 36<br />
2.7.5 Exozodiacal Dust ............................................................................................................. 36<br />
3 Transforming Astrophysics with <strong>TPF</strong>-I .........................................................39<br />
3.1 Introduction.................................................................................................................................... 39<br />
3.1.1 Darwin/<strong>TPF</strong>-I Properties.................................................................................................. 40<br />
3.1.2 Diagnostics in the <strong>TPF</strong>-I/Darwin Bands.......................................................................... 40<br />
3.2 Transformational Astrophysics...................................................................................................... 42<br />
3.2.1 Star and Planet Formation and Early Evolution .............................................................. 42<br />
3.2.2 Stellar and Planetary Death and Cosmic Recycling ........................................................ 46<br />
3.2.3 Formation, Evolution, and Growth of Black Holes ......................................................... 48<br />
3.2.4 Galaxy Formation and Evolution..................................................................................... 50<br />
3.2.5 Other Science Opportunities............................................................................................ 53<br />
3.3 Conclusions.................................................................................................................................... 54<br />
3.4 References...................................................................................................................................... 54<br />
4 Design and Architecture Trade Studies..........................................................59<br />
4.1 Principle of Operation.................................................................................................................... 59<br />
4.2 Performance Models ...................................................................................................................... 64<br />
4.2.1 Interferometer Performance Model ................................................................................. 64<br />
4.2.2 Star Count Model............................................................................................................. 67<br />
4.3 Nulling Configurations .................................................................................................................. 69<br />
4.4 Collector Aperture Diameter and Array Size................................................................................. 70<br />
4.5 Planar vs. Nonplanar...................................................................................................................... 71<br />
4.6 Beam Combiner Design................................................................................................................. 73<br />
4.6.1 Co-axial Combiners for a Formation-Flying Interferometer ........................................... 74<br />
4.6.2 Multi-Axial Beam Combiners ......................................................................................... 76<br />
4.7 Stray Light ..................................................................................................................................... 77<br />
4.8 Instability Noise and Mitigation .................................................................................................... 78<br />
4.8.1 Origin of Instability Noise ............................................................................................... 78<br />
4.8.2 Stretched X-Array and Spectral Filtering ........................................................................ 80<br />
x
4.8.3 Post-Nulling Calibration.................................................................................................. 83<br />
4.9 Imaging Properties......................................................................................................................... 85<br />
4.9.1 Separating Multiple Planets............................................................................................. 86<br />
4.9.2 Point-Spread Function ..................................................................................................... 87<br />
4.9.3 Array Size Criterion......................................................................................................... 87<br />
4.9.4 Deconvolution Approaches.............................................................................................. 87<br />
4.9.5 Trade Study...................................................................................................................... 90<br />
4.10 Structurally Connected Interferometer...........................................................................................92<br />
4.10.1 Baseline design ................................................................................................................ 92<br />
4.10.2 Performance Assessment ................................................................................................. 93<br />
4.10.3 Summary.......................................................................................................................... 95<br />
4.11 References...................................................................................................................................... 96<br />
5 <strong>TPF</strong>-I Flight Baseline Design...........................................................................99<br />
5.1 Introduction.................................................................................................................................... 99<br />
5.2 Array Geometry ............................................................................................................................. 99<br />
5.3 Optical Beam Train...................................................................................................................... 101<br />
5.3.1 Collector Spacecraft....................................................................................................... 101<br />
5.3.2 Combiner Spacecraft ..................................................................................................... 102<br />
5.3.3 Telescope Assembly ...................................................................................................... 103<br />
5.3.4 Beam Train Optics......................................................................................................... 103<br />
5.3.5 Beam Transfer between Spacecraft ............................................................................... 104<br />
5.3.6 Stray-Light Modeling .................................................................................................... 104<br />
5.3.7 Combiner Spacecraft ..................................................................................................... 104<br />
5.3.8 Beam Conditioning........................................................................................................ 105<br />
5.3.9 The Adaptive Nuller ...................................................................................................... 105<br />
5.3.10 Delay Lines.................................................................................................................... 105<br />
5.3.11 Alignment System ......................................................................................................... 105<br />
5.3.12 Simplified Nuller ........................................................................................................... 106<br />
5.3.13 Science Detector and Fringe Tracking........................................................................... 107<br />
5.4 Control System ............................................................................................................................ 107<br />
5.4.1 System Summary ........................................................................................................... 108<br />
5.4.2 Optical Metrology.......................................................................................................... 110<br />
5.4.3 Pointing Metrology........................................................................................................ 110<br />
5.4.4 Shear Metrology ............................................................................................................ 112<br />
5.4.5 Polarization Rotation ..................................................................................................... 112<br />
xi
5.4.6 OPD Metrology ............................................................................................................. 113<br />
5.5 Optomechanical Layout............................................................................................................... 113<br />
5.5.1 Beamcombiner spacecraft.............................................................................................. 113<br />
5.6 Spacecraft Design ........................................................................................................................ 114<br />
5.6.1 Thermal Modeling ......................................................................................................... 115<br />
5.6.2 Structural Modeling ....................................................................................................... 115<br />
5.7 Mission Description..................................................................................................................... 116<br />
5.8 Performance of Flight Baseline Design ....................................................................................... 117<br />
5.8.1 Inner and Outer Working Angles................................................................................... 117<br />
5.8.2 Stars Surveyed ............................................................................................................... 119<br />
5.8.3 Spectroscopy.................................................................................................................. 121<br />
5.8.4 Angular Resolution and Imaging................................................................................... 124<br />
5.8.5 Optimized <strong>Program</strong> Completeness ................................................................................ 126<br />
5.9 References.................................................................................................................................... 129<br />
6 Technology Roadmap for <strong>TPF</strong>-I ...................................................................131<br />
6.1 Technology Gates ........................................................................................................................ 131<br />
6.1.1 Optics and Starlight Suppression Gates......................................................................... 131<br />
6.1.2 Formation Flying Gates ................................................................................................. 132<br />
6.1.3 Cryogenic Technology Gate .......................................................................................... 133<br />
6.1.4 Integrated Modeling Gate .............................................................................................. 133<br />
6.2 Nulling Interferometry................................................................................................................. 133<br />
6.2.1 State of the Art in Nulling Interferometry ..................................................................... 133<br />
6.2.2 Achromatic Nulling Testbed (ANT).............................................................................. 135<br />
6.2.3 Planet Detection Testbed (PDT) .................................................................................... 136<br />
6.2.4 Adaptive Nuller Testbed (AdN) .................................................................................... 138<br />
6.2.5 Mid-Infrared Single-Mode Spatial Filters ..................................................................... 139<br />
6.3 Formation Flying ......................................................................................................................... 139<br />
6.3.1 Formation-Flying Requirements.................................................................................... 139<br />
6.3.2 Formation Algorithms and Simulation Testbed (FAST) ............................................... 143<br />
6.3.3 Formation Control Testbed (FCT)................................................................................. 145<br />
6.4 Future Hardware for General Astrophysics ................................................................................. 149<br />
6.4.1 Off-Axis Phase Referencing .......................................................................................... 150<br />
6.4.2 Wavelength Coverage.................................................................................................... 150<br />
6.4.3 Spectral Resolution........................................................................................................ 151<br />
6.4.4 Beam Combination and Field-of-View (FOV).............................................................. 151<br />
xii
6.4.5 Double Fourier Interferometry....................................................................................... 152<br />
6.5 Bibliography ................................................................................................................................ 154<br />
6.5.1 References for Figure 6-1 .............................................................................................. 154<br />
6.5.2 Achromatic Nulling Testbed.......................................................................................... 156<br />
6.5.3 Planet Detection Testbed ............................................................................................... 156<br />
6.5.4 Adaptive Nuller Testbed................................................................................................ 156<br />
6.5.5 Mid-Infrared Single Mode Spatial Filters...................................................................... 157<br />
6.5.6 Future Hardware for General Astrophysics ................................................................... 157<br />
7 Preparatory Science for <strong>TPF</strong>-I ......................................................................159<br />
7.1 Pre-Phase A.................................................................................................................................. 159<br />
7.1.1 Priority 1: Exozodiacal Dust......................................................................................... 159<br />
7.1.2 Priority 2: Frequency of Terrestrial Planets.................................................................. 160<br />
7.1.3 Priority 3: Target Stars.................................................................................................. 160<br />
7.1.4 Priority 4: Signs of Life ................................................................................................. 161<br />
7.2 Phase A ........................................................................................................................................ 162<br />
7.2.1 Priority 1: Frequency of Terrestrial Planets................................................................... 162<br />
7.2.2 Priority 2: Target Stars................................................................................................... 162<br />
7.2.3 Priority 3: Signs of Life ................................................................................................. 163<br />
7.2.4 Priority 4: Exozodiacal Dust.......................................................................................... 163<br />
7.3 Phases B and C/D ........................................................................................................................ 163<br />
8 Discussion and Conclusions ...........................................................................165<br />
Appendices............................................................................................................167<br />
Appendix A Technology Advisory Committee ...............................................169<br />
Appendix B Flight System Configuration.......................................................171<br />
Appendix C Formation-Flying Algorithm Development...............................175<br />
Formation Flying Control Architecture ............................................................................................... 175<br />
Formation and Attitude Control System (FACS) Algorithms ............................................................. 176<br />
FAST – Distributed Real-Time Simulation ......................................................................................... 183<br />
References............................................................................................................................................ 188<br />
Appendix D Acronyms ......................................................................................189<br />
Appendix E <strong>TPF</strong>-I Review Papers...................................................................194<br />
Appendix F Contributors and Credits............................................................195<br />
xiii
xiv
I NTRODUCTION<br />
1 Introduction<br />
Over 200 planets with masses ranging from the deuterium-burning limit of 13 Jupiter masses (M Jup ) down<br />
to 5.5 Earth masses (M ⊕ ) have been detected through changes in the radial velocity or position of host<br />
stars, or through changes in the brightness of host stars due to transits or microlensing. These planets are<br />
found in orbits ranging from inside 0.05 astronomical units (AU) out to 5 AU with a wide range of orbital<br />
eccentricities. The physical characterization of a few of these planets has already begun with the detection<br />
at infrared wavelengths by the Spitzer Space Telescope of the secondary transits of three “Hot Jupiters”<br />
and the monitoring of the light curve of the “Hot Jupiter” companion of υ Andromedae (Figure 1-1).<br />
These results constrain the temperature, radius, and albedo of the planets and enable the study of the<br />
rotation and weather on distant planets.<br />
But much more is possible beyond these initial measurements. The interferometric version of the<br />
Terrestrial Planet Finder (<strong>TPF</strong>-I) described in this report (Figure 1-2) will extend this measurement<br />
capability by many orders of magnitude, enabling the study of terrestrial planets in the Habitable Zone<br />
(1 AU from a G2V star) as well as to gas or icy giant planets out to 5 AU. <strong>TPF</strong>-I is currently envisioned<br />
Figure 1-1. The Spitzer telescope has detected thermal emission throughout the entire 4-day period of the ‘’Hot<br />
Jupiter’’ companion to the star Upsilon And (Harrington et al. 2006). The solid curve shows a model of a tidally<br />
locked planet with a sub-solar point that is considerably hotter than the backside due to relatively poor global<br />
circulation of winds. The <strong>TPF</strong> interferometer will extend these observations to Earth-sized planets in the habitable<br />
zone of nearby stars.<br />
1
C HAPTER 1<br />
Figure 1-2. Artist's Impression of the Terrestrial Planet Finder Interferometer<br />
as a cryogenic nulling interferometer consisting of four 3.5-m telescopes deployed on separate spacecraft<br />
with baselines in excess of 100 m (Figure 1-2). With <strong>TPF</strong>-I astronomers will be capable of characterizing<br />
planets and their atmospheres with the goal of identifying habitable or life-bearing planets around more<br />
that 150 nearby stars.<br />
Ultimately, the detection and characterization of Earth-like planets and the search for life will require<br />
coordinated observations at optical and infrared wavelengths as well as dynamical measurements to<br />
determine planetary mass. Table 1-1 summarizes the measurements enabled by different planet-finding<br />
missions and how the mid-infrared observations of the interferometric version of the Terrestrial Planet<br />
Finder (<strong>TPF</strong>-I) fit into a broad vision of exo-planetology. Accomplishing the complete characterization of<br />
nearby planets is the unifying goal of <strong>TPF</strong>-I (which is being studied jointly with the <strong>TPF</strong>-I project by<br />
<strong>NASA</strong> and the Darwin project by the European Space Agency) and its sibling missions, the visible light<br />
coronagraph <strong>TPF</strong>-C and the astrometric mission Space Interferometry Mission (SIM)/Planetquest.<br />
1.1 Purpose and Scope<br />
This document is a collaborative effort between the <strong>TPF</strong>-I Science Working Group (<strong>SWG</strong>) and the <strong>TPF</strong>-I<br />
Project. Although the charter of the <strong>SWG</strong> was to advise <strong>NASA</strong> on science requirements and priorities,<br />
their advice also greatly influenced technical research within the project — in particular the project’s<br />
ongoing reassessment of the interferometer architecture and the flow-down of science requirements to<br />
technical objectives. The science requirements and objectives are described by the <strong>SWG</strong> in the opening<br />
Chapters on <strong>Exoplanet</strong> Science (Chapter 2) and Transforming Astrophysics with <strong>TPF</strong>-I (Chapter 3). This<br />
work builds on earlier <strong>SWG</strong> reports (ExNPS 1996; Beichman et al. 1999; Beichman et al. 2002; Lawson<br />
2
I NTRODUCTION<br />
et al. 2004), and restates the scientific case for <strong>TPF</strong>-I, assesses suitable target stars and relevant<br />
wavelengths for observation, and summarizes recent results on the zodiacal emission that can impact<br />
detection of planets. The compelling general astrophysics that will be possible with <strong>TPF</strong>-I is described in<br />
Chapter 3; the balance between increased astrophysics capability and increased cost will be addressed at a<br />
later phase in the project. Through the stated science requirements and technical interchange meetings,<br />
the <strong>SWG</strong> was also influential in determining the architecture of the interferometer, described in detail in<br />
Chapter 4. The results of an extensive investigation of different architectures and the sources of<br />
systematic noise sources are presented and discussed. Chapter 4 also describes the baseline X-array<br />
architecture selected for detailed study as well as describing briefly a structurally connected option with<br />
limited capability.<br />
The two subsequent chapters of this document consist primarily of contributions by <strong>TPF</strong>-I project<br />
members and provide a current view of progress with interferometer design studies (Chapter 5) and<br />
laboratory demonstrations of nulling interferometry and formation flying (Chapter 6). Included here are<br />
sections summarizing progress in critical testbed activities undertaken by the <strong>TPF</strong>-I project and reported<br />
on at various <strong>TPF</strong>-I Science Working Group meetings. Laboratory nulling has reached a broad-band level<br />
approaching 10 -5 that is arguably within a factor of 2 needed for the <strong>TPF</strong>-I flight system. Chapter 6 also<br />
presents a summary of a technology roadmap developed by the <strong>TPF</strong>-I project<br />
The concluding chapters resume with recommendations by the <strong>SWG</strong> for future studies. Chapter 7<br />
includes a prioritized list of future scientific investigations, and Chapter 8 discusses the potential for<br />
international collaboration on <strong>TPF</strong>-I/Darwin in the context of concluding remarks.<br />
Table 1-1. Synergy of Missions in the Navigator <strong>Program</strong><br />
Parameter SIM <strong>TPF</strong>-C <strong>TPF</strong>-I<br />
Orbital Parameters<br />
Stable orbit in habitable zone Measurement Measurement Measurement<br />
Characteristics for Habitability<br />
Planet temperature Estimate Estimate Measurement<br />
Temperature variability due to<br />
Measurement Measurement Measurement<br />
eccentricity<br />
Planet radius Cooperative Cooperative Measurement<br />
Planet albedo Cooperative Cooperative Cooperative<br />
Planet mass Measurement Estimate Estimate<br />
Surface gravity Cooperative Cooperative Cooperative<br />
Atmospheric and surface<br />
Cooperative Measurement Measurement<br />
composition<br />
Time-variability of composition Measurement Measurement<br />
Presence of water Measurement Measurement<br />
Solar System Characteristics<br />
Influence of other planets,<br />
orbit co-planarity<br />
Measurement Estimate Estimate<br />
Comets, asteroids, and zodiacal dust Measurement Measurement<br />
Indicators of Life<br />
Atmospheric biomarkers Measurement Measurement<br />
Surface biosignatures, e.g. red edge<br />
Measurement<br />
of vegetation<br />
``Measurement'' indicates a directly measured quantity from a mission; ``Estimate'' indicates that a quantity<br />
that can be estimated from a single mission; and ``Cooperative'' indicates a quantity that is best determined<br />
cooperatively using data from several missions. (Beichman et al. 2006)<br />
3
C HAPTER 1<br />
1.2 Science Objectives<br />
The major scientific objectives of <strong>TPF</strong>-I are: (1) search for and detect any Earth-like planets in the<br />
habitable zone around nearby stars; (2) carry out a study of gas giants and icy planets, as well as terrestrial<br />
planets within the 5 AU of nearby stars (at a nominal distance of 10 parsecs (pc) from the Sun) within the<br />
field-of-view of a 10-μm interferometer; (3) characterize Earth-like planets and their atmospheres, assess<br />
habitability, and search for signatures of life; (4) carry out a program of comparative planetology; and (5)<br />
enable a program of “revolutionary” general astrophysics. A mission lifetime of 5 years, possibly<br />
extended to 10 years, is foreseen.<br />
The core scientific goal of <strong>TPF</strong>-I is to detect directly and characterize Earth-like planets around nearby<br />
stars. The requirements that flow down from this goal define the characteristics of the observatory design<br />
and the mission. In particular, the ability to directly detect planets implies that <strong>TPF</strong>-I must be capable of<br />
separating the planet light from the starlight. Moreover, the facility must provide a sensitivity that will<br />
enable spectroscopic measurements of the light from the planet to determine the type of planet, its gross<br />
physical properties, and its main atmospheric constituents — the ultimate goal of course is to assess<br />
whether life or habitable conditions exist there. <strong>TPF</strong>-I will be designed so that, with a high degree of<br />
confidence, it will be capable of detecting Earth-like planets should they exist in the habitable zones of<br />
the stars in its survey.<br />
1.3 Development of the Interferometer Architecture<br />
The overall designs for planet-finding interferometers have changed substantially since Bracewell first<br />
proposed adding a π phase shift within an astronomical interferometer to create the first nulling<br />
interferometer (Woolf and Angel 1998). This Bracewell nuller has a symmetric response on the sky,<br />
making it difficult to separate the contribution of a planet from the emission from zodiacal dust orbiting<br />
the target star (the exozodiacal emission). It is also vulnerable to small drifts in the stray light level or in<br />
the gain of the system that can mimic the planet signal. The solution was the Linear Dual Chopped<br />
Bracewell design, comprising two single Bracewell nullers that are cross-combined with a relative phase<br />
of ±π/2. By taking the difference in photon outputs of these two phase chop states, the resulting response<br />
is anti-symmetric, and is insensitive to the both the symmetric exozodiacal emission and instrumental<br />
drifts.<br />
In parallel with the introduction of phase chopping, there was development of higher-order nulling<br />
configurations. The motivation here is to reduce the impact of stellar leakage on the null depth. Although<br />
light from the center of the star can be nulled completely, light from the edges will leak through to some<br />
extent. The Bracewell designs have a null that degrades away from the optical axis as θ 2 , leading to<br />
relatively high stellar leakage. The Angel Cross combines the light from four collectors to give a null that<br />
degrades as θ 4 , reducing the stellar leakage to a negligible level (Angel and Woolf 1997; Beichman,<br />
Woolf, and Lindensmith 1999). Variations on this design include the Degenerate Angel Cross (DAC) and<br />
Generalized Angel Cross (GAC). These basic nulling elements are cross-combined using phase chopping<br />
to generate configurations such as the Chopped Degenerate Angel Cross (a linear design based on DACs)<br />
and the six-collector Bow-Tie design that was favored by ESA for a while (Fridlund et al. 2006, and<br />
references therein).<br />
4
I NTRODUCTION<br />
Standard Interferometer<br />
1978<br />
Phase chop<br />
Bracewell nuller<br />
High-order null<br />
Linear Dual<br />
Chopped Bracewell<br />
Angel Cross<br />
Phase chop<br />
<strong>TPF</strong> Book, 1999<br />
Imaging PSF<br />
Linear Dual<br />
Chopped Bracewell<br />
Chopped DAC,<br />
Laurance, Bow-tie<br />
Mission performance<br />
Minimize # spacecraft<br />
<strong>NASA</strong> Trade<br />
Study, 2004<br />
Instability noise<br />
X-Array<br />
Diamond, Z-array,<br />
3-Telescope Nuller<br />
Simple beam relay<br />
Stretched X-Array<br />
right-angled<br />
3-Telescope Nuller<br />
Today<br />
Figure 1-3. Schematic showing the evolution of the preferred nulling architecture for a <strong>TPF</strong>-I/Darwin<br />
mission.<br />
These chopped high-order null configurations were thought to be superior in performance to the Linear<br />
Dual Chopped Bracewell configuration, but this proved not to be the case. Simulations to predict the<br />
number of stars that could be surveyed for planets showed that the Linear DCB could survey<br />
approximately twice the number of stars compared to a Bow-Tie with the same total collecting area. The<br />
reason is that the Linear DCB is much more efficient at converting planet photons into modulated output<br />
signal – it has a higher ‘modulation efficiency’. This is offset by the higher stellar leakage, but this only<br />
has a significant impact on the bright nearby stars that occupy only a small fraction of the total integration<br />
time available.<br />
The architecture evolution from this point has followed two parallel tracks. At ESA, the emphasis was on<br />
minimizing the number of spacecraft used. The Diamond and Z-Array are both DCB configurations in<br />
which the one spacecraft serves the function of both collector and combiner. In both cases the beams<br />
make multiple hops from collector to combiner to balance the path lengths. Another development was the<br />
three-telescope nuller. This is a departure from the DCB, in which the collectors are combined with<br />
phases of 0, ±2π/3, and ±4π/3. With three spacecraft, the equilateral triangle is the minimal configuration<br />
that still supports phase chopping, but the symmetry leads to undesirable imaging properties. It too uses<br />
multiple hops to relay the beams from collector to combiner. The design currently favored is the right-<br />
5
C HAPTER 1<br />
angled Three Telescope Nuller with a dedicated beam combiner spacecraft to alleviate the complexity of<br />
the beam relay, and sufficient asymmetry to improve the imaging properties.<br />
The focus at <strong>NASA</strong> was on improving the imaging properties of the array, which is important for<br />
separating the contributions from multiple planets, determining the orbit, and discriminating against<br />
lumps in the exozodiacal emission. This led to a rearrangement of the collectors in the Linear DCB to<br />
produce the X-Array – a configuration in which the nulling baselines lie along the short side of the<br />
rectangle and the imaging baselines (which determine the angular resolution) along the long dimension.<br />
The beams are relayed in a single hop from each collector to a central combiner. The decoupling of the<br />
nulling and imaging baselines makes the X-Array more flexible than other configurations. This flexibility<br />
was subsequently exploited to eliminate ‘instability noise’ with the ‘Stretched X-Array’ design. Instability<br />
noise—an analog of speckle noise in the coronagraph—arises from fluctuations in the path lengths,<br />
pointing, dispersion, etc. of the instrument, and drives the requirement on the null depth down to 10 -6 . The<br />
long imaging baselines of the Stretched X-Array give the planet signals a unique spectral signature that<br />
can be effectively separated from the instability noise, and they also greatly improve the angular<br />
resolution of the instrument.<br />
The configurations above are defined by the relative location of the collectors. Until recently, the<br />
combiner spacecraft was always located in the same plane as the collectors, normal to the direction to the<br />
target star. ESA then proposed the ‘Emma’ architecture, in which the combiner is moved out towards the<br />
star by about 1 km, and the collectors are reduced to a single spherical mirror. Most of the nulling<br />
configurations already described can be implemented in either the classic planar format or the out-ofplane<br />
Emma format. The Emma design offers significant advantages which are presently being studied<br />
independently by ESA and <strong>NASA</strong>. Preliminary results of these studies were first reported very recently,<br />
only in the later half of 2006, and are therefore not within the scope of this document. The appeal of the<br />
Emma design is primarily in its simplification of the telescope optics, eliminating the need for any<br />
deployables, and also in the design of the sunshields, which become folded into a hard shell—thereby<br />
reducing the risk of catastrophic failure. However, the simplification of the telescope optics increases the<br />
complexity of the beam combiner, and it currently is not known to what extent this will reduce the overall<br />
cost and risk of the mission. What is clear is that there exists obvious agreement in design principles<br />
between researchers at <strong>NASA</strong> and ESA, and the architectures for both <strong>TPF</strong>-I and Darwin appear to be<br />
converging in 2007.<br />
6
I NTRODUCTION<br />
1.4 References<br />
Angel, R., and Woolf, N., “An imaging interferometer to study extrasolar planets,” Astrophys. J. 475,<br />
373–379 (1997).<br />
Beichman, C. A., Fridlund, M., Traub, W. A., Stapelfeldt, K. R., Quirrenbach, A., and Seager, S.,<br />
Protostars and Planets V, edited by Reipurth, B., Jewitt, D., and Keil, K., University of Arizona<br />
Press, Tucson, AZ, pp. 915 (2007).<br />
Beichman, C. A., Woolf, N. J., and Lindensmith, C. A., <strong>TPF</strong>: A <strong>NASA</strong> Origins <strong>Program</strong> to Search for<br />
Habitable Planets, JPL Publication 99-3, Jet Propulsion Laboratory, Pasadena, CA (1999).<br />
http://planetquest.jpl.nasa.gov/<strong>TPF</strong>/tpf_book/index.cfm<br />
Beichman, C. A., Coulter, D. R., Lindensmith, C. A., and Lawson, P. R., editors, Summary <strong>Report</strong> on<br />
Architecture Studies for the Terrestrial Planet Finder, JPL Publication 02-011, Jet Propulsion<br />
Laboratory, Pasadena, CA (2002).<br />
http://planetquest.jpl.nasa.gov/<strong>TPF</strong>/arc_index.cfm<br />
Fridlund, C. V. M., d'Arcio, L., den Hartog, R., Karlsson, A. 2006, “Status and recent progress of the<br />
Darwin mission in the Cosmic Vision program,” Advances in Stellar Interferometry, edited by<br />
Monnier, J. D, Schöller, M., Danchi, W. C., Proc. SPIE 6268, 62680Q (2006).<br />
Harrington, J., Hansen, B. M., Luszcz, S. H., Seager, S., Deming, D., Menou, K., Cho, J. Y.-K., and<br />
Richardson, L .J., “Phase dependent infrared brightness of the extrasolar planet υ Andromedae b,”<br />
Science 314, 623–626 (2006).<br />
Kuchner, M. J., General Astrophysics and Comparative Planetology with the Terrestrial Planet Finder<br />
Missions, JPL Publication 05-01, Jet Propulsion Laboratory, Pasadena, CA (2005).<br />
http://planetquest.jpl.nasa.gov/documents/GenAst28b.pdf<br />
Lawson, P. R., Unwin, S. C., and Beichman, C. A., editors, Precursor Science for the Terrestrial Planet<br />
Finder, JPL Publication 04-014, Jet Propulsion Laboratory, Pasadena, CA (2004)<br />
http://planetquest.jpl.nasa.gov/documents/RdMp273.pdf<br />
Traub, W. A.; Ridgway, S. T., Beichman, C. A., Johnston, K. J., Kasting, J., Shao, M. IAU Colloquium<br />
#200, edited by Aime, C. and Vakili, F.: Cambridge University Press, Cambridge, UK, 399 pp.<br />
(2006).<br />
Woolf, N. J., and Angel, J. R. P., “Astronomical searches for Earth-like planets and signs of life,” Ann.<br />
Rev. Astron. Astrophys. 36, 507–538 (1998).<br />
A Road Map for the <strong>Exploration</strong> of Neighboring Planetary Systems (ExNPS)<br />
JPL Publication 96-22, Jet Propulsion Laboratory, Pasadena, CA (1996).<br />
http://origins.jpl.nasa.gov/library/exnps/index.html<br />
7
E X O P L A N E T S CIENCE<br />
2 <strong>Exoplanet</strong> Science<br />
2.1 Science Requirements<br />
2.1.1 Planetary Detection and Characterization<br />
The objectives of the Terrestrial Planet Finder missions are to detect directly and characterize Earth-like<br />
planets around nearby stars. As illustrated in Fig. 2-1, <strong>TPF</strong>-C, a visible-light coronagraph, and <strong>TPF</strong>-I, a<br />
mid-infrared formation-flying interferometer, must first separate planet light from starlight. The<br />
requirement to characterize implies that the missions must determine the type of a planet and characterize<br />
its gross physical properties and its main atmospheric constituents, thereby allowing an assessment of the<br />
likelihood that life or habitable conditions exist there.<br />
The combination of these two missions will provide a definitive characterization of planets.<br />
Measurements across such a broad wavelength range will yield not only physical properties (such as size<br />
and albedo), but they will also serve as the foundation of a reliable and robust assessment of habitability<br />
and the presence of life. The measurement requirements of the <strong>TPF</strong>-I mission for the detection and<br />
characterization of the constituents of extrasolar planetary systems (including terrestrial planets, gas<br />
giants, and zodiacal dust) are given in Table 2-1.<br />
Types of Stars<br />
On astrophysical grounds, Earth-like planets are likely to be found around stars that are roughly similar to<br />
the Sun (Turnbull 2004). Therefore, <strong>TPF</strong> target stars will include main sequence F, G, and K stars.<br />
However, M stars may also harbor habitable planets, and the nearest of these could be investigated using<br />
the high angular resolution of the interferometer.<br />
Terrestrial Planets<br />
Considering the radii and albedos or effective temperatures of Solar System planets, <strong>TPF</strong>-I must be able<br />
to detect terrestrial planets, down to a minimum terrestrial planet defined as having 1/2 Earth surface area<br />
and Earth albedo. In the infrared, the minimum detectable planet would be one with an infrared emission<br />
corresponding to the surface area and optical albedo, positioned in the orbital phase space stipulated<br />
below.<br />
• Habitable Zone: The <strong>TPF</strong> missions should search the most likely range as well as the complete<br />
range of temperatures within which life may be possible on a terrestrial-type planet. In the Solar<br />
System, the most likely zone is near the present Earth, and the full zone is the range between<br />
Venus and Mars. The habitable zone (HZ) is here defined as the range of semi-major axes from<br />
9
C HAPTER 2<br />
0.7 to 1.5 AU scaled by the square root of stellar luminosity. The minimum terrestrial planet must<br />
be detectable at the outer edge of the HZ.<br />
• Orbital Phase Space: The distribution of orbital elements of terrestrial type planets is presently<br />
unknown, but observations suggest that giant-planet orbits are distributed roughly equally in<br />
semi-major axis, and in eccentricity up to those of the Solar System planets and larger.<br />
Therefore, <strong>TPF</strong>-I must be designed to search for planets drawn from uniform probability<br />
distributions in semi-major axis over the range 0.7 to 1.5 AU and in eccentricity over the range 0<br />
to 0.35, with the orbit pole uniformly distributed over the celestial sphere with random orbit<br />
phase.<br />
Giant Planets<br />
The occurrence and properties of giant planets may determine the environments of terrestrial planets. The<br />
<strong>TPF</strong>-I field of view and sensitivity must be sufficient to detect a giant planet with the radius and<br />
geometric albedo or effective temperature of Jupiter at 5 AU (scaled by the square root of stellar<br />
luminosity) around at least 50% of its target stars. A signal-to-noise ratio of at least 5 is required.<br />
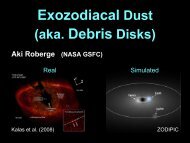
Exozodiacal Dust<br />
Emission from exozodiacal dust is both a source of noise and a legitimate target of scientific interest.<br />
<strong>TPF</strong>-I must be able to detect planets in the presence of zodiacal clouds at levels up to a maximum of 10<br />
times the brightness of the zodiacal cloud in the Solar System. Although the average amount of exozodiacal<br />
emission in the “habitable zone” is not yet known (see Section 2.6), we adopt an expected level<br />
of zodiacal emission around target stars of 3 times the level in our own Solar System with the same<br />
fractional clumpiness as our Solar System’s cloud. From a science standpoint, determining and<br />
understanding the properties of the zodiacal cloud is essential to understanding the formation, evolution,<br />
and habitability of planetary systems. Thus, <strong>TPF</strong>-I should be able to determine the spatial and spectral<br />
distribution of zodiacal clouds with at least 0.1 times the brightness of the Solar System’s zodiacal cloud.<br />
Spectral Range<br />
The required spectral range of the <strong>TPF</strong>-I mission for characterization of extrasolar planets will emphasize<br />
the characterization of Earth-like planets and is therefore set to 6.5 to 18 µm in the infrared. The<br />
minimum range is 6.5 to 15 µm.<br />
Spectrum<br />
The <strong>TPF</strong>-I mission will use the spectrum of a planet to characterize its surface and atmosphere. The<br />
spectrum of the present Earth, scaled for semi-major axis and star luminosity, is used as a reference and<br />
suggests a minimum spectral resolution is 25 with a goal of 50. <strong>TPF</strong>-I must measure water (H 2 O) and<br />
ozone (O 3 ) with 20% accuracy in the equivalent width of the spectral feature. Additionally it is highly<br />
desirable that <strong>TPF</strong>-I also be able to measure carbon dioxide CO 2 ) as well as methane (CH 4 ) (if the latter is<br />
present in high quantities predicted in some models of pre-biotic, or anoxic planets, e.g. Kasting et al.<br />
2003).<br />
10
E X O P L A N E T S CIENCE<br />
Table 2-1. <strong>TPF</strong>-I Science Requirements<br />
Parameter<br />
<strong>TPF</strong>-I Requirement<br />
Star Types<br />
F, G, K, selected, nearby M, and others<br />
Habitable Zone 0.7–1.5 AU scaled as L 1/2<br />
Number of Stars to Search 150<br />
Completeness for Each Core Star 90%<br />
Minimum Number of Visits per Target 3<br />
Minimum Planet Size<br />
0.5–1.0 Earth Area<br />
Geometric Albedo<br />
Earth’s<br />
Spectral Range and Resolution 6.5–18 μm; R = 25 [50]<br />
Characterization Completeness<br />
Spectra of 50% of Detected or 10 Planets Maximum<br />
Giant Planets<br />
Jupiter Flux, 5 AU, 50% of Stars<br />
Maximum Tolerable Exozodiacal Emission 10 times Solar System Zodiacal Cloud<br />
Number of Stars to be Searched<br />
To satisfy its scientific goals, <strong>TPF</strong>-I should detect and characterize a statistically significant sample of<br />
terrestrial planets orbiting F, G, and K stars. Although at this time, the fractional occurrence of terrestrial<br />
exoplanets in the Habitable Zone is not known, a sample of 150 stars within 30 pc (including a small<br />
number of nearby M stars) should suffice based on our present understanding.<br />
Extended Number of Stars<br />
It is desired to search as many stars as possible, beyond the required core sample. We anticipate that any<br />
mission capable of satisfying these objectives will also be capable of searching many more stars if the<br />
overall requirements on completeness are relaxed. It is desired that <strong>TPF</strong>-I be capable of searching an<br />
extended group of stars defined as those systems of any type in which all or part of the continuously<br />
habitable zone (see below) can be searched.<br />
Search Completeness<br />
Search completeness is defined as that fraction of planets in the orbital phase space that could be found<br />
within instrumental and mission constraints. We require each of the 150 stars to be searched at the 90%<br />
completeness level. For other targets in addition to the 150 stars, the available habitable zone will be<br />
searched as to limits in planet's orbital characteristics.<br />
Characterization completeness<br />
While it will be difficult to obtain spectra of the fainter or less well positioned planets, we require that<br />
<strong>TPF</strong>-I be capable of measuring spectra of at least 10 (~50%) of the detected planets.<br />
11
C HAPTER 2<br />
Table 2-2. Illustrative Properties of a <strong>TPF</strong>-I Observatory Concept*<br />
Parameter<br />
Telescopes<br />
4-Telescope Dual Chopped Bracewell Design<br />
Four 4-m diameter telescopes, diffraction limited at 2 μm operating at 40 K<br />
Array size<br />
60–150 m center-to-center of outer telescope in linear array<br />
Baseline range<br />
40–100 m<br />
Wavelength range 6.5–15 µm, with the goal of 6.5–18 µm<br />
Angular resolution (maximum) 50–75 milli-arcseconds<br />
Field-of-view 1 arcsec at 12 µm<br />
Spectral resolution Δλ/λ 25 with a goal of 50<br />
Sensitivity 0.35 µJ at 12 µm<br />
Number of stars 150<br />
Biomarkers H 2 O and O 3 with a goal of also measuring CO 2 and CH 4<br />
Field of regard<br />
±45° of anti-Sun direction<br />
Orbit<br />
L2 Halo orbit<br />
Mission duration<br />
5 years baseline with a goal of 10 years<br />
Mission launch<br />
2019 with Heavy-class launch vehicle, Delta 4050H<br />
*Further details are available in Appendix B<br />
Visitations<br />
Multiple visits per star will be required to achieve required completeness, to distinguish it from<br />
background objects, to determine its orbit, and to study a planet along its orbit. <strong>TPF</strong>-I must be capable of<br />
making at least 3 visits to each star to meet the completeness and other requirements.<br />
Multiple Planets<br />
After the completion of the required number of visitations defined above, <strong>TPF</strong>-I should be able to<br />
characterize a planetary system as complex as our own with three terrestrial-sized planets assuming each<br />
planet is individually bright enough to be detected.<br />
Orbit Determination<br />
After the completion of the required number of visitations defined above, <strong>TPF</strong>-I shall be able to localize<br />
the position of a planet orbiting in the habitable zone with an accuracy of 10% of the semi-major axis of<br />
the planet’s orbit. This accuracy may degrade to 25% in the presence of multiple planets.<br />
12
E X O P L A N E T S CIENCE<br />
25 mag,<br />
10 billion<br />
17.5 mag,<br />
10 million<br />
Figure 2-1. The Solar System seen from 10 pc illustrates the challenge of <strong>TPF</strong>-C and<br />
<strong>TPF</strong>-I, where the Earth-Sun contrast is 10 7 in the mid-infrared and 10 10 in the visible.<br />
(Traub and Jucks 2002)<br />
2.1.2 Observing Modes<br />
Imaging<br />
The interferometer will be capable of imaging in the nulling mode and in the classical mode of<br />
constructive interference. This is to meet major science goals in the areas of:<br />
• Star and planet formation and early evolution.<br />
• Stellar and planetary death and cosmic recycling.<br />
• The formation, evolution, and growth of black holes.<br />
• Galaxy formation and evolution over cosmic time.<br />
Nulling<br />
• Sensitivity: A point source of 1 μJy should be detectable with a signal divided by noise (S/N) of 5<br />
in one hour’s integration time<br />
• Baseline Lengths: Maximum 200 meters<br />
13
C HAPTER 2<br />
Classical interferometry<br />
• Same as above<br />
• Operate over the wavelength range of 3–15 µm<br />
• A synthesized field of view (FOV) of 100–1000 resolution elements in two orthogonal<br />
coordinates<br />
• A dynamic range of 100:1<br />
• 1000 spectral elements<br />
2.1.3 Mission Summary<br />
Performance Requirement<br />
As a minimum, <strong>TPF</strong>-I must be able to detect planets with half the area of the Earth, and the Earth’s<br />
geometric albedo, searching the entire HZ of the core-group stars with 90% completeness per star. Flux<br />
ratios must be measured in three broad wavelength bands, to 10% accuracy, for at least 50% of the<br />
detected terrestrial planets. The spectrum must be measured for at least 50% of the detected terrestrial<br />
planets—to give the equivalent widths of H 2 O, and O 3 to an accuracy of 20%.<br />
Performance Goal<br />
As a goal, <strong>TPF</strong>-I must be able to detect planets with half the area of the Earth, with Earth’s geometric<br />
albedo, searching the entire HZ of the 150 stars with 90% completeness. The flux ratio must be<br />
measured in three broad wavelength bands to 10% accuracy for at least 50% of the detected terrestrial<br />
planets. The spectrum must be measured—for at least 50% of the detected terrestrial planets—to give the<br />
equivalent widths of H 2 O, and O 3 in the infrared to an accuracy of 20%. Further, we desire that the<br />
mission search an extended group of stars defined as those systems of any type in which all or part of the<br />
HZ can be searched.<br />
2.2 Wavelength Coverage<br />
As shown in Figure 2-1, the Earth’s brightness peaks at 10 μm. As discussed below, we specify the<br />
wavelength coverage for <strong>TPF</strong>-I as being between 6.5 and 15 μm to detect CH 4 , O 3 , and H 2 O with a goal<br />
of 6.5–18 μm to include CO 2 .<br />
14
E X O P L A N E T S CIENCE<br />
Figure 2-2. Model and disk-integrated spectrum in the mid-infrared. (Data by Christenson et al. 1997,<br />
reproduced from Kaltenegger et al. 2006).<br />
2.3 Physical Characterization<br />
The search for signs of life implies that one needs to gather as much information as possible in order to<br />
understand how the observed atmosphere physically and chemically works. Knowledge of the<br />
temperature and planetary radius is crucial for the general understanding of the physical and chemical<br />
processes occurring on the planet (e.g., tectonics, hydrogen loss to space). In theory, spectroscopy can<br />
provide some detailed information on the thermal profile of a planetary atmosphere. This however<br />
requires a spectral resolution and a sensitivity that are well beyond the performance of a first generation<br />
mission such as Darwin or <strong>TPF</strong>-I. Therefore, the following discussion will be limited to data that could be<br />
obtained with relatively low spectral resolution.<br />
2.3.1 Temperature, Radius, and Albedo<br />
One can calculate the stellar energy of the star F star that is received at the measured orbital distance. This<br />
only gives very little information on the temperature of the planet which depends on its albedo. The<br />
surface temperature is likely to be enhanced by greenhouse gases. However, with a low-resolution<br />
spectrum of the thermal emission, plus a measure of the emitted flux, the effective temperature and the<br />
radius of the planet can be obtained by fitting the envelope of the thermal emission by a Planck function.<br />
The ability to assign an effective temperature to the spectrum relies on the existence and identification of<br />
spectral windows probing to the surface or to a common atmospheric level. Such identification is not<br />
15
C HAPTER 2<br />
trivial in the absence of any other information on the observed planet. For an Earth-like planet there are<br />
some atmospheric windows that can be used in most of the cases, especially between 8 and 11 µm. This<br />
window would, however, become opaque at high H 2 O partial pressure (e.g., the inner part of the HZ<br />
where a lot of water is vaporized) and at high CO 2 pressure (e.g., a very young Earth or the outer part of<br />
the HZ).<br />
Let us look at the case of the three known terrestrial planets, Venus, Earth and Mars. For Mars, the<br />
temperature deduced from the shape of the infrared spectrum is a good approximation to the surface<br />
temperature, except in the CO 2 band. On Earth, the infrared spectrum is a mixture of surface and cloud<br />
emission, the latter occurring at lower temperature. The temperature given by the envelope of the<br />
spectrum is thus slightly lower, by about 10 K on average, than the average surface temperature. In the<br />
extreme case of Venus, the spectrum envelope gives a temperature of 277 K, much lower than the 740 K<br />
of the surface. The reason for this discrepancy comes from the fact that the atmosphere of Venus is<br />
completely opaque below 60 km because of the permanent cloud cover and the absorption continuum,<br />
induced at high pressure by CO 2 –CO 2 collisions.<br />
With low-resolution spectral observations, it is difficult to determine if the lower atmosphere contributes<br />
to the spectrum and therefore, if the temperature reflects the surface conditions. The accuracy of the<br />
radius and temperature determination will depend on the quality of the fit (and thus on the sensitivity and<br />
resolution of the spectrum), the precision of the Sun–star distance, and also the distribution of brightness<br />
temperatures over the planetary surface.<br />
Finally, if the effective temperature is measured in the infrared, then the visible albedo can be inferred,<br />
using F star (1 – A) = 4σT eff 4 .<br />
2.3.2 Orbital Flux Variation<br />
The variation or constancy of infrared flux with orbital position (i.e., with phase angle) provides us some<br />
information about the surface of the planet. One approach is to note that the orbital flux variation in the<br />
infrared can distinguish planets with and without an atmosphere (Selsis et al. 2003, Gaidos and Williams<br />
2004). A strong variation of the thermal flux with phase angle can be consistent with the absence of an<br />
atmosphere, because here we are looking at a rocky surface with low thermal inertia; and therefore, a<br />
strong day–night temperature variation. Examples are Mercury and the Moon. In such a case one has to<br />
readjust the inferred radius estimate of the planet by taking the viewing geometry of the system into<br />
account.<br />
The opposite case, when the apparent effective temperature is constant along the orbit, implies a large<br />
thermal inertia from, for example an ocean, and/or a rapid circulation of incident energy through large<br />
scale atmospheric motions.<br />
Therefore, habitable planets are potentially distinguishable from airless or Mars-like planets by the<br />
amplitude of the observed variations of effective temperature, however since Venus and Earth are roughly<br />
similar in this way, additional spectroscopy is needed to separate such cases.<br />
An exception to the above cases is υ Andromedae b, a tidally locked hot Jupiter with an observed day–<br />
night temperature difference of about 1400 K (Harrington et al. 2006). Here, unlike Venus, the massive<br />
16
E X O P L A N E T S CIENCE<br />
atmosphere does not circulate its heat around the planet. That detection (as well as models) has shown<br />
that tidally locked planets are special cases and should exhibit strong temperature variations.<br />
2.4 Biomarkers<br />
The Terrestrial Planet Finder Interferometer (<strong>TPF</strong>-I) and Darwin missions, and the Terrestrial Planet<br />
Finder Coronagraph (<strong>TPF</strong>-C), are designed to directly detect terrestrial exoplanets around nearby stars<br />
and to measure their spectra (see, e.g., Beichman et al. 1999; 2006; Fridlund 2000; Kaltenegger and<br />
Fridlund 2005; Borde and Traub 2006). These spectra will be analyzed to establish the presence and<br />
composition of their atmospheres, to investigate their capability to sustain life as we know it<br />
(habitability), and to search for signs of life. These missions also have the capacity to investigate the<br />
physical properties and composition of a broader diversity of planets, to understand the formation of<br />
planets, and to search for the presence of potential biosignature compounds. The range of characteristics<br />
of planets is likely to exceed our experience with the planets and satellites in our own Solar System, and<br />
Earth-like planets orbiting stars of different spectral type might also evolve differently (Selsis 2000;<br />
Segura et al. 2003, 2005).<br />
Biomarkers are detectable species whose presence at significant abundance requires a biological origin<br />
(Des Marais et al. 2002). They are the chemical ingredients necessary for biosynthesis (e.g., oxygen [O 2 ]<br />
and CH 4 ) or are products of biosynthesis (e.g., complex organic molecules, but also O 2 and CH 4 ). Our<br />
search for signs of life is based on the assumption that extraterrestrial life shares fundamental<br />
characteristics with life on Earth, in that it requires liquid water as a solvent and has a carbon-based<br />
chemistry (Owen 1980; Des Marais et al. 2002). Therefore we assume that extraterrestrial life is similar to<br />
life on Earth in its use of the same input and output gases, that it exists out of thermodynamic equilibrium,<br />
and that it has analogs to bacteria, plants, and animals on Earth (Lovelock 1975).<br />
Candidate biomarkers that might be detected by a low-resolution <strong>TPF</strong>-I instrument include O 2 , O 3 , and<br />
CH 4 . There are good biogeochemical and thermodynamic reasons for believing that these gases should be<br />
ubiquitous byproducts of carbon-based biochemistry, even if the details of alien biochemistry are<br />
significantly different than the biochemistry on Earth. Production of O 2 by photosynthesis allows<br />
terrestrial plants and photosynthetic bacteria (cyanobacteria) to use abundant H 2 O as the electron donor to<br />
reduce CO 2 , instead of having to rely on scarce supplies of hydrogen (H 2 ) and hydrogen sulfide (H 2 S).<br />
Oxygen and nitrous oxide (N 2 O) are two very promising bio-indicators. Oxygen is a chemically reactive<br />
gas. Reduced gases and oxygen have to be produced concurrently to produce quantities large enough to<br />
be detectable in disk-averaged spectra of terrestrial planet atmospheres, as they react rapidly with each<br />
other. N 2 O is a biomarker in the Earth’s atmosphere, being produced in abundance by life but only in<br />
trace amounts by natural processes. Although a relatively weak feature in the Earth’s spectrum, it may be<br />
more pronounced in extrasolar terrestrial planet atmospheres of different composition or host-star spectral<br />
type (Segura et al. 2005). Currently, efforts are ongoing to explore the plausible range of habitable<br />
planets and to improve our understanding of the detectable ways in which life modifies a planet on a<br />
global scale.<br />
17
C HAPTER 2<br />
Figure 2-3. Simulated mid-infrared spectrum of an Earth-like planet showing the<br />
effects of viewing angle (Giovanna Tinetti, Institut d’Astrophysique de Paris).<br />
2.4.1 Biomarker Signatures in the Mid Infrared<br />
In the mid-IR, the classical signature of biological activity is the combined detection of the 9.6-μm O 3<br />
band, the 15-μm CO 2 band, and the 6.3-μm H 2 O band or its rotational band that extends from 12 μm out<br />
into the microwave region (Selsis and Despois 2002). Because oxygen is a chemically reactive gas, it<br />
follows that reduced gases and oxygen have to be produced concurrently to be detectable in the<br />
atmosphere, as they react rapidly with each other. The oxygen and ozone absorption features in the visible<br />
and thermal infrared, respectively, could indicate the presence of photosynthetic biological activity on<br />
Earth any time during the past 50% of the age of the Solar System. In the Earth’s atmosphere, the 9.6-μm<br />
O 3 band is a poor quantitative indicator of the O 2 amount, but an excellent qualitative indicator for the<br />
existence of even traces of O 2 . The Ozone 9.6-μm band is a very nonlinear indicator of O 2 for two<br />
reasons. First, for the present atmosphere, low-resolution spectra of this band show little change with the<br />
O 3 abundance because it is strongly saturated. Second, the apparent depth of this band remains nearly<br />
constant as O 2 increases from 0.01 times the present atmosphere level (PAL) of O 2 to 1 PAL (Segura et al.<br />
2003). The primary reason for this is that the stratospheric ozone increases that accompanied the O 2<br />
buildup lead to additional ultraviolet heating of the stratosphere. At these higher temperatures, the<br />
stratospheric emission from this band partially masks the absorption of upwelling thermal radiation from<br />
the surface.<br />
18
E X O P L A N E T S CIENCE<br />
Figure 2-4. Equivalent width in microns (left) and resolution (right) of the main spectral features of<br />
atmospheric compounds over geological times in the thermal infrared for an Earth-analog with Earth<br />
clouds. (Kaltenegger et al. 2007)<br />
Methane is not readily identified using low-resolution spectroscopy for present-day Earth, but the CH 4<br />
feature at 7.66 μm in the IR is easily detectable at higher abundances (see e.g. 100× abundance in epoch 4<br />
below). When observed together with molecular oxygen, abundant CH 4 can indicate biological processes<br />
(see also Lovelock 1975, Segura et al. 2003). Depending on the degree of oxidation of a planet's crust and<br />
upper mantle, non-biological mechanisms can also produce large amounts of CH 4 under certain<br />
circumstances.<br />
N 2 O is also a candidate biomarker because it is produced in abundance by life but only in trace amounts<br />
by natural processes. There are no N 2 O features in the visible and three weak N 2 O features in the thermal<br />
infrared at 7.75 μm, 8.52 μm, and 16.89 μm. For present-day Earth, one needs a resolution of 23, 23 and<br />
44, respectively, to detect N 2 O at thermal infrared wavelengths (Kaltenegger et al. 2007). Spectral<br />
features of N 2 O also become more apparent in atmospheres with less H 2 O vapor. Methane and nitrous<br />
oxide have features nearly overlapping in the 7-μm region, and additionally both lie in the red wing of the<br />
6-μm water band. Thus N 2 O is unlikely to become a prime target for the first generation of space-based<br />
missions searching for exoplanets, but it is an excellent target for follow-up missions. There are other<br />
molecules that could, under some circumstances, act as excellent biomarkers, e.g., the manufactured<br />
chloro-fluorocarbons (CCl 2 F 2 [Freon 13] and CCL 3 F [Freon 12]) in our current atmosphere in the thermal<br />
infrared waveband, but their abundances are too low to be spectroscopically observed at low resolution.<br />
Other biogenic trace gases might also produce detectable biosignatures. Currently identified potential<br />
candidates include volatile methylated compounds (like methyl chloride [CH 3 Cl]) and sulfur compounds.<br />
It is known that these compounds are produced by microbes, and preliminary estimates of their lifetimes<br />
and detectability in Earth-like atmospheres around stars of different spectral type have been made (Segura<br />
et al. 2003, 2005). However, it is not yet fully understood how stable (or detectable) these compounds<br />
19
C HAPTER 2<br />
would be in atmospheres of different composition and for stars of different spectral type and incident<br />
ultraviolet flux. These uncertainties, however, could be addressed by further modeling studies.<br />
2.4.2 Resolution Needed<br />
This section provides quantitative information on the sensitivity necessary to detect spectral features on<br />
Earth or an Earth-like exoplanet. The equivalent width needed for optimal detection of each chemical<br />
signature in the thermal infrared is given in Figure 2-4 (Kaltenegger et al. 2007). Following standard<br />
practice, the total absorption in the feature is expressed in terms of equivalent width, (i.e., the spectral<br />
width of an equal area of a rectangular line with zero residual intensity and unity continuum). To detect a<br />
spectral feature with optimum signal to noise requires that the full width at half maximum (FWHM) of<br />
the spectrometer should be approximately equal to the FWHM of the spectral features. For an extrasolar<br />
planet this will not be known, but assuming an Earth-analog as a guideline, we can specify these numbers.<br />
We determine equivalent width for these species by integrating the difference between a model spectrum<br />
with and without the chemical of interest. The spectral resolution (λ/Δλ) needed for optimal detection of<br />
each changing spectral feature is given in Figure 2-4. Here λ is the central wavelength of a feature, and Δλ<br />
is the FWHM of the feature after it has been smeared sufficiently to blend any sharp lines yet still retain<br />
its essential overall shape. These numbers are relevant for the design of the <strong>TPF</strong>-I and Darwin mission.<br />
Note that features like N 2 O would have to be detected on top of another feature, implying an excellent<br />
signal-tonoise ratio (SNR) for detection. This example also illustrates that identification of the continuum<br />
region, as well as potentially overlapping species, is also an important part of biomarker detection, which<br />
in some cases may require higher spectral resolution, in addition to high signal to noise.<br />
2.4.3 Planets Around Different Stars<br />
The interferometric systems suggested for Darwin and the <strong>TPF</strong>-I mission operate in the mid-IR, and the<br />
coronagraph suggested for <strong>TPF</strong>-C operates in the visible. For the former it is thus the thermal emission<br />
emanating from the planet that is detected and analyzed, while for the latter the reflected stellar flux is<br />
measured. This means, that if you want to observe Earth-like planets in the Habitable Zone (HZ) around a<br />
given star, the thermal flux will to first order be constant for a given planetary size, while the reflected<br />
stellar flux will scale with the brightness of the star. The suppression of the primary’s thermal emission<br />
will, on the other hand, be progressively easier for later and later spectral types. The contrast ratio is a<br />
factor of about 4 more for FV stars, 30 less for KV stars, and about 300 less for MV stars compared to the<br />
Sun–Earth contrast ration in the IR (Kaltenegger, Eiroa et al. 2007). Surprisingly enough, it may thus be<br />
easier for the IR interferometer concept to detect a habitable Earth around an M-Dwarf than around<br />
something more akin to our own Sun. This is true for interferometric systems like Darwin and <strong>TPF</strong>-I that<br />
can be adapted to each individual target system, since the HZ moves closer and closer to the star for later<br />
and later stellar types. The baseline of the interferometers have to increase to resolve M-star planetarysystems<br />
at larger distances, a constraint that is taken into account for the M target systems at largest<br />
distance in the target star catalogue.<br />
20
E X O P L A N E T S CIENCE<br />
Figure 2-5. These spectra show the appearance of Earth-like planets orbiting within the habitable zones<br />
of stars of F2V, G2V, and K2V stellar type. In each case, a weakly-coupled radiative/photochemical<br />
atmospheric model was used to determine the equilibrium atmospheric composition and vertical<br />
structure for a planet with Earth’s modern atmospheric composition, and radiatively forced by the UV to<br />
the far-infrared spectrum of a star of each spectral type. A sophisticated radiative transfer model was<br />
then used to create a synthetic spectrum of the global spectral appearance of the planet from space, using<br />
the equilibrium atmospheric composition as input. (Segura et al. 2003)<br />
The results of modeling, illustrated in Figure 2-5, show the changes in detectability and shape of spectral<br />
features due to ozone, carbon dioxide, and methane for the “same” planet around stars of different<br />
spectral type. These observed changes in detectability are due to an interplay between the star’s spectrum,<br />
the photochemistry of ozone, and coupled changes in the thermal structure of the planet’s atmosphere.<br />
These models were run for host stars of F, G, K (Segura el al. 2003; Selsis et al. 2000) and M spectral<br />
type (Segura et al. 2005) and show that the detectable features around, e.g., a K star are deeper than the<br />
features around an F host star.<br />
2.4.4 Detection of Water<br />
There are two water features in the IR, the 6.3-μm H 2 O band or its rotational band that extends from 12<br />
μm out into the microwave region. Both water features are difficult to interpret and quantify for an<br />
extrasolar planetary atmosphere. A waveband region from 5 to 20 µm could detect both water features.<br />
The equivalent width for the two features is 1.66 and 0.66 respectively (Kaltenegger et al. 2007) for a<br />
current Earth model atmosphere with the average 60% cloud coverage.<br />
21
C HAPTER 2<br />
Figure 2-6. The mid-infrared spectral features on an Earth-like planet change considerably over its<br />
evolution from a CO 2 -rich (epoch 0) to a CO 2 /CH 4 -rich atmosphere (epoch 3) to a present-day atmosphere<br />
(epoch 5). The black lines show a spectral resolution of 25 comparable to the proposed <strong>TPF</strong>-I mission<br />
concept designs. (Kaltenegger et al. 2006)<br />
This would indicate a stronger feature at 6.3 µm. However, this feature is so strong that it is relatively<br />
insensitive to atmospheric water abundance. Models of Earth’s atmosphere indicate that in the extreme<br />
clear-sky case, that the depth of this feature is very similar for water column abundances between 10%<br />
and more than 200% of the Earth’s present water abundance. 1 Methane and nitrous oxide have features<br />
nearly overlapping in the 7-μm region, and additionally both lie in the red wing of the 6.3-μm water band.<br />
The 6.3-μm H 2 O feature could act instead as a “true/false” indicator of the presence of even very small<br />
amounts of water if the atmosphere is an Earth-analog. Additionally the photons emission is very low at<br />
6.3 μm (see section 2.2).The broad rotational band, extending between 12 and 200 μm, has little spectral<br />
structure. That makes it difficult to discriminate its absorption from other factors affecting the planetary<br />
spectrum, such as the temperature of the emitting layer, which could also result in reduced flux in this<br />
1 Victoria Meadows (Caltech), private communication.<br />
22
E X O P L A N E T S CIENCE<br />
wavelength region. The instrument design has to take the noise levels at both wavelength ends into<br />
account as well as the photons emitted from the planet. Preliminary studies indicate that it will be equally<br />
difficult to detect the water line at both features. To conclude this issue, considerable more detailed study<br />
is needed.<br />
2.4.5 Biomarkers and Their Evolution over Geological Timescales<br />
Terrestrial planets found around other stars may be observed at different stages in their geological and<br />
biological evolution. Earth's atmosphere has experienced dramatic evolution over 4.5 billion years, and<br />
other planets may exhibit similar or greater evolution, and at different rates.<br />
Studies (see e.g., Des Marais et al. 2002; Schindler and Kasting 2000; Kasting and Catling 2003; Selsis,<br />
2000; Pavlov 2000; Traub and Jucks 2002; Segura et al. 2003; Kaltenegger et al. 2007; Meadows 2006)<br />
are designed to guide the interpretation of an observed spectrum of such a planet by future instruments<br />
that will characterize exoplanets. Figure 2-6 shows theoretical mid-infrared spectra of the Earth at six<br />
epochs during its geological evolution (Kaltenegger et al. 2007). The epochs are chosen to represent<br />
major developmental stages of the Earth and life on Earth. If an extrasolar planet is found with a<br />
corresponding spectrum, we will have good evidence for characterizing its evolutionary state, its<br />
habitability, and the degree to which it shows signs of life. The oxygen and ozone absorption features<br />
could have been used to indicate the presence of biological activity on Earth anytime during the past 50%<br />
of the age of the Solar System. The dark lines show a resolution of 25 in the IR, as proposed for the<br />
Darwin/<strong>TPF</strong>-I mission.<br />
2.5 Suitable Targets<br />
Due to angular resolution and sensitivity constraints, the most suitable target stars around which <strong>TPF</strong>-I<br />
can search for exoplanets are the stars nearest the Sun. However, the nearest stars encompass a large<br />
variety of stellar types, classes, ages, and multiplicities (as well as distances); and so the set of all nearby<br />
stars needs to be trimmed or culled, for both scientific reasons and engineering/observational constraints.<br />
The current scientific source selection criteria, defined at a workshop held at the Naval Research<br />
Observatory in Washington, DC, in Nov. 2004, are summarized in this section.<br />
2.5.1 Science Criteria<br />
The identification of candidate scientific targets for <strong>TPF</strong>-I should begin with a complete list of nearby<br />
stars. The master list selected is the Hipparcos catalogue (ESA 1997) of nearby stars, out to a distance<br />
cutoff of 30 pc. This list does not include every star within 30 pc because dim stars at the larger distances<br />
do not fall within the Hipparcos sensitivity limit, implying that the list grows less and less complete as<br />
stellar temperatures decrease. However, for the primary targets of interest, “solar-like” F, G, and K stars,<br />
the list should be fairly complete.<br />
23
C HAPTER 2<br />
Lines of constant<br />
stellar type<br />
30.00<br />
Diameter of circle<br />
proportional to intrinsic<br />
diameter of star<br />
25.00<br />
F0<br />
Distance / pc<br />
20.00<br />
15.00<br />
G0<br />
F9<br />
10.00<br />
G9<br />
K0<br />
5.00<br />
K9<br />
M0<br />
0.00<br />
0 50 100 150 200<br />
Projected IHZ / mas<br />
Figure 2-7. Candidate targets for <strong>TPF</strong>-I. Each of the 1014 candidate stars is represented by a<br />
circle with a diameter proportional to the diameter of the star (intrinsic, not angular diameter).<br />
Curves show loci of a given spectral type.<br />
Beyond the distance criterion, at this early phase it is desirable to keep the number of culling criteria as<br />
small as possible. The scientific target stars can be summarized quite simply: bright, nearby, solar-like,<br />
main-sequence stars for which a binary companion is not too close. This statement translates in<br />
straightforward fashion to the detailed technical requirements listed in Table 2-3.<br />
The final column in this table gives the number of potential target stars remaining after the set of culls<br />
down to a given line has been applied. Even after all applicable science culls have been applied, over<br />
1000 suitable targets remain. These 1014 stars are plotted in Fig. 2-7 on a space of stellar distance vs.<br />
projected inner habitable zones size, from which it can be seen, e.g., that for a sizable candidate<br />
population of stars to be observable, an inner working angle of 50 milliarcsecond (mas) or smaller is<br />
needed. The final candidate list of 1014 stars was used to predict the performance of different <strong>TPF</strong>-I<br />
architectures.<br />
2.5.2 Engineering Criteria<br />
Next one also needs to include instrumental or engineering constraints which can eliminate certain classes<br />
of stars. With the current baseline design of <strong>TPF</strong>-I, these fall into two categories. First, sunshade<br />
constraints limit observations to stars within 45° of the ecliptic. Second, control of stray light implies that<br />
any bright companion stars must be more than 10 arcsec away from the target star of interest. As<br />
Table 2-2 shows, this eliminates about 40% of the scientifically interesting stars.<br />
24
E X O P L A N E T S CIENCE<br />
Table 2-3. Science and Engineering Criteria for<br />
Selection of <strong>TPF</strong>-I Candidate Targets<br />
Parameter Constraint Remaining Stars<br />
Science Culls<br />
Distance (Hipparcos catalog) < 30 pc 2350<br />
Apparent magnitude < 9 1299<br />
Bolometric luminosity < 8 1284<br />
Luminosity class IV, V 1247<br />
B-V index > 0.3 1184<br />
Variability < 0.1 1143<br />
Companions further than 50 AU 1014<br />
Engineering Culls<br />
After science culls 1014<br />
Field of regard |Ecliptic latitude| < 45 deg 650<br />
Multiplicity Separation > 10" 620<br />
2.6 Exozodiacal Dust<br />
2.6.1 Zodiacal Dust as a Constituent of Planetary Systems<br />
The presence of dust around a mature, main-sequence star is a reminder that the star was born by<br />
accretion in a dense protostellar disk of gas and dust and that any planets possessed by the star were born<br />
out of that same material. The dust around a mature star is not itself primordial, since radiative forces will<br />
remove small dust grains in a few thousands to a few millions of years. However, the parent bodies of the<br />
observed small dust grains—large numbers of either asteroids or comets—are the remnants of primordial<br />
material, and the debris within them provides hints to the origin of planetary systems. Additionally, this<br />
solid material is important in the evolution of life, since the cold outer reaches of a planetary system are<br />
rich in water and volatiles needed for the creation of habitable environments in the inner reaches of the<br />
system. Thus, we want to study the exozodiacal clouds of nearby stars for their intrinsic scientific<br />
importance using a variety of observational facilities, including <strong>TPF</strong>-I/Darwin and <strong>TPF</strong>-C. Yet the<br />
brightness of the exozodiacal cloud is also a potential problem for the detection of terrestrial planets due<br />
to increased photon noise and confusion between planets and structures in the zodiacal cloud.<br />
Thus, the incidence, distribution and composition of material in the habitable zones of nearby stars are<br />
important for the design of <strong>TPF</strong>-I or <strong>TPF</strong>-C and for the feasibility of studying individual targets. After a<br />
brief discussion about the impact of photon noise from exozodiacal emission on both visible-light and<br />
mid-IR instruments, we summarize recent observational results, discuss theoretical expectations for the<br />
level of exozodiacal emission, and describe future observational programs relevant to determining the<br />
level of exozodiacal emission around typical <strong>TPF</strong> targets. We will show that <strong>TPF</strong>-I can operate in the<br />
25
C HAPTER 2<br />
presence of zodiacal clouds 10–20 times as bright as our own without undue difficulty and that systems<br />
with this amount of emission, or considerably less, are likely to be common among mature solar-type<br />
stars.<br />
2.6.2 Zodiacal Emission as a Source of Noise<br />
For a cryogenic nulling interferometer operating in an orbit near 1 AU the three dominant noise sources<br />
are (Angel and Woolf 1997; Beichman and Velusamy 1999): stellar light that leaks past the<br />
interferometric null because of the finite diameter of the star, S *,Leak ; emission from the local zodiacal<br />
dust, S LZ ; and emission from the exozodiacal dust in the target system that leaks past the interferometer,<br />
S EZ,Leak (Figure 2-8). At short wavelengths (
E X O P L A N E T S CIENCE<br />
Figure 2-8. The variation of signal-to-noise for planet detection as a function of exozodiacal<br />
brightness for three cases: <strong>TPF</strong>-I for large grain emission; <strong>TPF</strong>-I for small grain emission; and<br />
<strong>TPF</strong>-C. The parameter μ LZ is the ratio of surface brightness of the exozodiacal cloud in the<br />
habitable zone of a target star to that of our own zodiacal cloud.<br />
In the absence of more detailed information, the vertical optical depth of the exozodiacal dust in any<br />
system can be parameterized as a factor, μ EZ , times the optical depth of our Solar System's dust cloud.<br />
The emission from exozodiacal dust is then S EZ (r) = 2 μ EZ τ LZ (r) B ν (T(r)) Ω tel , where the factor of two<br />
accounts for the fact that in the exozodiacal case we are looking through the entire cloud and not from the<br />
vantage of the mid-plane as we do locally. By analogy with the local zodiacal cloud (Backman 1998), the<br />
vertical optical depth is assumed to fall off radially as τ LZ (r) = τ LZ (1 AU)r AU -0.3 . We also take<br />
T(r) = T 0 r AU β as the equilibrium temperature for grains heated by stellar radiation and emitting in the<br />
infrared. Typical 1-AU values of (T 0 , β) for large and small silicate grains are (255 K, –0.5) and (362 K,<br />
–0.4), respectively (Draine and Lee 1984; Backman and Paresce 1993; Beichman et al. 2006a). For<br />
reference, it is worth nothing that the integrated signal from a Solar-System-equivalent exozodiacal cloud<br />
is a few hundred times brighter than the signal from an Earth twin. The effect of exozodiacal emission is,<br />
however, reduced by the fringe pattern of the interferometer which attenuates the bright central portion of<br />
the exozodiacal disk. To account for this effect, we incorporate the fringe pattern of a particular nulling<br />
scheme, ξ(θ,ϕ), where θ and ϕ are the radial and azimuthal variables, respectively. In the simplified case<br />
of a face-on disk, the signal reaching the detector, S EZ, Leak , is then given by the integral of S EZ over the<br />
fringe pattern and the telescope solid angle:<br />
27
C HAPTER 2<br />
S<br />
EZ<br />
2π<br />
∫<br />
θ max<br />
∫<br />
, Leak<br />
( d)<br />
= 2 dϕ<br />
μEZτ<br />
EZ<br />
( θd)<br />
Bν<br />
( T ( θd))<br />
ξ ( θ,<br />
ϕ)<br />
θdθ<br />
0<br />
0<br />
for a star at a distance d pc. Figure 2-8 (Beichman et al. 2006b) shows an illustrative example of the effect<br />
of EZ emission on the S/N of a <strong>TPF</strong>-I detection where we have adopted the fringe pattern, ξ(θ,ϕ), for the<br />
Dual Chopped Bracewell interferometer (Lay and Dubovitsky 2004; Lay et al. 2005) and a diffractionlimited<br />
beam size of θ max = 0.6λ/D = 0.5" for a D = 3-m telescope at 12 μm. For a solar-type star at d = 10<br />
pc, the ratio of the exozodiacal contribution to that from the Solar System's own dust is 0.06 μ EZ or 0.24<br />
μ EZ , for large and small grains, respectively. For a particular temperature, smaller grains are located<br />
further from their parent star than the cooler, larger (blackbody) grains; and thus, emission from small<br />
grains is less effectively blocked by the central null of an interferometer. Small grains thus produce more<br />
noise than large grains for a given total exozodiacal brightness. Figure 2-8 shows the variation of S/N as a<br />
function of exozodiacal brightness, μ EZ , for two grain sizes. When the surface density of the exozodiacal<br />
dust, μ EZ , is 10 times that of our Solar System, corresponding to a 20-fold brightness increase, the S/N is<br />
reduced by a factor of ~2–3, necessitating an increase in integration time by a factor of ~4–9 to recover<br />
the original S/N. Since many hours of integration time are needed to detect an Earth-sized planet in the<br />
presence of a μ EZ = 1 cloud, and days to carry out a spectroscopic program, it is clear that studying<br />
systems with μ EZ = 10–20 will be difficult.<br />
A similar analysis can be used to assess the<br />
effects of exozodiacal emission at visible<br />
wavelengths; for details see Beichman et al.<br />
(2006b) or Brown (2005). Figure 2-8 also shows<br />
the variation in S/N for <strong>TPF</strong>-C assuming a 3.5- ×<br />
8-m telescope observing a planet 25 mag fainter<br />
than a V = 4.5 mag solar twin at 10 pc and a local<br />
zodiacal brightness of 0.1 MJy sr -1 at 0.55 μm<br />
(Bernstein, Freedman, and Madore 2002). As<br />
with the interferometer, the effect of zodiacal<br />
emission in the target system is to lower the S/N<br />
by a factor of ~2–3 at μ EZ = 10. In this particular<br />
example, the relative effect of the exozodiacal<br />
emission is more pronounced for the <strong>TPF</strong>-C than<br />
for the <strong>TPF</strong>-I because the interferometer is<br />
dominated by the strong local zodiacal<br />
background until very bright exozodiacal<br />
emission is observed. The intrinsic background<br />
level within the visible-light coronagraph is low<br />
(by assumption of an excellent 10 -10 rejection<br />
ratio) so that the exozodiacal emission quickly<br />
plays a significant role in setting the system<br />
noise.<br />
Figure 2-9. Use of a four-element interferometer<br />
with chopping allows rejection of symmetrical<br />
emission from the zodiacal cloud and allows<br />
detection of three planets.<br />
28
E X O P L A N E T S CIENCE<br />
Figure 2-10. Upper limits (or detections) of zodiacal emission in the habitable zone based on<br />
Spitzer/IRS results are around 1,000 times the level of our Solar System (Beichman et al. 2006a).<br />
A more detailed examination of the effects of the exozodiacal emission on the detectability of planets<br />
would include inclination effects as well as the possibly confusing effects of structures within the zodiacal<br />
cloud. It is already well known, for example, that observing an inclined exozodiacal disk though a simple<br />
Bracewell interferometer produces a nulled output signal that mimics that of a planet (Angel and Woolf<br />
1997). This is one of main drivers for more complex modulation schemes such as the Oases (Angel and<br />
Woolf 1997), Dual Chopped Bracewell, and X-array designs (Lay 2005), and composite designs<br />
(Velusamy, Beichman, and Shao 1999). As these studies have shown, with sufficient angular resolution<br />
and uv-plane complexity, structures such as wakes and gaps can be distinguished from the signatures of<br />
planets. This necessity, along with the need to distinguish multiple planets in a system, is one of the key<br />
drivers for observing with <strong>TPF</strong>-I using a variety of baselines up to at least 100 m. As suggested by<br />
Figure 2-9, good angular resolution and diversity in uv-plane coverage are an important aspect of properly<br />
characterizing planetary systems.<br />
A simple order of magnitude estimate of the brightness of structures in the zodiacal cloud shows that this<br />
confusion will not be a problem in clouds like our own, μ EZ ~1, but it could become one in brighter clouds.<br />
<strong>TPF</strong> will image or resolve away structures larger than Θ <strong>TPF</strong> ~λ/B=25 mas at 10 μm on a B~100 m<br />
baseline, or roughly 0.25 AU at 10 pc. The flux density associated with an over-density in a patch of<br />
zodiacal emission, I EZ ~2εμ ΕΖ I LZ , would result in a noise level of σ struct ~ 2εμ ΕΖ I LZ Θ <strong>TPF</strong> 2 . Resonant<br />
structures associated with planets in our Solar System are a few tenths of an AU in size with overdensities<br />
of ~10% for a wake behind the Earth (Dermott et al. 1994; Reach et al. 1995; Backman 1998)<br />
29
C HAPTER 2<br />
Figure 2-11. Observations constrain different distributions of exozodiacal emission (Bryden et<br />
al. 2006). The grey areas are ruled out at the 3-sigma level. Three different luminosity functions<br />
are shown to the right.<br />
and
E X O P L A N E T S CIENCE<br />
among A and early F stars (~25%) and smaller for stars later than K (
C HAPTER 2<br />
Figure 2-12. Models of the evolution of total exo-zodiacal emission as a function of time as a function<br />
of total disk mass (left) and disk location (right; Wyatt et al. 2006) show that after a few Gyr solar-type<br />
stars with disks interior to 10 AU reach zodiacal levels comparable to our own, f = L disk /L = 10 -7 .<br />
case corresponds to the location of our asteroid belt and reproduces almost exactly the level of emission<br />
in our own Solar System, L disk /L * , a few × 10 -7 . The 10- and 30-AU cases predict a higher level of zodiacal<br />
emission than is presently seen in the Solar System; however, this model ignores the clearing action of the<br />
Jupiter and Saturn which would either have incorporated much of the planetesimal material into a solid<br />
core, or ejected the material. While our theoretical understanding is far from complete, curves such as<br />
these, validated by present and future observations of disks, should give us confidence that the expected<br />
level of emission will be at or below the desired ~10–20 EZ level needed for the detection of terrestrial<br />
planets around many nearby stars.<br />
2.6.5 Prospects for Future Observations<br />
It will take observations with facilities other than Spitzer to push to lower levels of zodiacal emission. The<br />
Herschel telescope will measure cold Kuiper Belt disks to Solar System levels while ground-based<br />
interferometers, such as the Keck Interferometer (KI) and the Large Binocular Telescope Interferometers<br />
(LBTI), will spatially suppress the stellar component to measure definitively the 10-μm exozodiacal<br />
emission that arises in the habitable zone and that might cause problems for <strong>TPF</strong>.<br />
The Keck Interferometer (KI; Colavita et al. 2006) is currently implementing a nulling interferometry<br />
mode at 10 μm specifically targeted at observations of exozodiacal emission around nearby mainsequence<br />
stars. In this mode, the central star is placed on a destructive fringe, allowing detection of the<br />
much fainter surrounding emission while rejecting intense photospheric emission. The size scales probed<br />
by 85-meter baseline in this mode are 25 to 200 mas, corresponding to the habitable zone for many<br />
nearby main-sequence stars. Initial observations using this mode have been made, and the final detection<br />
level is expected to be 100 times the level of our Solar System with a sensitivity limit of 2 Jy for the<br />
target star. At this sensitivity limit and within the declination range of the telescope, there are 53 mainsequence<br />
stars with A through K spectral types, which can be observed with KI, including: 10 A stars, 18<br />
F stars, 10 G stars, and 6 K stars. The KI observations will be sensitive to dust in the habitable zone at a<br />
factor of 10 lower levels than the Spitzer observations. The sample of available stars will determine the<br />
32
E X O P L A N E T S CIENCE<br />
frequency of disks at the 100 Solar System level and will test the theoretically predicted spatial<br />
distributions such as those described in section D and Figure 4-5. In a few years after implementation of<br />
the KI nuller, the Large Binocular Telescope Interferometers (LBTI; Hinz et al. 2003) will become<br />
operational. LBTI also works at 10 μm and eliminates the stellar flux through interferometric<br />
combination, but its unique design of co-mounted telescopes on a 15-meter baseline gives it a large fieldof-view<br />
with ~100 mas resolution. LBTI is expected to push to sensitivity levels a factor of 10 below<br />
KI's and complement KI by looking at material at ~2 times greater distances from the star.<br />
With Spitzer and Herschel measuring excesses from 200 to 20 μm down to near Solar System levels, and<br />
with KI and LBTI pushing to near Solar System levels at 10 μm, we can confidently expect to understand<br />
the statistical properties of <strong>TPF</strong> targets well enough to know whether or not there exists, as theory<br />
suggests, a population of stars with low levels of zodiacal emission. We will also have detailed<br />
information on many individual targets, particularly at northern declinations accessible to KI and LBTI.<br />
2.7 References<br />
2.7.1 Science Requirements<br />
Kasting, J. F., Catling, D., “Evolution of a habitable planet,” Ann. Rev. Astron. Astrophys. 41, 429–463<br />
(2003).<br />
Turnbull, M. C., The Searth for Habitable Worlds: From the Terrestrial Planet Finder to SETI, Ph.D.<br />
dissertation, University of Arizona, Tucson, AZ (2004).<br />
2.7.2 Physical Characterization<br />
Gaidos, E., and Williams, D. M., “Seasonality on terrestrial extrasolar planets: inferring obliquity and<br />
surface conditions from infrared light curves,” New Astronomy 10, 67–77 (2004).<br />
Harrington, J., Hansen, B. M., Luszcz, S. H., Seager, S., Deming, D., Menou, K., Cho, J. Y.-K., and<br />
Richardson, L. J., “Phase dependent infrared brightness of the extrasolar planet υ Andromedae b,”<br />
Science 314, 623–626 (2006).<br />
Selsis, F., “The atmosphere of terrestrial exoplanets: Detection and characterization,” Extrasolar Planets<br />
Today and Tomorrow, ASP Con. Ser. 321, Beaulieu, J.-P., Le Cavalier des Etangs, A., and<br />
Terquem, C., editors, Astronomical Society of the Pacific, San Francisco, CA, 170–182 (2004).<br />
2.7.3 Biomarkers<br />
Beichman, C. A., Woolf, N. J., and Lindensmith, C. A., eds., The Terrestrial Planet Finder (<strong>TPF</strong>): a<br />
<strong>NASA</strong> Origins <strong>Program</strong> to Search for Habitable Planets, JPL Publication 99-3, Jet Propulsion<br />
Laboratory, Pasadena, California (1999).<br />
33
C HAPTER 2<br />
Beichman, C. A., Fridlund, M. , Traub, W. A., Stapelfledt, K. R., Quirrenbach, A., and Seager, S.<br />
“Comparative planetology and the search for life beyond the solar system,” Protostars and<br />
Planets V, editors Riepurth, B., et al., University of Arizona Press, Tucson, AZ, 915–928 (2006).<br />
Bordé, P. J., and Traub, W. A., “High-contrast imaging from space: Speckle nulling in a low-aberration<br />
regime,” Astrophys. J. 638, 488–498 (2006).<br />
Christensen, P. R., and Pearl, J. C., “Initial data from the Mars Global Surveyor thermal emission<br />
spectrometer experiment: Observations of the Earth,” J. Geophys. Res. 102, 10875–10880 (1997).<br />
Des Marais, D. J., Harwit, M. O., Jucks, K. W., Kasting, J. F., Lin, D. N. C., Lunine, J. I., Schneider, J.,<br />
Seager, S., Traub, W. A., and Woolf, N. J., “Remote sensing of planetary properties and<br />
biosignatures of extrasolar terrestrial planets,” Astrobiology 2, 153–181 (2002).<br />
Falkowski, P. G., “Evolution: Tracing oxygen’s imprint on Earth’s metabolic evolution,” Science 311,<br />
1724–1725 (2006).<br />
Fridlund, M., DARWIN The InfraRed Space Interferometer, ESA-SCI (2000)12, 47 European Space<br />
Agency: Noordwijk, The Netherlands (2000).<br />
Jucks K. W., Johnson D. G., Chance K. V., Traub W. A., Margitan J. J., Osterman G. B., Salawitch R. J.,<br />
and Sasano, Y., “Observations of OH, HO 2 , H 2 O, and O 3 in the upper stratosphere: implications<br />
for HOx photochemistry,” Geophysical Research Letters 25, 3935–3938 (1998).<br />
Kaltenegger, L., Eiroa, C., Stankov, A., Fridlund, M., “The Darwin target star catalog,” Astron.<br />
Astrophys. submitted (2007).<br />
Kaltenegger, L., and Fridlund, M., “The Darwin mission: Search for extra-solar planets,” Advances in<br />
Space Research 36, 1114–1122 (2005).<br />
Kaltenegger, L., Traub, W. A., and Jucks, K., “Spectral evolution of an Earth-like planet,” Astrophys. J.<br />
in press (2007).<br />
Kasting, J. F., and Catling, D., “Evolution of a habitable planet,” Ann. Rev. Astron. Astrophys. 41, 429–<br />
463 (2003).<br />
Lovelock J. E., “Thermodynamics and the recognition of alien biospheres [and discussion],” Proc. R. Soc.<br />
Lond. B 189, 167–181 (1975).<br />
Meadows, V., “Modelling the diversity of extrasolar planets,” Direct Imaging of <strong>Exoplanet</strong>s: Science and<br />
Techniques, Proc. IAU Colloquium 200, editors Aime C., and Vakili, F., Cambridge University<br />
Press, Cambridge, UK, pp. 25–34 (2006).<br />
Montanes-Rodriguez P., Pallé, E., and Goode P. R., “Globally integrated measurements of the Earth’s<br />
visible spectral albedo,” Astrophys. J. 629, 1175–1182 (2005).<br />
34
E X O P L A N E T S CIENCE<br />
Owen, T., “The search for early forms of life in other planetary systems,” in Strategies for Search for Life<br />
in the Universe, editors Papagiannis, M. D., Springer: Dordrecht, The Netherlands, p. 177 (1980).<br />
Pavlov, A. A., Kasting, J. F., Brown, L. L., Rages, K. A., Freedman, R., “Greenhouse warming by CH4 in<br />
the atmosphere of early Earth,” J. Geophys. Res. 105, 11981–11990 (2000).<br />
Schindler, T. L., and Kasting, J. F., “Synthetic spectra of simulated terrestrial atmospheres containing<br />
possible biomarker gases,” Icarus 145, 262–271 (2000).<br />
Segura, A., Krelove, K., Kasting, J. F., Sommerlatt, D., Meadows V., Crisp D., Cohen, M., and Mlawer,<br />
E., “Ozone concentrations and ultraviolet fluxes on Earth-like planets around other stars,”<br />
Astrobiology 3, 689–708 (2003).<br />
Segura, A., Kasting, J. F., Meadows, V., Cohen, M., Scalo, J., Crisp, D., Butler, R. A. H., and Tinetti, G.,<br />
“Biosignatures from Earth-like planets around M Dwarfs,” Astrobiology 5, 706–725 (2005).<br />
Selsis, F., “Physics of Planets I: Darwin and the Atmospheres of Terrestrial Planets,” Darwin and<br />
Astronomy: The Infrared Space Interferometer, ESA SP 451, European Space Agency,<br />
Noordwijk, The Netherlands, pp. 133–140 (2000).<br />
Selsis, F., Despois, D., and Parisot, J.-P., “Signature of life on exoplanets: Can Darwin produce false<br />
positive detections”Astron. Astrophys. 388, 985–1003 (2002).<br />
Tinetti, G., Meadows, V. S., Crisp, D., Kiang, N., Bosc, E., Fishbein, E., and Turnbull, M. C.,<br />
“Detectability of planetary characteristics in disk-averaged spectra. I: The Earth model,”<br />
Astrobiology 6, 34–47 (2006).<br />
Tinetti, G., Meadows, V. S., Crisp, D., Kiang, N., Kahn, B. H., Bosc, E., Fishbein, E., Velusamy, T., and<br />
Turnbull, M. C., “Detectability of planetary characteristics in disk-averaged spectra. II: Synthetic<br />
spectra and light-curves of Earth,” Astrobiology 6, 881–900 (2006).<br />
Traub, W. A., and Jucks, K., “A possible aeronomy of extrasolar terrestrial planets,” Atmospheres in the<br />
Solar System: Comparative Aeronomy, AGU Monograph Series 130, editors Mendillo, M., Nagy<br />
A., and Waite J. H., American Geophysical Union: Washington, DC, 369–380 (2002).<br />
Turnbull, M. C., Traub, W. A., Jucks, K. W., Woolf, N. J., Meyer, M. R., Gorlova, N., Skrutskie, M. F.,<br />
and Wilson, J. C., “Spectrum of a habitable world: Earthshine in the near-infrared,” Astrophys. J.<br />
644, 551–559 (2006).<br />
Woolf, N. J., Smith, P. S., Traub, W. A., and Jucks, K. W., “The spectrum of Earthshine: A pale blue dot<br />
observed from the ground,” Astrophys. J. 574, 430–433 (2002).<br />
35
C HAPTER 2<br />
2.7.4 Suitable Targets<br />
European Space Agency, The Hipparcos and Tycho Catalogues, ESA SP-1200 (1997)<br />
http://www.rssd.esa.int/Hipparcos/catalog.html<br />
2.7.5 Exozodiacal Dust<br />
Angel, R. and Woolf, N., “An imaging interferometer to study extrasolar planets,” Astrophys. J. 475,<br />
373–379 (1997).<br />
Backman, D. E., “Terrestrial-temperature dust around main sequence stars,” in Exozodiacal Dust<br />
Workshop; Conference Proceedings, editors. Backman, D. E., Caroff, L. J., Sandford, S. A.,<br />
Wooden, D. H., p. 107 (1998).<br />
Backman, D. E. and Paresce, F., “Main-sequence stars with circumstellar solid material — The Vega<br />
phenomenon,” in Protostars and Planets III, Space Telescope Science Institute, Baltimore, MD,<br />
pp. 1253–1304 (1993).<br />
Beichman, C. A., Woolf, N. J., Lindensmith, C. A. eds., The Terrestrial Planet Finder (<strong>TPF</strong>) : a <strong>NASA</strong><br />
Origins <strong>Program</strong> to search for habitable planets, JPL Publication, 99-3, Pasadena, CA (1999).<br />
Beichman, C. A. and Velusamy, T. “Sensitivity of the <strong>TPF</strong> Interferometer for planet detection,” Working<br />
on the Fringe: Optical and IR Interferometry from Ground and Space, editors. S. Unwin and R.<br />
Stachnik, Proc. ASP Conference 194, Brigham Young University Press, Provo, Utah, pp. 408–<br />
422, (1999).<br />
Beichman, C. A., Bryden, G., Rieke, G. H., et al., “Planets and infrared excesses: Preliminary results from<br />
the Spitzer MIPS survey of solar-type stars,” Astrophys. J. 622, 1160–1170 (2005).<br />
Beichman, C. A., Bryden, G., Gautier, T. N., et al., “An excess due to small grains around the nearby K0<br />
V star HD 69830: Asteroid or cometary debris” Astrophys. J. 626, 1061–1069 (2005).<br />
Beichman, C. A., Tanner, A., Bryden, G., et al., “IRA spectra of solar-type stars: A search for asteroid<br />
belt analogs,” Astrophys. J. 639, 1166–1176 (2006).<br />
Beichman, C. A., Bryden, G., Stapelfeldt, K. R., et al., “New debris disks around nearby main-sequence<br />
stars,” Astrophys. J. 652, 1674–1693 (2006b).<br />
Bernstein, R. A., Freedman, W. F., and Madore, B. F., “The first detections of the extragalactic<br />
background light at 3000, 5500, and 8000 angstroms,” Astrophys. J. 571, 85–106 (2002).<br />
Brown, R. A., “Single-visit photometric and obscurational completeness,” Astrophys. J. 624, 1010–1024<br />
(2005).<br />
Bryden, G., Beichman, C. A., Trilling, D. E., et al., “Frequency of debris disks around solar-type stars:<br />
First results from a Spitzer MIPS survey,” Astrophys. J. 636, 1098–1113 (2006).<br />
36
E X O P L A N E T S CIENCE<br />
Chen, C., Sargent, B. A., Bohac, C., et al., “Spitzer IRS spectroscopy of IRAS-discovered debris disks,”<br />
Astrophys. J. Supp. Ser. 166, 351–377 (2006).<br />
Colavita, M., Serabyn, G., Wizinowich, P. L., and Akeson, R. L., “Nulling at the Keck Interferometer,” in<br />
Advances in Stellar Interferometry, Edited by J. D. Monnier, M. Schöller, and W. C. Danchi,<br />
Proc SPIE 6268, 03 (2006).<br />
Dermott, S. F., Jayaraman, S., Xu, Y. L., Gustafson, B. A. S., and Liou, J. C., “A circumsolar ring of<br />
asteroidal dust in resonant lock with the Earth,” Nature 369, 719–723 (1994).<br />
Draine, B. T. and Lee, H. M., “Optical properties of interstellar graphite and silicate grains,” Astrophys. J.<br />
285, 89–108 (1984).<br />
Dominik, D., and Decin, G., “Age dependence of the Vega phenomenon: Theory,” Astrophys. J. 598,<br />
626–635 (2003).<br />
Fajardo-Acosta, S. B., Beichman, C. A., and Cutri, R. M., “Discovery of new candidate Vega-type<br />
systems from IRAS and the 2 Micron All-Sky Survey,” Astrophys. J. 538, L155–L158 (2000).<br />
Hinz, P. M., Angel, R.. P., McCarthy, D. W., Hoffmann, W.F., and Peng, C. Y., “The Large Binocular<br />
Telescope Interferometer,” in Interferometry for Optical Astronomy II. Edited by Wesley A.<br />
Traub. Proc. SPIE 4838, 108–112 (2003).<br />
Jura, M., Chen, C. H., Furlan, E., et al., “Mid-infrared spectra of dust debris around main-sequence stars,”<br />
Astrophys. J. 154, 453–457 (2004).<br />
Kelsall, T., Weiland, J. L., Franz, B. A., et al., “The COBE Diffuse Infrared Background Experiment<br />
search for the cosmic infrared background. II. Model of the interplanetary dust cloud,” Astrophys.<br />
J. 508, 44–73 (1998).<br />
Kuchner, M. J., Reach, W., and Brown, M., “A search for resonant structures in the zodiacal cloud with<br />
COBE DIRBE: The Mars wake and Jupiter’s Trojan clouds,” Icarus 145, 44–52 (2000).<br />
Laureijs, R., Jourdain de Muizon, M., Leech, K., et al., “A 25 micron search for Vega-like disks around<br />
main-sequence stars with ISO,” Astron. Astrophys. 387, L285–L293 (2002).<br />
Lay, O., Gunter, S. M., Hamlin, L. A., et al., “Architecture trade study for the Terrestrial Planet Finder<br />
Interferometer,” Techniques and Instrumentation for Detection of <strong>Exoplanet</strong>s II, Edited by D. R.<br />
Coulter, Proc. SPIE 5905, 59052 (2005).<br />
Lay, O., and Dubovitsky, S., “Nulling interferometers: the importance of systematic errors and the X-<br />
array configuration,” in New Frontiers in Stellar Interferometry, Proc. SPIE 5491, editor W. A.<br />
Traub, 874–885 (2004).<br />
Mannings, V., and Barlow, M. J., “Candidate main-sequence stars with debris disks: A new sample of<br />
Vega-like sources,” Astrophys. J. 497, 330–341 (1998).<br />
37
C HAPTER 2<br />
Reach, W. T., Franz, B. A., Weiland, J. L., et al., “Observational confirmation of a circumstellar dust ring<br />
by the COBE satellite,” Nature 374, 521–523 (1995).<br />
Rieke, G. R., Su, K. Y. L., Stansberry, J. A., et al., “Decay of planetary debris disks,” Astrophys. J. 620,<br />
1010–1026 (2005).<br />
Siegler, N., Muzerolle, J., Young, E. T., et al., “Spitzer 24 micron observations of open cluster IC 2391<br />
and debris disk evolution of FGK stars,” Astrophys. J. 654, 580–594 (2007).<br />
Su, K. Y. L., Rieke, G. H., Stansberry, J. A., Trilling, D. E., Protostars and Planets V, editors. Reipurth,<br />
B., Jewitt, D., and Keil, K., LPI Contribution No. 1286, p. 8118, University of Arizona Press,<br />
Tucson, AZ, (2007).<br />
Velusamy, T., Beichman, C. A., and Shao, M., “A dual three-element nulling interferometer for <strong>TPF</strong>,” in<br />
Working on the Fringe: Optical and IR Interferometry From Ground and Space, Proc. ASP<br />
Conference 194, Edited by S. Unwin and R. Stachnik. ISBN: 1-58381-020-X, p. 430–436 (1999).<br />
Wyatt, M. C., Smith, R., Greaves, J. S., Beichman, C. A., Bryden, G., Lisse, C. M., “Transience of hot<br />
dust around Sun-like stars,” Astrophys. J. accepted (2006).<br />
38
G ENERAL A STROPHYSICS<br />
3 Transforming Astrophysics with <strong>TPF</strong>-I<br />
The milli-arcsecond (mas) angular resolution of <strong>TPF</strong>-I/Darwin in the 5- to 15-μm wavelength regime will<br />
enable transformational science in the era of the Atacama Large Millimeter Array ALMA) and (groundbased<br />
extremely large telescopes (ELTs) in the visual to near-IR wavelength region) on topics ranging<br />
from our home planetary system; star and planet formation, evolution, and death; the formation,<br />
evolution, and growth of black holes; and the birth and evolution of galaxies over cosmic time. <strong>TPF</strong>-<br />
I/Darwin will provide milli-arcsecond resolution, a gain of about two to three orders of magnitude over<br />
filled aperture telescopes such as the James Webb Space Telescope (JWST). This mission will enable<br />
imaging to at least 20th magnitude around a wavelength of 10 μm, a million-fold improvement over the<br />
best ground-based sensitivity in this wavelength regime. These gains in resolution and sensitivity are<br />
comparable to those attained at visual wavelengths over the last four centuries as astronomy evolved from<br />
the naked-eye era before Galileo to the charged couple device (CCD) era in the latter half of the twentieth<br />
century. The <strong>TPF</strong>-I/Darwin infrared interferometer will be a pathfinder to ultra-high-resolution imaging<br />
in space.<br />
3.1 Introduction<br />
Infrared interferormetry in space with a constellation of telescopes and an image combiner flying in<br />
formation will be a gateway to milli-arcsecond (mas) angular resolution astronomical imaging and<br />
spectroscopy of the future. The <strong>TPF</strong>-I from <strong>NASA</strong> and Darwin from ESA are the first formation-flying<br />
interferometer concepts to be seriously investigated for both technical feasibility and scientific potential.<br />
These missions were conceived for a very specific goal – the detection and characterization of terrestrial<br />
planets in terrestrial orbits around about 150 spectral-type G stars within 30 pc of the Sun. However, the<br />
stringent performance requirements imposed on these missions by planet finding and characterization<br />
makes <strong>TPF</strong>-I/Darwin a powerful tool for many other astronomical applications. Space enables phasestability<br />
unachievable by Earth-based system that will be limited only by the metrology used in<br />
establishing the flux-collector-combiner separations. <strong>TPF</strong>-I/Darwin will be a technological pathfinder for<br />
future micro-and nano-arcsecond resolution instruments at infrared and other wavelengths. Here, we<br />
explore the general astrophysics enabled by milli-arcsecond angular resolution and micro-jansky<br />
sensitivity in the 5 to 15 μm wavelength regime with possible extension to wavelengths from 2 to 30 μm.<br />
We start by summarizing the assumed parameters of the <strong>TPF</strong>-I/Darwin interferometer. Consider the four<br />
science areas where this instrument will provide revolutionary observations, followed by a listing of<br />
additional research areas where high-impact observations could be made.<br />
39
C HAPTER 3<br />
3.1.1 Darwin/<strong>TPF</strong>-I Properties<br />
We assume a baseline <strong>TPF</strong>-I architecture consisting of four free-flying telescopes plus a beam combiner.<br />
The apertures are approximately D = 4 meters, the maximum baselines are approximately B = 500 m,<br />
and the operating wavelength range is between 5 and 15 μm with a spectral resolution of at least R = 50.<br />
Although the current prime-mission (planet finding) requires a nulling interferometer configuration, we<br />
will assume that imaging interferometry without nulling will also be possible. Additionally, we will<br />
consider upgrades in spectral resolution, wavelength coverage, baseline length, and multi-beam<br />
interferometry of two or more objects distributed over the field-of-view of each telescope.<br />
These parameters translate to a primary-beam (diffraction spot size of each telescope) θ P = λ / D = 0.25”<br />
to 0.75”, and a synthesized beam (interferometric angular resolution) of θ I = λ / B = 0.002 to 0.006” (2 to<br />
6 milli-arcseconds or mas) over the assumed operating wavelength range of 5 to 15 μm and B = 500 m.<br />
The sensitivity is about 20th magnitude, and may be considerably better if the coherence time can be<br />
improved.<br />
Extension of the operating wavelength range down to 2 μm (the wavelength beyond which thermal<br />
emission from the atmosphere makes ground-based observations difficult for all but the brightest<br />
sources), or extension of maximum baselines to 1,000 m would enable an angular resolution of 1 mas to<br />
be reached or exceeded. Note however, that excess thermal noise introduced by the increasing visibility<br />
of the thermal shields of the telescopes on long baselines will likely result in loss of sensitivity and<br />
contrast. Studies are therefore needed to assess the maximum baselines that can be used. The nulling<br />
mode will be useful in the study of the environments of bright object such as quasars, stars, and luminous<br />
pre- and post-main sequence objects, such as the Becklin-Neugebauer object in Orion or the massive post-<br />
LBV, eta-Carinae. Multi-object interferometry will enable the precise determination of relative positions,<br />
parallax, and proper motions.<br />
Ground-based interferometers suffer from the randomly phased fluctuations introduced by the<br />
atmosphere. Even extreme adaptive optics (AO) systems will exhibit residual phase noise that limits<br />
sensitivity. In comparison, space-based interferometry has the enormous advantage of exquisite phasestability<br />
limited only by metrology and path-length-difference compensation errors. On-the-fly recording<br />
of fringes will enable excellent sampling of the u-v plane required for high-fidelity imaging of complex<br />
sources.<br />
3.1.2 Diagnostics in the <strong>TPF</strong>-I/Darwin Bands<br />
The wavelength region between 5 and 15 μm is rich in diagnostics for probing physical conditions in<br />
astrophysical environments. Emission from warm dust in the range 100 to 1,000 K, the characteristic<br />
temperature of grains located in and near the habitable zones of stars (about 0.3 to 3 AU for Solarluminosity<br />
stars) peaks in this spectral domain. <strong>TPF</strong>-I/Darwin will be the most powerful probe of dust in<br />
star forming-cloud cores heated by young stars and clusters. This instrument is ideally suited for imaging<br />
of the region from 0.1 to 10 AU where planets form around Solar-mass stars located within a few hundred<br />
pc of the Sun, warm dust located from 10 to 1000 AU around massive stars located anywhere in the<br />
Galaxy, and the dust surrounding the Active Galactic Nucleus (AGN) and extragalactic star-forming<br />
regions in our locale in the Universe.<br />
40
G ENERAL A STROPHYSICS<br />
A variety of molecular bands and solid-state features (arising from grains and ices) will provide powerful<br />
diagnostics of composition and molecular structure (amorphous vs. crystalline). This wavelength region<br />
contains bands produced by PAHs polycyclic aromatic hydrocarbons (PAHs), the bands of amorphous<br />
and crystalline silicate dust around 10 μm, and a variety of ice features due to water, carbon monoxide,<br />
carbon dioxide, and methanol, molecular vibrational bands of many common organic and inorganic<br />
substances, fine structure lines of many elements and ions, and the spectral lines of atomic and molecular<br />
hydrogen.<br />
<strong>TPF</strong>- I/Darwin will be highly complementary to giant ground-based facilities being deployed during the<br />
next decades. The ALMA (Atacama Large Millimeter Array) will probe molecules and cold dust in the<br />
outer portions of protostellar environments and disks beyond 10 AU, but with only 0.05” to 0.5”<br />
resolution. Future ground-based ELTs (Extremely Large Telescopes with apertures of 30 m or more that<br />
are equipped with extreme AO) may probe the hot gas, dust, and plasma that shine below a wavelength 2<br />
μm with a resolution approaching 0.01”. While ELTs will probe stars and plasmas at a narrow band<br />
centered at 10 μm, <strong>TPF</strong>-I/Darwin will be uniquely suited to investigate warm dust, ices, molecules, and a<br />
variety of atomic and ionic species with at least an order of magnitude better angular resolution over the<br />
much wider spectral range of 5–15 μm. <strong>TPF</strong>-I/Darwin is especially well suited for probing in the<br />
planetary region between 0.1 and 10 AU around forming, maturing, and dying stars with more than an<br />
order of magnitude better angular resolution than any other conceived facility.<br />
The <strong>TPF</strong>-I/Darwin spectral domain contains the lines of may ions and atoms (H, He, Ne, Ar), including<br />
several ionization stages of hard-to-deplete noble gases, the rotational and vibrational transitions of a<br />
variety of molecules including H 2 , forbidden fine-structure lines, continua from dust, and a variety of<br />
solid state features from ices and PAH molecules (at wavelengths of 6.2, 7.7, 8.6, 11.3, 12.7, 14.2, and<br />
16.2 μm). Combined, these tracers can be used to map temperature, density, metallically and kinematics<br />
of gas at intermediate to cold temperatures (10 to over 10,000 K) and moderate densities (10 to over 10 6<br />
cm -3 ).<br />
Extension of the wavelength coverage from about 2 μm to as long as 30 μm should be considered.<br />
Extension to the shorter wavelengths would permit overlap with ground-based AO-assisted<br />
interferometry, improved resolution, and access to the vibrational transitions of H 2 , CO, and other<br />
molecules and ices. Extension to longer wavelengths would permit observations of cooler, more<br />
embedded targets; would provide access to the 24-μm iron complex, the ground-rotational transitions of<br />
H 2 , and the 20 micron silicate feature, and would extend the use of PAH, [Ne II], Brackett α-based<br />
distance, and metallicity determinations to very high redshifts. Darwin/<strong>TPF</strong>-I capabilities will<br />
revolutionize our ability to observe the formation and maturation of stars, planetary systems, and star<br />
clusters ranging from loose associations to super-star clusters that evolve into globular systems.<br />
The spectral energy distributions of normal nearby galaxies peak at a rest-frame wavelength of a few<br />
microns. For galaxies at high redshifts, this peak will be shifted to observed wavelengths of 5−10 µm.<br />
High resolution sensitive measurements at 5−10 µm are crucial for tracing the formation and evolution of<br />
high redshift galaxies. At the highest redshifts, rest-frame visual wavelength emission will fall into the<br />
Darwin/<strong>TPF</strong>-I windows. Therefore, this mission will diagnose the very first stars and galaxies to emerge<br />
from the “Dark Ages” of the Universe with an angular resolution sufficient to resolve the ionized bubbles<br />
they create (star-forming regions of ioninzed hydrogen, HII) and other global properties. A central<br />
feature of <strong>TPF</strong>-I/Darwin is its ability to resolve a length scale of order 100 pc – the size of giant molecular<br />
41
C HAPTER 3<br />
clouds or an OB association – anywhere in the Universe, enabling the detailed investigation of the cosmic<br />
evolution of galactic structure.<br />
3.2 Transformational Astrophysics<br />
We highlight four research areas where <strong>TPF</strong>-I/Darwin will make revolutionary advances, namely:<br />
• Star and planet formation and early evolution.<br />
• Stellar and planetary death and cosmic recycling.<br />
• The formation, evolution, and growth of black holes.<br />
• Galaxy formation and evolution over cosmic time.<br />
3.2.1 Star and Planet Formation and Early Evolution<br />
Darwin/<strong>TPF</strong>-I will have a resolution of 1 AU at a distance of 500 pc, the distance to the Orion massive<br />
star-forming region. In the nearest regions of low-mass star formation (~125 to 150 pc), 0.25 AU<br />
structures will be resolved.<br />
Stars are the fundamental building blocks of the baryonic Universe. Short-lived massive stars and<br />
clusters are responsible for the nucleosynthesis of elements heavier than helium, for the ultraviolet (UV)<br />
radiation that re-ionized the Universe at the end of the cosmic Dark Ages, and for regulating the physical<br />
and chemical state of the interstellar media (ISM) of galaxies. Their powerful stellar winds and terminal<br />
supernova explosions dominate the generation of random motions in the ISM. Long-lived low-mass stars<br />
provide the stable environment needed for the formation of planetary systems and the evolution of life.<br />
Figure 3-1. Schematic of the circumstellar environment of an isolated young star.<br />
42
G ENERAL A STROPHYSICS<br />
Figure 3-2. HST image of the giant galactic nebula NGC 3603 shows the various stages of the life<br />
cycles of stars in one single view, from a starburst cluster of young hot Wolf-Rayet stars and early<br />
O-type stars (center) to the evolved blue supergiant Sher 25 (upper right), which marks the end of the<br />
life cycle.<br />
Star formation is the process that determines the mass-spectrum (initial mass function —IMF; Kroupa<br />
2000) of stars. Star formation determines how galaxies consume their interstellar media and how they<br />
convert this material into long-lived low-mass stars, and star formation controls the rate and nature of<br />
galactic evolution.<br />
In the standard model of star formation (Figure 3-1), the inside-out gravitational collapse of a rotating<br />
cloud core leads to the formation of a protostellar core on a time-scale of about 10 4 years. The infall of<br />
high-angular-momentum gas forms a spinning, circumstellar disk through which most of the star’s final<br />
mass spirals onto the protostar on a time-scale of ~10 5 years. Entrained and dynamo-generated magnetic<br />
fields launch powerful jets and bipolar outflows along the rotation axis of the system for a period of order<br />
10 5 to 10 6 years (Reipurth and Bally 2001). Planetary systems form and mature from remnants of the disk<br />
in about 10 6 to 10 8 years; low-mass stars reach the main-sequence (MS) in 10 7 to > 10 8 years (see the<br />
Grenoble stellar evolutionary tracks, Siess, Dofour, and Forestini 2000).<br />
During the last decade, observations have shown that most stars form in highly over-dense, but shortlived<br />
clusters that form from the collapsing and fragmenting cores of turbulent molecular clouds<br />
(MacLow and Klessen 2004). Furthermore, the birth and early evolution of most stars occurs in the close<br />
proximity of luminous, massive stars that irradiate the birth environments with intense UV radiation and<br />
which explode as supernovae on time-scales ranging from 3 to 40 Myr, the same time-scale on which<br />
43
C HAPTER 3<br />
Figure 3-3. Three possible geometries for the centers of T Tauri disks and synthetic images<br />
of these models in scattered light. <strong>TPF</strong>-I could distinguish among these possibilities, shedding<br />
light on the origin of close-in planets (Dejan Vinkovic, Princeton Univ.).<br />
planetary systems mature, their central stars reach the main-sequence, and birth clusters and associations<br />
disperse (Lada and Lada 2001; Adams et al. 2004). While in the standard model for the formation of lowmass<br />
stars, they evolve gradually from accreting (Class 0 and I) protostars into Class II and III T Tauri<br />
stars, in the modern clustered formation paradigm, catastrophic events such as dynamical interactions<br />
with sibling stars (Reipurth 2000; Tan 2004), evaporation of envelopes and disks by the intense radiation<br />
fields (Johnstone, Hollenbach, and Bally 1998), winds, and supernova explosions punctuate early stellar<br />
and planetary system evolution (Hollenbach et al. 2000). Contrary to being hazardous, UV radiation in<br />
from both the central protostar and nearby massive stars may actually promote the formation of<br />
planetesimals by selectively removing light gases and small particles (Throop and Bally 2005).<br />
Massive stars appear to be preferentially formed in ultra-dense proto-cluster environments where cluster -<br />
stellar densities are higher than 10 5 stars per cubic parsec. Interstellar separations are frequently less than<br />
a few thousand AU. Darwin/<strong>TPF</strong>-I 2- to 10- mas resolution in the thermal infrared will resolve a<br />
projected interstellar separation of 10 to 50 AU at a distance of 5 kpc, enabling the cores of embedded<br />
proto-clusters to be resolved, and their structure analyzed anywhere in the Galaxy. Does the high<br />
multiplicity fraction of massive stars originate in the primordial fragmentation of the parent cloud core, or<br />
does it develop later in the evolution of the cluster by means of stellar dynamical processes such as threebody<br />
encounters<br />
44
G ENERAL A STROPHYSICS<br />
Figure 3-4. A computer simulation showing how a protoplanetary disk surrounding a young star<br />
begins, in a relatively short time, to fragment and form gas giant planets with stable orbits<br />
(Courtesy of Lucio Mayer, ETH Zürich).<br />
Thermal IR interferometry will resolve the acceleration region where stellar winds are produced in premain-sequence<br />
stars, Wolf-Rayet stars, and giants. Many such systems are in multiple systems where<br />
phenomena associated with wind–wind interactions can be directly imaged. Interferometric spectroimaging<br />
of highly ionized species will provide unique diagnostics of these systems that will complement<br />
radio-wavelength observations.<br />
Darwin/<strong>TPF</strong>-I will resolve forming super-star clusters and starbursts in our Galaxy and in nearby<br />
galaxies. Milli-arcsecond angular resolution will enable <strong>TPF</strong>-I to peer inside clusters to determine the<br />
volume density of stars and to directly test formation models for the most massive stars in such systems,<br />
even when the clusters are still highly embedded and their stars are still accreting. Do massive stars sink<br />
rapidly to the cluster center due to on-going accretion and dynamical friction Do massive stars always<br />
form by accretion, or do stellar interactions and mergers contribute The multiplicity fraction of massive<br />
stars as a function of location within a cluster, and as a function of cluster age, will provide clues.<br />
<strong>TPF</strong>-I/Darwin will have the capability to resolve the structure of circumstellar and planet-forming disks,<br />
and to trace the shadows cast by the “dust walls” formed at the disk inner edge (Figure 3-3), spiral waves,<br />
gaps created by forming giant planets, and the compositional variations resulting from condensation<br />
sequences (Figure 3-4). The inner radii associated with the evaporation of various ices (such as water,<br />
ammonia, and methanol) should be detectable by their characteristic spectral bands. Polarization<br />
measurements will enable the measurement of magnetic field geometries by their power to align dust<br />
grains. These observations will produce direct tests of planetary system formation models to distinguish<br />
between competing paradigms, such as core-accretion and formation via gravitational instability.<br />
The ionization and shock fronts produced by ionizing radiation will be resolved and diagnosed by the<br />
analysis of spectral-line ratios. The highest resolution observations should resolve the inner regions<br />
where jets and disk winds are launched, thereby providing direct tests of outflow generation models. Are<br />
jets formed by ordinary stellar winds, the magnetic X-points where stellar magnetospheres interact with<br />
45
C HAPTER 3<br />
the circumstellar disk, or are they launched by magnetic fields entrained or dynamo-amplified in the disk<br />
itself Detection of molecular bands from simple molecules (as well as PAH and silicate features) will<br />
enable the characterization of chemical and physical gradients in disks.<br />
Darwin/<strong>TPF</strong>-I will be especially sensitive to young planets, which tend to be larger, hotter, and therefore<br />
brighter than mature objects. Forming gas and ice giants will be easy to detect. Even forming or young,<br />
rocky terrestrial planets are expected to be brighter, especially following recent accretion events or<br />
impacts.<br />
Observations of more mature planetary systems and debris disks with ages ranging from a few million to<br />
several hundred million years will lead to direct tests of planetary system evolution models. The<br />
Darwin/<strong>TPF</strong>-I planet-finding capability will enable the direct detection of forming and evolving planets.<br />
Large impacts on rocky planets are expected to produce global “lava oceans” that will glow at 10 μm for<br />
thousands of years. Thus, direct observations of the conditions following giant impacts and equivalents<br />
of the “Late-Phase Heavy Bombardment” suspected to have occurred about 800 Myr after the birth of our<br />
own Solar System may be observable in other planetary systems. Source selection would rely on the<br />
detection of extensive debris disks that may indicate a high rate of collisions.<br />
The Darwin/<strong>TPF</strong>-I observations of forming and evolving planetary systems will complement the prime<br />
mission of planet detection and characterization by providing direct tests of planet formation and<br />
evolution models.<br />
3.2.2 Stellar and Planetary Death and Cosmic Recycling<br />
As stars of all masses evolve off the main sequence, they develop cool, extended envelopes that reprocess<br />
most of the emitted starlight into infrared radiation observable with <strong>TPF</strong>-I. Low- and intermediate-mass<br />
stars (M = 0.8 − 8 M) make up more than 90 per cent of all the stars that have died in the Universe up to<br />
the present time. At the end of their main sequence life-time, they enter the high-luminosity asymptotic<br />
giant branch (AGB) phase. During the short so-called superwind phase, the stars eject their hydrogen-rich<br />
outer layers to reveal the chemically enriched deeper layers of the star. These stars obtain the highest<br />
luminosity and the largest diameter in their existence with the size or nearly an AU. AGB stars are<br />
expected to either vaporize, or swallow their planetary systems. Emission from silicates, silicon carbide<br />
(SiC), PAHs, and some ices will provide powerful probes of physical and chemical evolution of these<br />
objects. In the closest AGB stars, <strong>TPF</strong>-I/Darwin will resolve the photospheres; in more distant objects, it<br />
will probe their winds and dying planetary systems in great details.<br />
After this final burst of activity, these stars evolve into hot, compact white dwarfs with masses in the<br />
range of 0.6−1.4 M o . The expanding ejecta surrounding the star becomes ionized and forms a planetary<br />
nebula before dispersing into the interstellar medium (ISM).<br />
Recently, the Spitzer Space Telescope had detected infrared excess emission from about 15 to 20% of old<br />
white dwarf stars near the Sun (Reach et al. 2006; Mullally et al. 2006). This emission indicates the<br />
presence of debris disks consisting of mostly large-solid particles that have resisted being dragged into the<br />
central white dwarf by the Poynting-Robertson drag for the age of the white dwarf. Such debris disks<br />
surrounding aging white dwarfs may trace the remnants of planetary systems that were destroyed during<br />
the post-main-sequence red-giant phase of their parent stars. There are hints that in-spiraling solids may<br />
46
G ENERAL A STROPHYSICS<br />
Figure 3-5. Schematic of the atmospheric spatial structure and temperature profile of a<br />
typical Mira star (Reid and Menten 1997).<br />
be responsible for anomalous metal-abundances in white dwarf atmospheres. <strong>TPF</strong>-I/Darwin<br />
interferometric imaging may resolve these disks, determine their structure, and constrain their<br />
compositions. Such observations may shed independent light on the abundances of planetary systems and<br />
that have been destroyed millions to billions of years ago.<br />
AGB mass-loss (e.g., Zijlstra et al. 2006) determines the mass distribution of stellar remnants, including<br />
the lower mass limit of type II supernovae progenitors. Stellar mass loss also drives Galactic evolution<br />
through replenishment and chemical enrichment of the ISM. Such mass loss contributes roughly half the<br />
total gas recycled by all stars (Maeder 1992), creates an amount of carbon roughly equal to that produced<br />
by supernovae and Wolf-Rayet stars (Dray et al. 2003; Gavilán, Buell, and Mollá 2005), and is the main<br />
source of carbonaceous interstellar dust (Dwek 1998; Edmunds 2001).<br />
<strong>TPF</strong>-I/Darwin will resolve AGB stars at the distance of the Galactic center. These observations will<br />
directly measure the impacts of the high-pressure Galactic-center environments, radiation, and outflows<br />
on the structure of AGB star envelopes. VLA and ground-based [NeII] observations have already<br />
revealed cometary tails around some evolved stars such as IRS7 (Yusef-Zadeh and Morris 1991).<br />
Interferometry will enable the study of such tails to be used as diagnostics of the environments.<br />
There are about 200 moderately evolved AGB stars (Mira variables) known within 1 kpc. Both oxygenrich<br />
(M-type) and carbon-rich (C-type) AGB stars show spectral features around 9.7 µm and 11.3 µm due<br />
47
C HAPTER 3<br />
Figure 3-6. (Left panel) Astrometric positions and orbital fits for eight stars that show<br />
accelerated proper motion within the central 0.8” × 0.8” of the Galaxy (Ghez et al. 2003).<br />
(Right panel) Astrometric positions for a simulated sample of 100 stars detectable with<br />
<strong>TPF</strong>-I. Motions are over a 10-yr baseline assuming ten observations per year per star.<br />
to silicate particles and SiC grain as well as spectral lines from other atomic and molecular species. IRAS<br />
detected more than 10 5 new AGB candidates. The improved spectral resolution of ISO and Spitzer<br />
allowed the study of the AGB population of the Magellanic Clouds and other Local Group galaxies at<br />
mid-infrared wavelengths.<br />
Darwin/<strong>TPF</strong>-I will detect the circumstellar envelope of AGB stars located well beyond the Local Group<br />
where these stars are being found photometrically as galaxy members (e.g., in the Sculptor group at 2.5<br />
Mpc and in the M81 group at 4 Mpc). Furthermore, Darwin/<strong>TPF</strong>-I will provide detailed maps of the<br />
distribution dust and gas within the envelopes of AGB stars within the Galaxy. This will be essential<br />
information to tie basic stellar parameters to the properties of mass-loss. This is not only important for the<br />
usage of the properties of mass loss for addressing key astrophysical questions (see above), but also to<br />
advance theoretical models (e.g. Sandin and Hofner 2003) that cannot predict mass-loss rates from stellar<br />
parameters. The later is largely due to the complicated physics of the interplay of stellar pulsation, shock<br />
waves, dust formation and radiation pressure which combined all drive the mass-loss.<br />
3.2.3 Formation, Evolution, and Growth of Black Holes<br />
How do black holes form Do they form first, and trigger the birth of galaxies around them, or do<br />
galaxies form first and stimulate the formation of black holes How do black holes grow Do they grow<br />
in a merger tree as galaxies collide, or do they accumulate their mass by hydrodynamic accretion from<br />
surrounding gas and stars in a single galaxy <strong>TPF</strong>-I will image the circum-nuclear disks of systems such<br />
as M106 (NGC 4258). The H 2 O maser disk in that galaxy requires significant IR pumping near 10 µm—<br />
thus its disk will be very bright. <strong>TPF</strong>-I will compliment ELT imaging. The high contrast between the<br />
AGN and the disk requires high-fidelity imaging: <strong>TPF</strong>-I will enable a search for the dominant mode of<br />
AGN feeding and probe the launch and collimation regions of AGN jets.<br />
48
G ENERAL A STROPHYSICS<br />
Figure 3-7. The 10-µm flux density (left) and angular scale (right) of dusty tori as a function of<br />
redshift. The lines indicated are for AGN as luminous and 10 and 100 times as luminous at 10 µm<br />
as NGC 1068. Also the fiducial flux density of an Earth at 10 pc is indicated.<br />
The Galactic center contains the nearest massive black hole (3.6 × 10 6 M o ), a uniquely dense star cluster<br />
containing up more that 10 7 stars/pc 3 , and a remarkable group of high-mass stars with Wolf-Rayet-like<br />
properties. Darwin/<strong>TPF</strong>-I will be able to trace the distribution of lower mass stars, and probe the<br />
distribution of dust and plasma in the in the immediate vicinity of the central black hole. A simulation of<br />
a possible sample of stars near the Galactic center is shown in Fig. 3-6.<br />
Galaxies contain exotic systems in which one or more stars orbits an exotic star or a collapsed object such<br />
as a white dwarf, neutron star, or black hole. Mass transfer can result is mass ejections in the form of<br />
excretion disks such as those seen around contact binaries and symbiotic systems. In others, mass transfer<br />
produces accretion disks, which drive powerful winds or jets. In accreting neutron-star or black-hole<br />
systems, mass transfer can produce relativistic jets which often mimic the behavior of quasars (hence the<br />
term micro-quasar). However, in these systems, phenomena occur on time-scales orders of magnitudes<br />
shorter than in the AGN. Exotic and symbiotic systems include massive stars that have undergone recent<br />
eruptions (such as eta Carinae), Roche-lobe overflow systems that have shed circumstellar disks (such as<br />
WeBo1), and micro-quasars (such as SS 433). Infrared emission can be produced by warm dust in<br />
circumstellar tori, by molecules, by highly ionized species such as neon and argon, or by continuum<br />
processes such as synchrotron radiation or the inverse Compton effect. Darwin/<strong>TPF</strong>-I will revolutionize<br />
the investigation of these systems by probing the inner AU-scale regions where these flows are energized.<br />
Supermassive black holes are found in the centers of many galaxies. When these objects are fed by<br />
strong accretion flows, they eject relativistic jets and powerful winds; these phenomena can drive intense<br />
luminosity. Darwin/<strong>TPF</strong>-I will enable the diagnosis of physical and chemical properties of active galactic<br />
nuclei (AGN) at all redshifts. Its 2- to 10-mas angular resolution will produce resolutions ranging from<br />
under 1 pc for the nearest AGN to tens of pc for the most distant. Darwin/<strong>TPF</strong>-I will provide a look at the<br />
stellar and interstellar environments of these 10 6 to 10 10 Solar mass black holes in unprecedented detail.<br />
Emission lines (such as Br α, [Ne II], and Argon) will trace the ionized and shock-excited components of<br />
the circum-nuclear environment. Are mini-spirals, such as that seen in our own Milky Way, common<br />
49
C HAPTER 3<br />
Continuum interferometry will map the circum-nuclear distributions of stars. Synchrotron emission<br />
produced by relativistic particles gyrating in nuclear magnetic fields will trace non-thermal continua. The<br />
distributions of silicate dust, ices, and PAHs can be used to trace the warm-gas and dust distributions in<br />
the circum-nuclear environments of AGN with unprecedented resolution.<br />
Interferometric measurements of the lensed objects may provide the highest resolution studies of stars and<br />
interstellar media in the distant Universe. By combining the milli-arcsecond resolution of Darwin/<strong>TPF</strong>-I<br />
with the natural magnification of a gravitational lens, linear resolutions of less than 1 pc can be achieved<br />
in the high-redshift Universe.<br />
3.2.4 Galaxy Formation and Evolution<br />
Current galaxy-formation models assume that the large-scale mass distribution in the early Universe is<br />
driven by the gravity exerted by dark matter. The evolution of the dark-matter distribution follows from<br />
conditions in the early Universe. Gas dynamics, shocks, and radiative heating and cooling all play<br />
fundamental roles in the emergence of the first stars and proto-galaxies. The first stars are thought to be<br />
massive (10 to 100 Solar masses), and hotter than their modern counterparts. Thus, the first stars are<br />
though to create giant HII regions whose red-shifted hydrogen and helium emission lines should be<br />
readily observable by Darwin/<strong>TPF</strong>-I.<br />
While <strong>NASA</strong>’s JWST is expected to make the first detections of these objects, its angular resolution will<br />
be limited to the diffraction spot size of its 6.5-m primary mirror, about 0.2”. Darwin/<strong>TPF</strong>-I will resolve<br />
scales of order 10 to 100 pc at all redshifts. The IR response will enable the detection of rest-frame near-<br />
IR to visual wavelength emission at very high redshifts (z > 5). Thus, Darwin/<strong>TPF</strong>-I will provide the<br />
hundred-fold gain in resolution needed to resolve these primordial HII regions. Models suggest that the<br />
birth of the very first stars may inhibit further star formation until these primordial stars die, a few million<br />
years after their birth. High angular resolution follow-up of JWST-detected “First Light” objects by<br />
Darwin/<strong>TPF</strong>-I will test the current paradigm for the formation of the first stars. Are they truly isolated,<br />
single objects, or are they surrounded by young clusters of stars<br />
Soon after the formation of the very first stars, their supernovae will pollute the surrounding medium,<br />
causing the condensation of dust. Dust heated by starlight, and the HII regions surrounding the very first<br />
stars will be visible and resolvable by Darwin/<strong>TPF</strong>-I. Subsequent growth of primordial galaxies occurs<br />
by a combination of merging and in-fall of primordial gas.<br />
The baryonic matter in young galaxies is expected to be dominated by gas. As the first generations of<br />
stars explode in supernova explosions, they will pollute their environments with metals. Dust and<br />
molecule formation will drive star formation to increasingly resemble star formation in the current epoch.<br />
Hot dust, giant HII regions, and warm molecular clouds are expected to emerge. Darwin/<strong>TPF</strong>-I will play<br />
a crucial role in mapping the distributions of stars, clusters, super-giants, post-main sequence stars,<br />
supernovae, and emerging black holes in the highest redshift galaxies being detected at sub-mm<br />
wavelengths with today’s instruments (Smail et al. 1997, Hughes et al. 1998, Barger et al. 1998) or in the<br />
future by the Atacama Large Millimeter Array (ALMA) and in the thermal IR by JWST.<br />
Darwin/<strong>TPF</strong>-I will be especially sensitive to forming super-star clusters, the suspected progenitors of<br />
today’s globular cluster systems. While JWST may detect galaxies containing such clusters at high red-<br />
50
G ENERAL A STROPHYSICS<br />
Figure 3-8. Effective radii measured in the K-band as a function of redshift for a subsample<br />
of FIRES/VLTsurvey with K AB > 25. <strong>TPF</strong>-I can resolve most of these galaxies, many more<br />
than JWST.<br />
shifts, Darwin/<strong>TPF</strong>-I will be needed to determine their galactic locations, to determine their relationships<br />
to other galactic structures, and to characterize their global properties.<br />
Current theory, modeling, and observations indicate that galaxies grow and evolve by merging. How do<br />
these processes impact global and local star formation and the formation, growth, and evolution of black<br />
holes Darwin/<strong>TPF</strong>-I will obtain milli-arcsecond resolution observations that can be directly compared to<br />
models.<br />
Scheduling flexibility will enable Darwin/<strong>TPF</strong>-I to respond to targets of opportunity and transient<br />
phenomena such as ultra-high redshift, possibly population III, supernovae, flaring activity in the AGN,<br />
or even currently unanticipated time-dependent phenomena. Darwin/<strong>TPF</strong>-I will provide milli-arsecond<br />
characterization of these phenomena and their immediate environments.<br />
Galactic evolution will remain a central theme of astrophysics for decades to come. The investigation of<br />
large samples of distant galaxies will be crucial for such studies. The “Lyman break technique” has<br />
defined samples of more than 1000 galaxies between 2.5 < z < 5 (e.g., Steidel et al. 1999). Lyα and Hα<br />
emitting galaxies have also been found with deep imaging through narrow-band filters (e.g.. Venemans et<br />
al. 2002; Kurk et al. 2003) or by selection of very red J−K colors (Franx et al. 2003). Spectroscopic<br />
follow-up of Submillimetre Common-User Bolometer Array (SCUBA) galaxies, radio galaxies (e.g. de<br />
Breuck et al. 2001), and X-ray emitters (e.g. Rosati et al. 2002) have yielded significant samples of z > 2<br />
objects.<br />
51
C HAPTER 3<br />
Figure 3-9: Simulated images of a M51-type galaxy at z = 3 as observed with JWST (left) and Darwin<br />
(right).<br />
The Faint Infra Red Extra-galactic Survey (FIRES, Franx et al. 2000), a very deep infrared survey<br />
centered on the Hubble Deep Field South using the Infrared Spectrometer and Array Camera (ISAAC)<br />
instrument mounted on the Very Large Telescope (VLT) (Moorwood 1997) demonstrates that there will<br />
be plenty of targets to investigate with Darwin/<strong>TPF</strong>-I. With integration times of more than 33 hours for<br />
each of the infrared bands (J, H, and K), limiting AB magnitudes of 26.0, 24.9, and 24.5, respectively, are<br />
reached (Labbé et al. 2003). Recently, this field has been imaged at 3 to 8 μm with the Infrared Array<br />
Camera (IRAC) on the Spitzer Space Telescope with the aim of accurately determining stellar masses for<br />
distant red galaxies (see Fig. 3-8 and Labbé et al. 2005). From these studies, we conclude that, for the<br />
brighter objects, it is possible to obtain good images with a signal-to-noise ratio of 50 within integration<br />
times of 25–50 hours using Darwin/<strong>TPF</strong>-I.<br />
Darwin/<strong>TPF</strong>-I will resolve individual OB associations, massive star clusters, and their associated giant<br />
HII regions. By observing multiple fields, interferometric maps of entire galaxies can be obtained at<br />
selected redshifts. By carefully selecting targets of a specific type, the evolution of galaxy structures can<br />
be tracered as functions of redshift and environment. The evolution of metallicity with cosmic age (and<br />
redshift) can be mapped using the various molecular tracers, ices, PAH bands, and noble-gas lines that<br />
fall into the pass-band of Darwin/<strong>TPF</strong>-I.<br />
52
G ENERAL A STROPHYSICS<br />
3.2.5 Other Science Opportunities<br />
• Our home planetary system: <strong>TPF</strong>-I/Darwin will easily measure the diameters, and properties of<br />
dwarf planets (Kuiper Belt Objects), moons, asteroids, and comet nuclei. Low-resolution spectrophotometry<br />
will constraint the natures of surfaces, atmospheres, and environments.<br />
• Parallax and proper motions in the Galactic Plane: Establish a network of Galactic fiducial<br />
distance markers using IR-bright stars.<br />
• Resolve milli-arcsecond separation of multiple stars: Search for compact binaries formed<br />
during the dynamical decay of non-hierarchical multiple star systems and the ejection of high<br />
velocity stars in embedded young clusters.<br />
• Are there intermediate black Holes (IMBHs) in the Galactic Center Is there a 1000–10,000<br />
Solar mass black hole in the IRS13 cluster in the GC, or in other clusters in this region The<br />
presence of IMBHs may explain how dynamical friction has enabled the migration of massive<br />
stars into the immediate vicinity of SgrA*. <strong>TPF</strong>-I will measure the mass functions and measure<br />
proper motions of cool stars and red-giants in the IRS 13 cluster, complementing measurements<br />
with ELTs to determine the presence or absence of IMBHs.<br />
• Image stellar micro-lensing events: (target of opportunity, TOO, program). Another unique<br />
application for <strong>TPF</strong>-I will be resolving micro-lensing events detected in future infrared galactic<br />
plane surveys. Currently, most microlensing surveys are executed in the visible wavelengths;<br />
thus, they have been limited to fields out of the galactic plane (e.g.,the galactic Halo and the<br />
Large Magellanic Cloud). However, infrared detection is necessary to observe inner bulge stars<br />
or to investigate the massive astronomical compact halo object MACHO population in the central<br />
galaxy. <strong>TPF</strong>-I/Darwin will have the resolution to resolve some of the lensing events allowing the<br />
mass-distance ambiguity to be lifted in the gravitational lens model (Boden et al. 1988; Dalal and<br />
Lane 2003) and to detect the lensing star directly in some cases (Nguyen et al. 2004).<br />
• Excretions disk and exotic high luminosity objects in the Milky Way and the Local Group:<br />
Eta-Carinae-like objects, LBVs, Be star excretion disks, and other objects.<br />
• Micro-quasars: <strong>TPF</strong>-I/Darwin will probe excretion disks produced by Roche-Lobe overflow<br />
and trace the inner portions of relativistic jets by means of IR synchrotron emission and ions<br />
entrained in the jet sheath.<br />
• SNe: <strong>TPF</strong>-I/Darwin will be able to image the formation and evolution of dust in supernova ejecta<br />
and trace the structure of the circumstellar environment into which the blast is propagating. The<br />
dust, molecules, atoms, and ions launched by the supernova progenitor are illuminated by both<br />
the supernova flash and by the advancing shock front of the ejecta. Over a wide range of<br />
conditions, the resulting emission from the circumstellar environment peaks in the IR.<br />
• Dark Matter and dark energy: Darwin/<strong>TPF</strong>-I studies of gravitational lensing by galaxy<br />
clusters, AGN, and ordinary galaxies may provide a unique tool for probing the nature of dark<br />
matter. Measurements of background time-variable objects in gravitationally lensed systems will<br />
enable accurate characterizations of differential time-delays along different ray paths, giving<br />
clues about the geometry of the space-time in the lensing objects. These measurements, when<br />
made with milli-arcsecond resolution, will provide unprecedented constraints on the structure of<br />
dark matter haloes.<br />
53
C HAPTER 3<br />
3.3 Conclusions<br />
Darwin/<strong>TPF</strong>-I will open a gateway to future space-based interferometry to deliver ever increasing angular<br />
resolution throughout the electromagnetic spectrum. The baseline design will provide order-of-magnitude<br />
improvements in angular resolution over any other instrument. Combined with sensitivity to objects as<br />
faint as magnitude 20, Darwin/<strong>TPF</strong>-I capabilities have the potential for revolutionary advances in all areas<br />
of astrophysics and planetary science. This mission will transform our understanding of galaxy formation<br />
and evolution, stellar and planetary system origins, the cycles of matter and energy in the cosmos; and it<br />
will enable the detailed mapping of surfaces and weather patterns in Solar System objects. The utility of<br />
this instrument for general astrophysics and planetary science will only be limited by the lack of available<br />
observing time.<br />
Acknowledgements: We thank Marc Kuchner for providing selected material from the <strong>NASA</strong> / JPL<br />
Publication 05-01, General Astrophysics and Comparative Planetology with the Terrestrial Planet Finder<br />
Missions.<br />
3.4 References<br />
Adams, F. C., Proszkow, E. M., Fatuzzo, M., and Myers, P. C., “Early evolution of stellar groups and<br />
clusters: Environmental effects on forming planetary systems,” Astrophys. J. 641, 504–525<br />
(2006).<br />
Barger, A. J., Cowie, L. L., Sanders, D. B., et al., “Submillimetre-wavelength detection of dusty starforming<br />
galaxies at high redshift,” Nature 394, 248–251 (1998).<br />
Boden, A. F., Shao, M., and van Buren, D., “Astrometric observations of MACHO gravitational<br />
microlensing,” Astrophys. J. 502, 538–549 (1998).<br />
Dalal, N., and Lane, B. F., “Bringing closure to microlensing mass measurements,” Astrophys. J. 589,<br />
199–209 (2003).<br />
De Breuck, C., van Breugel, W., Röttgering, H., et al., “Spectroscopy of ultra-steep-spectrum radio<br />
sources,” Astron. J. 121, 1241–1265 (2001).<br />
Dray, L. M., Tout, C. A., Karakas, A. I., and Lattanzio, J. C., “Chemical enrichment by Wolf-Rayet and<br />
asymptotic giant branch stars,” Mon. Not. R. Astron. Soc. 338, 973–989 (2003).<br />
Dwek, E., “The evolution and elemental abundances in the gas and dust phases of the Galaxy,” Astrophys.<br />
J. 501, 643–665 (1998).<br />
Edmunds, M. G., “An elementary model for the dust cycle in galaxies,” Mon. Not. R. Astron. Soc. 328,<br />
223–236 (2001).<br />
Franx, M., Labbé, I., Rudnick, G., et al., “A significant population of red, near-infrared high-redshift<br />
galaxies,” Astrophys. J. 587, L79–L82 (2003).<br />
54
G ENERAL A STROPHYSICS<br />
Gavilán, M., Buell, J. F., and Mollá, M., “Low and intermediate mass star yields: The evolution of carbon<br />
abundances,” Astron. Astrophys. 432, 861–877 (2005).<br />
Ghez, A. M., Salim, S., Hornstein, S. D., et al., “Stellar orbits around the Galactic central black hole,”<br />
Astrophys. J. 620, 744–757 (2005).<br />
Granato, G., Danese, L., and Franceschini, A., “Thick tori around active galactic nuclei: The case for<br />
extended tori and consequences for their x-ray and infrared emission,” Astrophys. J. 486, 147–<br />
159 (1997).<br />
Hollenbach, D. J., Yorke, H. W., and Johnstone, D., “Disk dispersal around young stars,” in Protostars<br />
and Planets IV, editors, Mannings, V., Boss, A. P., and Russell, S. S., University of Arizona<br />
Press: Tucson, AZ, 401 (2000).<br />
Hughes, D. H., Serjeant, S., Dunlop, J., et al., “High-redshift star formation in the Hubble Deep Field<br />
revealed by a submillimeter-wavelength survey,” Nature 394, 241–247 (1998).<br />
Johnstone, D., Hollenbach, D., and Bally, J., “Photoevaporation of disks and clumps by nearby massive<br />
stars: Application to disk destruction in the Orion nebula,” Astrophys. J. 499, 758–776 (1998).<br />
Kroupa, P., “The initial mass function of stars: Evidence for uniformity in variable systems,” Science 295,<br />
82–91 (2002).<br />
Labbé, I., Franx, M., Rudnick, G., et al., “Ultradeep near-infrared ISAAC observations of the Hubble<br />
Deep Field South: Observations, reduction, multicolor catalog, and photometric redshifts,”<br />
Astron. J. 125, 1107–1123 (2003).<br />
Labbé, I., Huang, J., Franx, M., et al., “IRAC mid-infrared imaging of the Hubble Deep Field-South: Star<br />
formation histories and stellar masses of red galaxies at z>2,” Astrophys. J. 624, L81–L84 (2005).<br />
Lada, C. J., and Lada, E. A., “Embedded clusters in molecular clouds,” Ann. Rev. Astron. Astrop. 41, 57–<br />
115 (2003).<br />
Maeder, A., “Stellar yields as a function of initial metallicity and mass limit for black hole formation,”<br />
Astron. Astrophys. 264, 105–120 (1992).<br />
MacLow, M.-M., and Klessen, R. S., “Control of star formation by supersonic turbulence,” Reviews of<br />
Modern Physics 76, 125–194 (2004).<br />
Moorwood, A. F., “ISAAC: a 1–5 μm imager/spectrometer for the VLT,” Optical Telescopes of Today<br />
and Tomorrow, Proc. SPIE 2871, Ardeberg; A. L. editor, 1146–1151 (1997).<br />
Mullally, F., Kilic, M., Reach, W. T., et. al., “A Spitzer white dwarf infrared survey,” Astrophys. J. Supp.<br />
Ser. astro-ph/0611588 (2006).<br />
55
C HAPTER 3<br />
Nguyen, H. T., Kallivayalil, N., Werner, M. W., Alcock, C., Patten, B. M., and Stern, D., “Spitzer Space<br />
Telescope observations of the aftermath of microlensing event MACHO-LMC-5,” Astrophys. J.<br />
Supp. Ser. 154, 266–270 (2004).<br />
Reach, W. T., Kuchner, M. J., von Hippel, T., Burrows, A., Mullally, F., Kilic, M., and Winget, D. E.,<br />
“The dust cloud around the white dwarf G29-38,” Astrophys. J. 635, L161–L164 (2005).<br />
Reid, M. J., and Menten, K. M., “Radio photospheres of long-period variable stars,” Astrophys. J. 476,<br />
327–346 (1997).<br />
Reipurth, B., “Disintegrating multiple systems in early stellar evolution,” Astron. J. 120, 3177–3191<br />
(2000).<br />
Reipurth, B., and Bally, J., “Herbig-Haro flows: Probes of early stellar evolution,” Ann. Rev. Astron.<br />
Astrophys. 39, 403–455 (2001).<br />
Rosati, P., Tozzi, P., Giacconi, R., et al., “Chandra Deep Field South: The 1 million second exposure,”<br />
Astrophys. J. 566, 667–674 (2002).<br />
Röttgering, H. J. A., D’Arcio, L., Eiroa, C., et al. “Astrophysical Imaging with the Darwin IR<br />
interferometer,” Towards Other Earths: Darwin/<strong>TPF</strong> and the Search for Extrasolar Terrestrial<br />
Planets, Proc. ESA-SP 539, European Space Agency: Noordwijk, The Netherlands, pp. 299–308<br />
(2003).<br />
Sandin, C. and Höfner, S., “Three-component modeling of C-rich AGB star winds. I. Method and first<br />
results,” Astron. Astrophys. 398, 253–266 (2003).<br />
Siess, L., Dufour, E., and Forestini, M., “An internet server for pre-main sequence tracks of low- and<br />
intermediate-mass stars,” Astron. Astrophys. 358, 593–599 (2000).<br />
(http://astropc0.ulb.ac.be/~siess/index.html)<br />
Smail, I., Ivison, R. J., and Blain, A. W., “A deep sub-millimeter survey of lensing clusters: A new<br />
window on galaxy formation and evolution,” Astrophys. J. 490, L5–L8 (1997).<br />
Steidel, C. C., Adelberger, K. L., Giavalisco, M., Dickinson, M., and Pettini, M., “Lyman-break galaxies<br />
at z>4 and the evolution of the ultraviolet luminosity density at high redshift,” Astrophys. J. 519,<br />
1–17 (1999).<br />
Tan, J. C., Krumholz, M. R., and McKee, C. F., “Equilibrium star cluster formation,” Astrophys. J. 641,<br />
L121–124 (2006).<br />
Tan, J. C, “The Becklin-Neugebauer Object as a runaway B star, ejected 4000 years ago from the θ1<br />
Orionis C system,” Astrophys. J. 607, L47–L50 (2004).<br />
Throop, H. B., and Bally, J., “Can photoevaporation trigger planetesimal formation” Astrophys. J. 623,<br />
L149–L152 (2005).<br />
56
G ENERAL A STROPHYSICS<br />
Venemans, B. P., Kurk, J. D., Miley, G. K., et al., “The most distant structure of galaxies known: A<br />
protocluster at z=4.1,” Astrophys. J. 569, L11–L14 (2002).<br />
Yusef-Zadeh, F., and Morris, M., “A windswept cometary tail on the Galactic supergiant IRS 7,”<br />
Astrophys. J. 371, L59–L62 (1991).<br />
Zijlstra A. A., Matsuura, M., Wood, P. R., et al., “A Spitzer mid-infrared spectral survey of mass-losing<br />
carbon stars in the Large Magellanic Cloud,” Mon. Not. R. Astron. Soc. 370, 1961–1978 (2006).<br />
57
D ESIGN AND A R C H I T E C T U R E T RADE S TUDIES<br />
4 Design and Architecture Trade Studies<br />
There are many different ways in which a mid-IR nulling interferometer can be implemented, each with<br />
strengths and weaknesses. This chapter describes the main issues involved and the trade study that was<br />
conducted to select the best configuration. The first section describes the principle of operation of a<br />
nulling interferometer observing planets around nearby stars. Section 4.2 introduces the performance<br />
models that are used to assess the capability of each design. The configurations considered are outlined in<br />
Section 4.3. Subsequent sections address key elements of the trade: aperture diameter and array size<br />
(Section 4.4), co-planar vs. non-co-planar arrays (Section 4.5), beam combiner design (Section 4.6), the<br />
impact of stray light (Section 4.7), the nature and mitigation of instability noise (Section 4.8), and the<br />
imaging properties of these phased arrays (Section 4.9). These elements are all combined in the trade<br />
study that was conducted in 2004 to select the best architecture as summarized in Section 4.10.<br />
4.1 Principle of Operation<br />
In this section we describe how planet photons can be isolated from their parent star using a nulling<br />
interferometer.<br />
Figure 4-1 shows the simplest nulling interferometer – the single Bracewell configuration – proposed by<br />
Bracewell in 1979. This comprises two collecting apertures separated by baseline length B, phased such<br />
that the light from an on-axis source is canceled in the single-mode spatial filter at the beam combiner<br />
output. This is the nulled or dark output port; all the on-axis photons exit from the bright port to the left of<br />
the figure. To implement this scheme requires that a phase difference of π, independent of wavelength,<br />
be introduced between the two arms. The corresponding response of the interferometer on the sky is<br />
shown in both upper panels. It is a sinusoidal corrugation with a null running through the star at the<br />
center, and an angular periodicity of λ / B. If the array is rotated about the line of sight to the star, then<br />
this corrugated pattern rotates with respect to the star and the offset planet. While the star remains on the<br />
null, the planet follows the circular locus and the detected planet photon rate (lower right) rises and falls<br />
as the peaks and troughs of the response sweep through the location of the planet. The main disadvantage<br />
of the single Bracewell configuration is that the response on the sky is symmetric. As a result there is<br />
ambiguity in the location of the planet, the exozodiacal dust emission can have a similar signature to the<br />
planet, and (most important) it is not possible to implement an effective chopping scheme.<br />
59
C HAPTER 4<br />
4.5<br />
4<br />
3.5<br />
Response<br />
3<br />
2.5<br />
2<br />
1.5<br />
1<br />
0.5<br />
0<br />
-0.5 -0.4 -0.3 -0.2 -0.1 0 0.1 0.2 0.3 0.4 0.5<br />
θ x / μrad<br />
0 π<br />
0.70<br />
1 2<br />
Beamtrain<br />
optics<br />
Single-mode<br />
spatial filter<br />
Planet photon rate / s -1<br />
0.60<br />
0.50<br />
0.40<br />
0.30<br />
0.20<br />
0.10<br />
0.00<br />
0 1 2 3 4 5 6<br />
-0.10<br />
Array rotation angle / radians<br />
Figure 4-1. Single Bracewell configuration. The schematic of the interferometer is shown, lower<br />
left. A cross-section through the fringe response on the sky is shown, upper left. The fringe<br />
pattern is rotated around the star (hidden behind a central null) to detect a planet. The Planet<br />
follows the red locus as the array is rotated about line of sight to star, upper right; the<br />
corresponding photon rate vs. rotation angle is shown at lower right.<br />
These disadvantages are overcome with the Dual Bracewell configuration, an example of which is<br />
illustrated in Figure 4-2. There are now four collecting apertures. In this case, they are deployed along a<br />
line with equal spacing, phased as indicated. This configuration is essentially two single Bracewell<br />
baselines, which are then cross-combined with a third beam combiner with a relative phase shift of π / 2.<br />
The resulting response on the sky of this four-element phased array is shown in the top panel. The<br />
structure is more complex than before, and there is a clear left–right asymmetry. We will refer to this as<br />
the ‘left’ chop state, since there is a large peak in the response immediately to the left of the star.<br />
60
D ESIGN AND A R C H I T E C T U R E T RADE S TUDIES<br />
18<br />
16<br />
14<br />
Response<br />
12<br />
10<br />
8<br />
6<br />
4<br />
2<br />
0<br />
-0.5 -0.4 -0.3 -0.2 -0.1 0 0.1 0.2 0.3 0.4 0.5<br />
θ x / μrad<br />
0 +π/2 +π +3π/2<br />
0.70<br />
1 2 3 4<br />
Beamtrain<br />
optics<br />
Planet photon rate / s -1<br />
0.60<br />
0.50<br />
0.40<br />
0.30<br />
0.20<br />
0.10<br />
Single-mode<br />
-0.10<br />
spatial filter<br />
0.00<br />
0 1 2 3 4 5 6<br />
Array rotation angle / radians<br />
Figure 4-2. Dual Bracewell configuration. Lower left – schematic of interferometer; upper left –<br />
section through response on the sky; upper right – response on sky showing star at central null<br />
and planet offset. The Planet follows the red locus as the array is rotated about the line of sight to<br />
the star; the corresponding photon rate vs. rotation angle is shown at lower right.<br />
By negating the relative phases of the collectors, we obtain the mirror image response on the sky, as<br />
shown by the dashed line in Figure 4-3. This is the ‘right’ chop state. By switching the phasing of the<br />
instrument back and forth between these two states, the response on the sky is chopped from left to right<br />
and back. Taking the difference of the photon rates obtained gives the ‘chopped’ response denoted by the<br />
heavy line in Figure 4-3 (upper left panel) and the 3D view shown in the upper right. The chopped<br />
response is purely asymmetric, and the chopped photon rate has both positive and negative excursions. It<br />
is now possible to distinguish the side of the star on which the planet is located, and to discriminate<br />
against any symmetric sources of emission (e.g., star, exozodiacal dust). Any source of noise (e.g., stray<br />
light) that contributes equally to the left and right chop states is also removed.<br />
61
C HAPTER 4<br />
15<br />
10<br />
Response<br />
5<br />
0<br />
-0.5 -0.4 -0.3 -0.2 -0.1 0 0.1 0.2 0.3 0.4 0.5<br />
-5<br />
-10<br />
θ x / μrad<br />
0 ± π/2 ± π ± 3π/2<br />
0.40<br />
1 2 3 4<br />
Beamtrain<br />
optics<br />
Planet photon rate / s -1<br />
0.30<br />
0.20<br />
0.10<br />
0.00<br />
0 1 2 3 4 5 6<br />
-0.10<br />
-0.20<br />
Single-mode<br />
spatial filter<br />
-0.30<br />
-0.40<br />
Array rotation angle / radians<br />
Figure 4-3. Chopped dual Bracewell configuration. Lower left – schematic of interferometer;<br />
upper left – section through response on the sky; upper right – response on sky showing star at<br />
central null and planet offset. The planet follows the red locus as the array is rotated about the<br />
line of sight to the star; the corresponding photon rate vs. rotation angle is shown at lower right.<br />
The lower right panel of Figure 4-3 shows the variation of the chopped planet photon rate with the<br />
rotation angle of the array. This characteristic signature depends on the location of the planet relative to<br />
the star. As we change the ‘azimuthal’ offset of the planet, the signature pattern is shifted left or right with<br />
respect to the array rotation angle. Increasing the radial offset of the planet from the star means that the<br />
circular locus in the upper right panel of Figure 4-3 expands and passes through more peaks and valleys<br />
of the response, resulting in a signature pattern with higher ‘frequency’. In general, the data must be<br />
inverted to obtain the fluxes and locations of any planets that are present.<br />
The approach that has been used most commonly to do this is correlation mapping, first suggested by<br />
Angel and Woolf (1997). The principle is described in Figure 4-4. The process is closely analogous to the<br />
Fourier transform used for standard interferometric image synthesis. The cross-correlation process<br />
generates a “dirty map” (a term borrowed from radio synthesis imaging), which must be deconvolved to<br />
extract the point-like planets. The example in Figure 4-4 shows the noise-free dirty map for a single point<br />
source, and therefore represents the point-spread function (PSF) for the array. Because we are dealing<br />
62
D ESIGN AND A R C H I T E C T U R E T RADE S TUDIES<br />
Measured<br />
X-Array, 2:1, L = 80 m, λ = 10 μm<br />
Template 2<br />
Template 1<br />
Template 3<br />
Template 4<br />
Figure 4-4. Calculation of the cross-correlation map. The measured chopped planet photon rate vs.<br />
array rotation angle is shown in the upper left (no noise). For each possible location of a planet in the<br />
map, we can generate a template for the signal that would be obtained. This grid of templates is crosscorrelated<br />
with the measured signal, and the level of correlation is plotted as the grey-scale. Template<br />
1 would result from a planet in the upper left of the plot. The template is clearly a poor match to the<br />
measured signal, and the correlation is low. The highest correlation is obtained with template 2,<br />
which corresponds to the actual location of the planet. Template 3 is from a slightly offset location<br />
and has reduced correlation. Template 4 is from the opposite side of the star and has a perfect anticorrelation<br />
with the measured signal.<br />
with a phased array in which more than two collectors are combined in a single output, the PSF is more<br />
complex than for a standard imaging array in which each baseline is measured independently. There are<br />
satellite peaks in addition to the main peak, each of which has sideobes, and the PSF varies with the<br />
position in the map. Section 4.9.2 shows how these properties depend on the array configuration.<br />
Approaches to deconvolution are described in Section 4.9.4.<br />
Up to this point the analysis has been for a single wavelength. The measurements in practice span a broad<br />
range of wavelengths (nominally 6.5–18 μm). Independent of the desire to do spectroscopy, the<br />
measurement must be broken out into a number of spectroscopic channels to avoid smearing together the<br />
different planet signatures (photon vs. array-rotation angle) obtained at each wavelength. Each of these<br />
channels is processed independently to obtain a correlation map. The correlation maps can then be<br />
co-added (with appropriate weighting) to obtain the net correlation map. The wide range of wavelengths<br />
greatly extends the u-v coverage of the array, suppressing the sidelobes of the PSF.<br />
63
C HAPTER 4<br />
Channel SNR<br />
10.0<br />
Channel SNR<br />
1.38 / rotn<br />
# rotations<br />
53<br />
Planet signal rms<br />
Random noise<br />
Systematic noise<br />
0.091 /s 0.042 /s 0.051 /s<br />
Local Zodi leak Stellar size leak Null floor leak<br />
photon noise photon noise photon noise<br />
0.027 /s 0.033 /s 0.006 /s<br />
Planet signal rms Local Zodi leak Stellar size leak<br />
Null floor leak<br />
Null stability<br />
0.091 /s<br />
2.3E-08<br />
71 /s<br />
1.8E-05<br />
106 /s<br />
2.6E-05<br />
3 /s<br />
7.5E-07<br />
at planet harmonics<br />
1.3E-08<br />
Amp-phase error<br />
ΔA Δφ / rad<br />
0.13% 0.0011<br />
Dynamic<br />
Control systems<br />
Fringe track<br />
Metrology<br />
Tip/tilt<br />
Shear<br />
Disturbances<br />
Beamtrain<br />
Static<br />
Coatings<br />
Reflectivity<br />
Alignment<br />
Beam combiner<br />
π phase sh<br />
Figure 4-5. Simplified <strong>TPF</strong>-I error budget for the signal-to-noise ratio (SNR) required for ozone<br />
detection at 10-μm wavelength.<br />
4.2 Performance Models<br />
The two key performance models are described in this section: the Interferometer Performance<br />
Model (IPM) for predicting the SNR on a specified target; and the Star Count Model for<br />
estimating the number of targets that can be surveyed over the duration of the mission.<br />
4.2.1 Interferometer Performance Model<br />
The <strong>TPF</strong> Interferometer Performance Model (IPM) is maintained as a series of Excel spreadsheets and is<br />
used both to estimate the performance of different architectures, and to derive the requirements for the<br />
baseline design. The spreadsheet performance model is run as a bottom-up calculation; that is, the overall<br />
performance is calculated based on the specified low-level inputs (as opposed to a top-down suballocation<br />
approach). The inputs can be adjusted and balanced until the desired output performance is obtained, at<br />
which point the input values assumed become the requirements on the instrument.<br />
64
D ESIGN AND A R C H I T E C T U R E T RADE S TUDIES<br />
Total SNR<br />
Calculate<br />
all chans!<br />
41.15<br />
Weighted combination<br />
Channel #<br />
21<br />
Channel SNR<br />
Channel SNR<br />
Channel SNR<br />
Total time<br />
Calculate<br />
Chan # 21 32.41 days<br />
single chan!<br />
9.22 2800000 s<br />
SNR sqrt(n)<br />
n<br />
Channel SNR<br />
# rotations<br />
Rotation time<br />
Chan # 21<br />
1.23 / rotn 56<br />
50000 s<br />
P / RSS(R,S)<br />
P R S<br />
Planet signal rms<br />
Random noise<br />
Systematic noise<br />
8.05E-02 / s 5.52E-02 / s 3.50E-02 / s<br />
Cross-correlate sqrt[(A+B)/2T] RSS<br />
A B T<br />
Planet Template<br />
Planet vs time<br />
Detector noise<br />
Photon rate<br />
Rotation time<br />
Chop asymmetry<br />
Chop freq. terms<br />
equivalent<br />
/ s 21.0 / s 2.83E+02 / s 50000 s 3.18E-02 / s 1.46E-02 / s<br />
D 2 + E RSS RSS<br />
sum<br />
Analysis Read noise<br />
LZ<br />
Detector gain<br />
4/ read D 1.37E-02 / s<br />
Thermal<br />
Cross-terms<br />
Thermal<br />
2.85E-03 / s<br />
6.97E-05 / s 2.54E-02 / s 1.00E+00 / Hz Dark current<br />
EZ leak<br />
Stray<br />
Configuration<br />
E 2.85E-03 / s<br />
X-Array<br />
Co-phase<br />
5/ s Stray 5.27E+01 / s 1 / Hz @ f chop<br />
Poln angle<br />
1.00E+01 / s 2.27E-03 / s 2.53E-03 / s<br />
Stellar leak<br />
Amp & Phase<br />
Wavelength<br />
Ozone<br />
1.44E+02 / s Other chop asymm.<br />
1.86E-03 / s<br />
9.74 um<br />
Calculate!<br />
1.89E-02 / s<br />
Null floor<br />
Chop frequency<br />
Planet offset<br />
f chop<br />
5.61E+00 / s 0.1 Hz<br />
0.050 arcsec<br />
Analysis Analysis Analysis<br />
Planet per coll. Star per coll.<br />
EZ per coll.<br />
LZ per coll. EZ inc / pos angle<br />
Star diameter Noise coupling coeffs<br />
Configuration<br />
PSD(pol angle)<br />
30 deg lat 30 deg 15 pc<br />
X-Array<br />
9.39E-02 / s 1.01E+06 / s 1.04E+02 / s 7.13E+01 / s 30 deg 1.0 R sun 1.60E-03 rad rms<br />
Product Product Product Product<br />
Cross-correlation<br />
Planet flux Stellar flux<br />
EZ flux<br />
LZ flux<br />
Null power spectrum<br />
Planet power spectrum<br />
contributions<br />
Calculate!<br />
Convolution<br />
Product Product Analysis<br />
LZ brightness<br />
PSD(A+) PSD(φ+)<br />
Planet offset<br />
Collecting area Throughput<br />
Channel BW<br />
Interpolated Interpolated<br />
4.32E+00 /Hz/m 2 /s/sr 1.3E-03 rms 1.1E-03 rms 0.050 arcsec<br />
12.57 m 2 0.10 1.58E+12 Hz<br />
Interpolate!<br />
Solid angle<br />
Rotation time<br />
Configuration<br />
X-Array<br />
1.4 (λ / D) 2 50000 s<br />
SNR<br />
Optics PSD Interpolation<br />
Wavelength<br />
Targets Spectral<br />
Variances<br />
Ozone<br />
Wavelength<br />
9.74 um<br />
Ozone<br />
Config<br />
Planet signal Perturbation<br />
9.74 um<br />
Error budget<br />
PSD(A+) PSD(φ+)<br />
Look-up<br />
Look-up<br />
s<br />
Figure 4-6. Full <strong>TPF</strong>-I Error Budget for a Single Spectral Channel<br />
65
C HAPTER 4<br />
Figure 4-5 shows a simplified version of the <strong>TPF</strong>-I error budget. The values shown result in an SNR of 10<br />
for an ozone spectral channel spanning 9.5 to 10.0 μm, which currently represents the driving requirement<br />
on the integration time. The Earth-like planet orbits a G2 Sun-like star with an angular separation of 50<br />
mas at 15 pc distance. The ecliptic latitude is 30 degrees (this determines the contribution from local<br />
zodiacal dust). The array has a linear Dual Chopped Bracewell configuration, comprising four 4-m<br />
diameter collectors spaced at 30-m intervals with phases of 0, π, π/2, and 3π/2, for a total array size of<br />
90 m.<br />
The overall SNR is built up from 53 rotations of the array, each with a period of 50,000 s. The total<br />
observing time is 31 days (which does not currently include any overhead for calibration). The SNR for a<br />
single rotation is broken out into the root-mean-square (rms) of the planet signal variations and the<br />
contributions from random and systematic noise. The rms planet signal in this spectral band is less than<br />
0.1 photons/s, corresponding to a fraction 2.3 x 10 -8 of the stellar signal in the same channel. In this<br />
example, the random noise has approximately equal contributions from the stellar size leakage and from<br />
local zodiacal dust. Other contributions (including exozodiacal dust emission, instrument thermal<br />
emission and stray light) have been omitted for clarity. The conversion from leakage photon rate to<br />
leakage photon noise is based on shot noise for a rotation of 50,000 s. The null floor leak term represents<br />
the photon noise arising from mismatches in the instrument beamtrains. The null floor makes a much<br />
lower contribution to the random noise budget than the local zodiacal emission and stellar leakage since it<br />
is driven by need to minimize the systematic error.<br />
The instability noise contribution to the error budget is indicated by the blue boxes, and it is chosen to be<br />
similar in magnitude to the random error. The contribution of 0.051 photon/s corresponds to a null<br />
fluctuation of order 10 -8 at frequencies similar to the planet signal. These null fluctuations result primarily<br />
from nonlinear combinations of amplitude (ΔA) and phase (Δφ) errors of the electric fields from the<br />
collectors. Analysis shows that the electric fields delivered by each collector must be matched in<br />
amplitude to within an rms error of less than 0.13% (equivalent to 0.26% intensity error), and matched in<br />
phase to within 1 milliradian at λ = 10 μm (equivalent to 1.5 nm of path). These conditions must be met<br />
simultaneously for all wavelengths in the science band, for both polarization states, and over all<br />
timescales (including direct current [DC] offsets and vibrations in the kilohertz frequency range). The null<br />
depth resulting from this level of control is 7.5 x 10 -7 . Meeting these amplitude and phase requirements is<br />
the primary technical challenge for the <strong>TPF</strong>-I system, and these requirements drive almost all aspects of<br />
the instrument design. Instability noise and its mitigation are described in more detail later in this<br />
document.<br />
In Figure 4-5 the amplitude and phase errors have been further categorized into static and dynamic terms.<br />
Static errors arise from mismatches in the coatings, the reflective and transmissive optics, and the static<br />
alignment of the system, including both dispersive and birefringent effects. Introducing an achromatic π<br />
phase shift in the nulling beam combiner has been a focus of research, but matching the transmission of<br />
the different beamtrains – each of which contains on the order of 30 optical elements – across the full<br />
range of wavelengths and polarization is also a formidable challenge. The dynamic terms include all timevariable<br />
effects. The formation-flying system is continually in motion, and a series of control systems<br />
must be used to stabilize the optical path at the 1-nm level and to manage the tilt and shear of the<br />
wavefront that couples into the single-mode spatial filter. It is clearly important to validate the static terms<br />
over an optical bandwidth that is representative of the flight system. Conversely, if the instrument can be<br />
66
D ESIGN AND A R C H I T E C T U R E T RADE S TUDIES<br />
Integration time needed for 1 Earth mass<br />
30.00<br />
25.00<br />
Dominated by<br />
Local Zodi<br />
All (1014)<br />
C HAPTER 4<br />
0<br />
±π/2<br />
0 ±π/2 ±π ±3π/2<br />
±π<br />
X-Array<br />
±3π/2<br />
0 ±2π/3 ±4π/3<br />
Linear DCB<br />
Single hop<br />
±π<br />
Linear 3<br />
0 ±π<br />
0<br />
±π/2<br />
Z-Array<br />
Triangle<br />
±2π/3<br />
Diamond DCB<br />
±3π/2<br />
Multi-hop<br />
0<br />
±4π/3<br />
Two-hop<br />
±π/2<br />
±3π/2<br />
Figure 4-8. Nulling configurations considered in the trade study. The target star is in the direction<br />
normal to the page. The phasing of each collector is given for each of the two chop states. Pale blue<br />
circles represent collector spacecraft; yellow circles are dedicated combiner spacecraft; hatched<br />
yellow and blue circles are collector spacecraft with combining optics. Colored lines indicate the<br />
beam relay paths for each aperture. A number of other configurations were ruled out, as described<br />
in the main text.<br />
Originally implemented in MathCad, the model has now been migrated to MatLab. The starting point is<br />
the catalog of 1014 <strong>TPF</strong>-I candidate target stars described in Section 2.5 and illustrated by the circles in<br />
Figure 4-7. Given a specific nulling configuration and collector diameter, the program cycles through<br />
each star, determining first whether it meets the criteria for ecliptic latitude (solar shading constraint) and<br />
inner working angle. It then estimates the time needed to achieve an SNR of 5 for a broad-band detection<br />
of an Earth-sized planet, using a simplified version of the full performance model. The list of targets is<br />
then sorted in ascending order of integration time. With 2 years of mission time available for the initial<br />
survey, we assume that 50% of this time will be spent integrating on targets and that each target will be<br />
visited three times to ensure a completeness in excess of 90%. The number of targets that can be surveyed<br />
is therefore given by the star in the sorted list by which the cumulative integration time has reached 2 x<br />
50% / 3 = 122 days.<br />
The colored circles in Figure 4-7 indicate the integration time needed to detect an Earth-sized planet<br />
around the star. The mid-IR signal from an Earth-sized planet in the mid-Habitable Zone depends only on<br />
the distance to the system. The noise is dominated by contributions from the local zodiacal dust<br />
(invariant with distance) and stellar size leakage (which decreases with distance but increases for the<br />
earlier spectral types). As a result the easiest targets in red are the nearby K stars. Integration times<br />
increase with distance and with the intrinsic size of the star. The solid line shows schematically a contour<br />
68
D ESIGN AND A R C H I T E C T U R E T RADE S TUDIES<br />
of constant integration time; targets to the left are limited by local zodiacal emission, while those to the<br />
right are limited by stellar leakage.<br />
This technique can also be extended to predict the number of targets that can be spectroscopically<br />
characterized in a given amount of time. This depends on the prevalence of Earth-like planets in the<br />
Habitable Zone. If planets are rare then the average distance to the systems being characterized is high,<br />
the integration times are long, and only a few systems can be accommodated in the time available. If<br />
planets are very common, however, then we will be able to characterize a much larger number of nearby<br />
systems. The simple algorithm to account for this is described in Dubovitsky and Lay (2004).<br />
A more sophisticated model to predict and optimize the program completeness is now underway. Based<br />
on similar analysis for the <strong>TPF</strong>-C mission, the algorithm assesses the observability for each of 1000<br />
planets around each star. For each week of the mission, only the most productive stars are selected in<br />
order to maximize the number of planets found.<br />
4.3 Nulling Configurations<br />
We define an architecture by the combination of nulling configuration, collector aperture diameter, beam<br />
routing between spacecraft, beam combiner design, number of launches, and type of launch vehicle. The<br />
nulling configuration includes the number and relative locations of the collectors, and the amplitudes and<br />
phases with which each collector beam is combined. All are significantly constrained in geometry by the<br />
need for equal optical path lengths from each collector to the combiner.<br />
The six basic architectures compared in this study are listed in Figure 4-8, ranging from three to five<br />
spacecraft. The first four are all part of the Dual Chopped Bracewell (DCB) family, in which the four<br />
apertures have phases of 0, π/2, π, and 3π/2 radians. The Linear DCB (Beichman et al. 1999) can be<br />
phased in two ways, with either separated or interleaved nulling baselines. In the analysis we choose the<br />
optimal case for each observing scenario. The X-array (Lay and Dubovitsky 2004) chosen for study has a<br />
fixed 2:1 aspect ratio (a tunable aspect ratio is discussed in Section 7). The Diamond DCB and Z-Array<br />
were both proposed by Anders Karlsson (ESA) as a means of reducing the number of spacecraft; the<br />
hatched circle in the schematic indicates a spacecraft that functions as both a collector and combiner. The<br />
Z-Array uses multiple relays between the collectors to balance the path lengths. The four DCB<br />
architectures have identical beam combiners. The Triangle and Linear 3 are based on a three-way nulling<br />
strategy with phases of 0, 2π/3, and 4π/3 (Karlsson et al. 2004). The other three-spacecraft designs have<br />
been proposed by Serabyn and Mennesson (2004). In all cases, the spacecraft are confined to a plane<br />
perpendicular to the target star direction for thermal reasons. The beams must be routed such that the path<br />
lengths from the star to the combiner are equal; this is achieved with a single hop from the collector to the<br />
combiner in the X-array, two hops for the Linear DCB, Diamond DCB, Triangle and Linear 3, and as<br />
many as four hops for the Z-Array.<br />
Many nulling configurations were not considered in the trade study. The single Bracewell nuller is<br />
attractive for its simplicity (only two collectors), but it cannot accommodate a phase chop, making it<br />
extremely vulnerable to slow systematic effects (a variation of 1 photon per second of scattered light can<br />
look like a planet, for example). There are also a number of configurations with higher-order nulls, in<br />
which the central null of the response on the sky has a broader null than the quadratic profiles seen in<br />
69
C HAPTER 4<br />
Figures 4-1–4-3. The motivation was to reduce the stellar size leakage which is often the dominant source<br />
of noise. Examples are the Angel cross, OASES, Laurance, and Bow-Tie configurations. Although they<br />
reduce the noise, they are also less efficient at detecting modulations in the planet photon rate. The star<br />
count model (Section 4.2.2) demonstrated that these higher-order null configurations were significantly<br />
less capable than the dual chopped Bracewell designs.<br />
A given nulling configuration may be implemented as either a free-flying formation of spacecraft or as a<br />
single, structurally-connected system. The length of a practical structure limits the inner working angle<br />
and angular resolution, and it severely restricts the number of targets that can be surveyed and<br />
characterized. For this reason, a structurally-connected option was not considered in the trade study. In<br />
addition, formation-flying arrays may be implemented in either co-planar or non-co-planar forms (as<br />
described in Section 4.5), although only co-planar forms were considered in the trade study.<br />
4.4 Collector Aperture Diameter and Array Size<br />
The performance of a given configuration depends strongly on the aperture diameter and constraints on<br />
the minimum and maximum array size. The aperture diameter is constrained by the launch vehicle and<br />
the number of spacecraft needed. We adopted the Boeing Delta IV-Heavy as the standard launch vehicle.<br />
We further assumed that the collector primary mirrors were circular and monolithic (i.e., no deployable<br />
Fairing diam. limit<br />
Predicted Launch Mass (kg)<br />
14000<br />
12000<br />
10000<br />
8000<br />
6000<br />
4000<br />
2000<br />
Launch mass limit<br />
4 collectors<br />
1 collector<br />
1<br />
2<br />
0<br />
1.5 2 2.5 3 3.5 4 4.5<br />
Primary Mirror Diameter (m)<br />
70<br />
Figure 4-9. Launch mass as a function of primary mirror diameter and the number of collectors for<br />
the case where there is a separate combiner spacecraft. Mass and fairing diameter constraints are<br />
shown for a Delta IV-Heavy launcher, assuming 30% mass margin. The maximum aperture<br />
diameter is 3.8 m for the Linear DCB and X-Array configurations, constrained by the launch mass<br />
(Point 1). The Linear 3 configuration has a maximum diameter of 4.1 m, constrained by the fairing<br />
diameter (Point 2). A modified set of curves was used for the combiner-less configurations.
D ESIGN AND A R C H I T E C T U R E T RADE S TUDIES<br />
segments). The dynamic envelope of the fairing has a diameter of 4.6 m. Allowing a total of 50 cm for<br />
other structures, the maximum launchable aperture diameter is 4.1 m, represented by the vertical line in<br />
Figure 4-9. A parametric model was constructed to predict the total mass as a function of aperture<br />
diameter, number of collectors and whether or not a dedicated combiner spacecraft was needed. The<br />
model was based on the mass budget from a detailed design study for a 4-m diameter collector, using<br />
scaling laws of D 2.5 for the collector primary, D 1.5 for the secondary and support structure, and D 2.0 for the<br />
solar shade. The mass of the combiner spacecraft and optics, and the collector spacecraft bus were<br />
assumed to be independent of the aperture size. The curves predicted by the model in the case where there<br />
is a separate combiner spacecraft are shown in Figure 4-9. Also shown is the 9600-kg launch mass limit.<br />
The Linear DCB and X-array are mass-limited to an aperture of 3.8 m, while the other architectures are<br />
constrained by the fairing diameter to 4.1 m aperture. The fairing height of 17 m was not the limiting<br />
constraint for any of the architectures considered, although the current five-spacecraft single launch stack<br />
design still has some risk. A two-launch scenario was also considered for the Linear DCB and X-array;<br />
the aperture diameter is increased to 4.1 m, but there is the additional cost and complication of supporting<br />
two launches and a rendezvous in deep space.<br />
The array size is defined by the longest baseline between any two collectors (center-to-center). The<br />
minimum sizes are determined by the closest separation we are willing to tolerate between spacecraft<br />
without significant risk of collision. A minimum spacecraft separation of 20 m was chosen, corresponding<br />
to a ‘tip-to-tip’ spacing of 5 m between sunshades that are 15 m across. The maximum array size for<br />
nulling is limited by stray light: the thermal emission from the solar shades of one spacecraft is scattered<br />
into the science beam on another spacecraft by contamination on the optics. This scattered light easily<br />
overwhelms the other sources of noise unless the optics are baffled to completely block the thermal<br />
emission. As the separation between spacecraft is increased, the angular offset between the solar shade<br />
and the exit point of the science beam is reduced, and the shade becomes harder to block. A maximum<br />
spacecraft separation of 160 m was imposed, based on the practical dimensions of the light baffle.<br />
4.5 Planar vs. Nonplanar<br />
The architectures compared in the trade study were all co-planar; the collector and combiner spacecraft<br />
are all located in a plane normal to the direction of the target star. The cold optics are kept shaded from<br />
the Sun by large sunshades (also in the plane of the array), and observations are restricted to targets that<br />
lie within a cone of the anti-Sun direction (Figure 4-10a). Architectures in which the combiner spacecraft<br />
sat above the plane of collectors were discounted because the hot sunshade of the combiner would<br />
generate an unacceptably high flux of thermal photons on the cold side of the collector spacecraft.<br />
A new non-planar scheme was recently proposed by ESA that may avoid these issues, and it provides<br />
significant simplification in the design of the collector spacecraft. This has been dubbed the ‘Emma’<br />
architecture (after Emma, the wife of Charles Darwin) and is illustrated in Figure 4-10b. The collector<br />
spacecraft carries a single optic – a spherical primary with a focal length of ~ 1 km – that focuses the light<br />
from the target system to the combiner spacecraft. The large separation of the combiner from the collector<br />
spacecraft minimizes the impact of thermal radiation from one to the other. The Sun is now nominally off<br />
to the side, at 90 degrees from the target star direction. The collectors have compact shades around their<br />
perimeter, and the combiner has a set of shades on the Sun-ward side of the spacecraft. As the array of<br />
collectors rotates about the line of sight to the target, the combiner must remain stationary to preserve its<br />
71
C HAPTER 4<br />
shading. The formation-flying system must carefully maintain the position and pointing of the collector<br />
spacecraft to ensure that the beams are delivered to the correct locations on the combiner.<br />
The Emma architecture has a number of attractive features, but also has some disadvantages:<br />
Pros:<br />
Cons:<br />
+ Simplified collector – Increased combiner spacecraft complexity<br />
No deployable optics<br />
Compact sun-shade<br />
– Smaller maximum array size<br />
– Increased demands on formation flying<br />
+ Flexible collector array geometry – No collector standalone observing<br />
+ Increased sky coverage – Stray light from collector sunshades<br />
+ Smaller minimum array size<br />
The Emma concept has been pursued by the Alcatel study group for Darwin, and it has now become the<br />
subject of a design study at JPL.<br />
a)<br />
b)<br />
Combiner<br />
~ 1 km<br />
Allowed solar<br />
illumination angles<br />
Collector<br />
Combiner<br />
Collector<br />
Allowed solar illumination angles<br />
Figure 4-10. (a) Classic co-planar architecture, (b) the out-of-plane Emma concept.<br />
72
D ESIGN AND A R C H I T E C T U R E T RADE S TUDIES<br />
4.6 Beam Combiner Design<br />
In nulling interferometry, excess starlight is blocked using an interferometric cancellation technique,<br />
improving the star-to-planet contrast ratio to enable planet detection over an observation time typically of<br />
several hours. To reduce the stellar leakage signal to a level comparable to the zodiacal background the<br />
nuller should be capable of reaching null depths of at least 10 -5 . To reach deep nulls, a number of<br />
parameters must be controlled, some inside the nuller and some in other associated systems. An important<br />
feature of a successful nulling beam combiner will be identical treatment of both input beams in terms of<br />
phase shifts, reflections and transmissions, angles of incidence, polarizations, etc. Different nuller designs<br />
are being tested in the laboratory and in the field. A modified Mach-Zehnder design (MMZ) has been<br />
deployed on the Keck telescopes, and this design seeks to achieve a high degree of symmetry in the beam<br />
combination by causing each input beam to be both transmitted once and reflected once from nearidentical<br />
beamsplitters (this design achieved 2 million to 1 laser nulls at 10.6 μm).<br />
A different design (also using conventional beamsplitters), the rooftop nuller, was built at JPL for SIM<br />
and achieved high performance nulls (laser transient nulls at 633 nm near 10 -6 and 18% bandwidth redlight<br />
nulls of 10 -4 ) in the visible waveband. A newer concept, the fiber beam combiner is currently being<br />
tested in the laboratory for deployment on a large ground-based telescope. This design seeks to achieve<br />
high beam symmetry by dispensing with the beamsplitters and combining the incoming beams directly on<br />
the tip of a single-mode optical fiber, and this design has already achieved laser nulls of 10 5 in the visible.<br />
Bright<br />
outputs<br />
Beamsplitter 4<br />
Common<br />
mirrors<br />
Nulled<br />
outputs<br />
Inner mirror<br />
Input beams<br />
Beamsplitter 1<br />
Outer mirror<br />
Figure 4-11. Modified Mach-Zehnder nuller used on Keck Telescopes.<br />
73
C HAPTER 4<br />
Null depth<br />
1.E+00<br />
1.E-01<br />
1.E-02<br />
1.E-03<br />
1.E-04<br />
1.E-05<br />
1.E-06<br />
1.E-07<br />
1.E-08<br />
6 8 10 12<br />
Wavelength (um)<br />
Figure 4-12. Calculated null depth across the band for NaCl and AgCl wedges between 6 and 13 μm.<br />
A second key component of a beam combiner design is the field-inversion system which inverts the<br />
electric field of one of each pair of incoming beams by exactly π across the waveband, allowing the beam<br />
combiner to form a null (destructive fringe) rather than a constructive fringe. Several different methods of<br />
field inversion have been proposed, and at least two have been tested in the laboratory. One method uses a<br />
periscope-like arrangement of mirrors to produce the field inversion. This has the advantage of being<br />
effective across a very wide waveband. A second method uses pieces of glass of carefully controlled<br />
thickness known as phase plates to produce the field inversion. Figure 4-12 shows the calculated null<br />
depth for a set of silver chloride (AgCl) and sodium chloride (NaCl) phase plates. Other glass<br />
combinations potentially yielding deep nulls are also known.<br />
A third key component for the beamcombiner is the ability to control the optical path and maintain the<br />
null fringe on the star. Light at a different wavelength from the nulling band is used for this purpose, for<br />
example between 2 and 4 μm. If this light follows as much of the beam train as possible, then the phase of<br />
the null fringe can be better controlled, leading to deeper more stable nulls, important for faint planet<br />
detection. In the flight design study described next, the fringe tracking light follows the science path<br />
almost exactly and is interfered on the same beamsplitters as the nulling light.<br />
4.6.1 Co-axial Combiners for a Formation-Flying Interferometer<br />
For the formation-flying interferometer design work, a simplified nuller was used rather than the highly<br />
symmetric MMZ design. The main benefits would be that only one internal laser metrology beam would<br />
be needed for each beam of the interferometer rather than two, the attenuation or round-trip insertion loss<br />
would be less for the metrology light, and the science light would emerge on only two beams rather than<br />
four, offering a small but significant improvement in signal-to-noise ratio at the detector. There would<br />
also be associated engineering simplifications. Because of the wide spectral band to be covered by <strong>TPF</strong>-I,<br />
the nuller is actually divided into two units stacked next to one another, one operating on the wavelength<br />
range 7 to 11 μm and the other on the range 11 to 17 μm. This arrangement necessitates an additional<br />
74
D ESIGN AND A R C H I T E C T U R E T RADE S TUDIES<br />
Figure 4-13. Schematic layout of simplified beam combiner.<br />
metrology path and possibly a second fringe tracking system. By splitting the spectrum we generate less<br />
demanding coating requirements on the beamsplitters which must, for the highest efficiency, give a near<br />
reflection/transmission ratio (R/T) across the band. Also, single spatial mode filters (which cover these<br />
spectral bands) are becoming available.<br />
The simplified nuller uses a beamsplitter/compensator plate arrangement to obtain a near match of optical<br />
path across the waveband. Residual error in the R/T ratio is taken up using one specially fabricated<br />
coating on one side of the compensator plate. Models showed that the throughput could then be matched<br />
across the spectral band on both incoming beams to better than 1%. The residual amplitude and phase<br />
errors are then well within the compensation range of the adaptive nuller.<br />
Science detector and fringe tracking<br />
The science detector operates on the two complementary outputs of the cross-combiner. Light emerging<br />
from the cross-combiner is focused through the single-mode spatial filter (the subject of a <strong>TPF</strong>-I<br />
technology development effort) and then is dispersed through a prism before being detected on the<br />
science array. Since only two beams are output from each cross-combiner, a single science detector array<br />
(nominally a silicon:arsenic [Si:As] array) can handle all four beams from the pair of cross-combiners.<br />
The nuller layout includes a fringe tracking camera, which detects the phase on each nuller and on the<br />
cross-combiner.<br />
One beam from each nuller is extracted from the rejected light output (all the 7–17 μm wavelength<br />
starlight exits the system from this output) and is dispersed onto the camera array. From the cross-<br />
75
C HAPTER 4<br />
combiner, two beams are extracted, so a total of four beams are sensed at the array. For the second crosscombiner<br />
a second fringe tracker would be needed unless a laser metrology could be used to transfer<br />
measured phase to the second nuller.<br />
4.6.2 Multi-Axial Beam Combiners<br />
In contrast to classical beamsplitter-based beam-combiner designs, it is also possible to combine optical<br />
beams using single-mode fibers. Technology at long wavelengths has not advanced to the point where<br />
each of the various beams to be combined can be injected into separate fibers and then combined using<br />
cross-couplers. However, another approach is feasible. Separate beams can be directly combined into a<br />
single fiber simply by using a common focusing optic, as in Figure 4-14. Each of the individual beams<br />
must couple to the same spatial mode in the single-mode fiber. Thus, if the beams (in the two beam case)<br />
arrive with a relative phase shift of π radians, the two beams entering the fiber mode will cancel each<br />
other. Note that a large number of beams can be combined in one step, as a number of beams around the<br />
periphery of a common focusing optic can all be simultaneously focused onto the common fiber tip<br />
(Figure 4-15; Karlsson et al. 2004; Wallner et al. 2004). This method of “fiber nulling” has now been<br />
verified in the optical regime, where deep narrowband nulls close to one part in a million have already<br />
been obtained (Haguenauer and Serabyn 2006) , and in the near-infrared, where broad-band nulls of a few<br />
10 -4 have been obtained across the H band (Figure 4-16; Mennesson et al. 2006). However, while simple<br />
and easy to use, this nulling approach also has disadvantages, including lower efficiencies in the case of a<br />
small number of beams, and the lack of a complementary, or “bright” output. Thus, more experience with<br />
this type of combiner is required to fully understand the trade-offs relative to classical beamcombiners.<br />
Focal plane<br />
intensity<br />
Single-mode<br />
waveguide<br />
Fiber fundamental mode<br />
Single sub-pupil intensity<br />
Interference intensity<br />
beam 1<br />
Focusing optics<br />
beam 2<br />
Combined field amplitude<br />
Transversal cuts in focal plane<br />
Figure 4-14. Principle of single-mode fiber beam combination. The two beams are combined by the<br />
same focusing element onto the core of a single-mode fiber.<br />
76
D ESIGN AND A R C H I T E C T U R E T RADE S TUDIES<br />
Figure 4-15. Layout for multi-beam combination. The beams (small circles) are all focused onto<br />
the core of a single-mode fiber by the same focusing optic (large circle).<br />
Figure 4-16. Measured H-band null depths. The best null in this 10-s running average is<br />
6.5 × 10 -5 (Mennesson et al. 2006).<br />
4.7 Stray Light<br />
The light that is collected by each telescope is relayed through free space to the central beam combiner<br />
where interference fringes are formed. The optics of the beamcombiner must restrict the field of view<br />
looking back toward each telescope in order to strongly attenuate or block sunlight that might be reflected<br />
off the outer edges of the telescope spacecraft – in particular off the rim of the sunshields. The adopted<br />
solution has been to place the relayed light paths as far above the plane of the heat shields as possible,<br />
77
C HAPTER 4<br />
therefore increasing the dark field of view seen from the combiner spacecraft. Strategies for minimizing<br />
stray light have been detailed by Noecker et al. (2004, 2005).<br />
4.8 Instability Noise and Mitigation<br />
In an ideal nulling interferometer, the electric fields of the light from the collecting telescopes are<br />
combined with a prescribed set of amplitudes and phases that produce a perfect null response at the star<br />
(Figure 4-17a). In this case the integration times needed for planet detection and spectroscopy depend on<br />
the planet signal strength and the level of photon shot noise (from local and exozodiacal emission, stellar<br />
leakage around the null, and instrument thermal emission).<br />
a) Ideal stellar E-fields b) Amplitude and phase errors<br />
c) Dynamic errors<br />
2<br />
2<br />
2<br />
1<br />
4<br />
3<br />
1<br />
4<br />
3<br />
1<br />
4<br />
3<br />
Figure 4-17. a) Summation of electric fields in the spatial filter for an ideal Dual Chopped<br />
Bracewell nulling configuration. b) Amplitude and phase errors in the contributions from the<br />
different collectors lead to a residual leakage of photons. c) As the amplitude and phase errors vary<br />
with time, the residual photon leakage rate fluctuates and can mimic the presence of a planet.<br />
4.8.1 Origin of Instability Noise<br />
In practice, it will not be possible to maintain the exact set of amplitudes and phases – vibrations and<br />
thermal drifts result in small path-length errors and time-variable aberrations. The null “floor” is<br />
degraded, and there is a time-variable leakage of stellar photons that can mimic a planet signal (Fig. 4-17b<br />
and c). This is known as ‘instability noise’ (previously “systematic error” or “variability noise”), and it<br />
increases the integration time required. The analysis of instability noise is somewhat complex (Lay 2004).<br />
Some components are removed by phase-chopping. Others, such as the “amplitude-phase cross terms”<br />
and the “co-phasing error,” are not removed and result in leakage photon rates proportional to δA i δφ j and<br />
δφ j , respectively, where δA i represents an amplitude error from the i th collector and δφ j is a phase error<br />
from the j th collector. The analysis shows that a null depth of ~10 -5 is generally sufficient to control the<br />
level of photon noise from the stellar leakage, but that a null depth of ~10 -6 is needed to prevent instability<br />
noise from becoming the dominant source of noise. A 10 -6 null requires rms path control to within ~1.5<br />
nm, and rms amplitude control of ~0.1%. It is therefore instability noise, not photon noise that drives the<br />
performance of the instrument.<br />
Table 4-1 lists the mechanisms responsible for amplitude and phase errors, along with their spectral<br />
dependence and temporal nature. For example, vibrations in the optical path difference (OPD) result in a<br />
phase error that scales as the inverse of wavelength and are inherently time varying. Beam shear also<br />
78
D ESIGN AND A R C H I T E C T U R E T RADE S TUDIES<br />
gives a time-varying amplitude error (less light is coupled to the detector) but is approximately<br />
independent of wavelength. Mismatches in dispersion, birefringence, and reflectivities between the<br />
collector beams may have a more complex spectral dependence, denoted by f (λ), but are inherently static.<br />
These static effects can be compensated by an adaptive nuller (Peters et al. 2006) or similar device. The<br />
dynamic terms combine via amplitude-phase (δAδφ) and co-phasing (δφ) mechanisms to form the timevariable<br />
instability noise:<br />
−1 −2 −3<br />
() = ⎡α () λ + α ( ) λ + α ( ) λ ⎤ ( λ)<br />
IN t ⎣ 1<br />
t<br />
2<br />
t<br />
3<br />
t ⎦F*<br />
2 3<br />
() t () t () t ⎤F<br />
( )<br />
= ⎡<br />
⎣β1 ν + β2 ν + β3 ν ⎦ *<br />
ν<br />
(1)<br />
where ν is the optical frequency, the α and β coefficients vary randomly with time, and F * is the stellar<br />
flux (since the star is the source of these leakage photons). Other instability mechanisms, such as an<br />
unbalanced chop, may also be important, but will have a similar spectral dependence. The important<br />
conclusion is that at any given time the instability noise has a spectral signature that varies slowly with<br />
wavelength. This slow dependence with wavelength forms the basis of the first mitigation strategy,<br />
described in the following section. Ben Lane has proposed an alternative scheme described in Section<br />
4.8.3.<br />
Table 4-1. Sources of Instability Noise and Their Spectral Dependence<br />
Phase<br />
Amplitude<br />
Mechanism<br />
Spectrum<br />
Static /<br />
dynamic<br />
Mechanism<br />
Spectrum<br />
Static /<br />
dynamic<br />
OPD Vibration<br />
λ -1<br />
dynamic<br />
Tip / tilt<br />
λ -2<br />
dynamic<br />
Fringe tracker offset<br />
λ -1<br />
dynamic<br />
Focus<br />
λ -2<br />
dynamic<br />
Control noise<br />
λ -1<br />
dynamic<br />
Higher order<br />
λ -2<br />
dynamic<br />
Dispersion mismatch<br />
f 1 (λ)<br />
static<br />
Beam shear<br />
λ 0<br />
dynamic<br />
Birefringence mismatch<br />
f 2 (λ)<br />
static<br />
Reflectivity / transmittivity<br />
f 3 (λ)<br />
static<br />
79
C HAPTER 4<br />
4.8.2 Stretched X-Array and Spectral Filtering<br />
In the stretched X-array and spectral filtering approach, we use the spectral dependence as the means to<br />
distinguish between the planet signal and the instability noise. To make this effective, the array must be<br />
stretched significantly with respect to previous designs. The X-array is the natural choice, since it can be<br />
stretched along its long dimension while preserving the short nulling baselines needed to minimize the<br />
stellar leakage. In principle, all instability noise can be eliminated. The nulling requirement can be relaxed<br />
from 10 -6 to 10 -5 , while at the same time the sensitivity is improved and the angular resolution of the array<br />
is significantly increased. The technique is described below. A more complete analysis can be found in<br />
Lay (2006).<br />
Figure 4-18a shows the stretched X-array geometry, consisting of four collectors located on the corners of<br />
a rectangle and a central combiner, observing a star normal to the plane of the page. The aspect ratio has<br />
been stretched to 6:1, with 35-m nulling baselines. The corresponding instrument response at a<br />
wavelength of 10 μm, projected onto the plane of the sky, is shown in Fig. 4-18b. This is the “chopped”<br />
response – the phasing of the array is switched rapidly between two states, and the difference is taken.<br />
The star is located in the middle of the central, vertical null stripe (mid-grey); on either side the response<br />
Figure 4-18. (a) Stretched X-array configuration. The aspect ratio is 6:1 in this example. (b) Chopped<br />
response of the stretched X-array configuration on the sky for a wavelength of 10 μm. The target star is<br />
located on a null (mid-grey); white and black represent positive and negative regions of the response. The<br />
planet has an offset of 250 nrad, or ~ 50 mas. (c) Chopped planet photon rate as the array is rotated. Peaks<br />
and valleys correspond to the white and black regions encountered along the circular locus shown in (b).<br />
(d) Chopped planet photon rate (grey-scale) as a function of optical frequency (left axis) or wavelength<br />
(right axis) and array rotation azimuth. Similar wavelength-azimuth plots are shown for (e) photon noise<br />
and (f) instability noise.<br />
80
D ESIGN AND A R C H I T E C T U R E T RADE S TUDIES<br />
a) az = 30 deg b)<br />
5 x 10¹³<br />
5 x 10¹³<br />
4.5<br />
4<br />
planet<br />
signal<br />
instability<br />
noise<br />
Cubic fit<br />
4.5<br />
4<br />
f / Hz<br />
3.5<br />
3<br />
2.5<br />
2<br />
Quadratic<br />
fit<br />
1.5<br />
1.5<br />
-0.4 -0.2 0 0.2 0.4 0.6<br />
-0.4 -0.2 0 0.2 0.4 0.6<br />
photon rate / s -1 photon rate / s -1<br />
Figure 4-19. (a) Vertical cuts through wavelength-azimuth plots of Fig. 4-18 d and f at an azimuth of<br />
30 degrees. Planet signal shows characteristic oscillatory behavior. Instability noise follows low-order<br />
polynomial dependence, with independent contributions to the two halves of the spectrum (separate<br />
hardware). (b) Result of removing low-order fits. Most of the planet signal remains, but the instability<br />
noise is almost completely removed.<br />
has both positive (white) and negative (black) regions. A single planet is shown with a radial offset of 50<br />
mas (2.5 × 10 -7 rad) from the star. The detected photon rate from the planet as a function of rotation<br />
azimuth of the array is shown in Fig. 4-18c. The circular symbol gives the photon rate for the rotation<br />
angle shown in Fig. 4-18b. The peaks and valleys of Fig. 4-18c correspond to the white and black parts of<br />
the response along the circular locus in Fig. 4-18b. As the wavelength is increased from 10 μm, the<br />
instrument response of Fig. 4-18b is scaled about the center, with increased spacing between the peaks<br />
and valleys of the response. The photon rate from the planet is also changed according to its spectral<br />
distribution. Figure 4-18d combines these effects to show how the planet photon rate depends on both the<br />
wavelength (or optical frequency) and the array rotation azimuth. The example is based on a planet with a<br />
265-K black-body spectrum, which has a substantially higher photon rate at 20 μm compared to 6 μm. A<br />
horizontal section through this distribution at a wavelength of 10 μm gives the profile shown in Fig. 4-<br />
18c. The wavelength-azimuth plot is a convenient representation of the data obtained from spectral<br />
channels of <strong>TPF</strong>-I as the array is rotated.<br />
In addition to the planet signal, there are two distinct classes of noise (Section 4.2.1). The photon (shot)<br />
noise is shown in Fig. 4-18e, and is proportional to the square root of the overall photon rate. Important<br />
contributors are the local and exozodiacal backgrounds and stellar leakage. The instrument instability<br />
noise is shown in Fig. 4-18f. We assume that the full spectral range of 6 to 20 μm has been split for<br />
practical reasons into two bands for nulling: 6–10 μm and 10–20 μm. (It is difficult to cover the full range<br />
with one set of glasses and single-mode spatial filters.) Over each of these bands the instability noise at<br />
any instant is represented by a low-order polynomial series in the optical frequency multiplied by the<br />
stellar spectrum, according to Eq. 1. The coefficients vary randomly with time as the instabilities (path<br />
length, tilt, etc.) evolve. In Fig. 4-18f we show instability noise that is random from one azimuth to the<br />
next and from one band to the other (i.e., having a white noise spectrum). In practice the spectrum is not<br />
exactly white, and there will be some correlation, both with azimuth and between the spectral bands, but<br />
we will not rely on this correlation for the analysis presented here. In general, the instability noise<br />
increases at high optical frequencies / short wavelengths. The smooth variation with wavelength, coupled<br />
with the white-noise spectrum in azimuth, result in the distinctive vertical striping seen in the plot.<br />
f / Hz<br />
3.5<br />
3<br />
2.5<br />
2<br />
81
C HAPTER 4<br />
Table 4-2. Impact of Null Depth on SNR (after instability noise removed)<br />
Null depth @ 10 μm Broadband SNR (relative) Ozone SNR (relative)<br />
10 -6 1.00 1.00<br />
10 -5 0.97 0.92<br />
10 -4 0.80 0.60<br />
Figure 4-19a shows vertical cuts through the wavelength-azimuth plot at an azimuth of 30 degrees, and<br />
depicts both the planet signal and an example of instability noise. The instability noise is a smooth, slowly<br />
varying function within the two halves of the spectrum, whereas the planet signal oscillates with<br />
wavelength. We exploit this difference to remove the instability noise. Removing a low-order polynomial<br />
fit from each half of the spectrum gives the curves shown in Fig. 4-19b. In each case, the instability noise<br />
signature has been almost totally removed, and the signal remains largely intact, although somewhat<br />
modified. The impact of the fitting on the planet signature is predictable and can be corrected. Some of<br />
the planet signal is removed by the fitting process (which impacts the sensitivity), and it is this that<br />
motivates the need for a stretched array. As the array size is reduced, there are fewer oscillations of the<br />
planet signal across the spectrum, and more of the planet signal is removed by the low-order fit. The 6:1<br />
aspect ratio described here is a compromise between the array size and the amount of planet signal that is<br />
lost.<br />
With the effective removal of the instability noise, it is possible to relax the required null depth.<br />
Table 4-2 lists the SNR obtained for both broad-band detection and ozone spectroscopy, relative to the<br />
SNR with a 10 -6 null depth. In the absence of instability noise, the SNR is determined by photon noise,<br />
with principal contributions from stellar size leakage, local zodiacal dust, and stellar-null floor leakage.<br />
Only the stellar-null floor leakage depends on the null depth. Relaxing the null depth to 10 -5 has only a<br />
small impact on the SNR. At a null depth of 10 -4 the stellar-null floor leakage is becoming the dominant<br />
source of photon noise. But even with this relaxation by a factor of 100, the mission is still viable, albeit<br />
with reduced sensitivity.<br />
A significant added benefit of the stretched array is that the angular resolution is improved by a factor of<br />
~3. The benefits of this will be described in Section 4.9.<br />
82
D ESIGN AND A R C H I T E C T U R E T RADE S TUDIES<br />
4.8.3 Post-Nulling Calibration<br />
As previously explained, instability noise can wash out any planet signal unless the various electric fields<br />
are matched in all particulars at the level of ~0.1%. The difficulty of attaining such levels of control (e.g.,<br />
~1 nm path control) has motivated some research into ways to measure and remove nulling leakage after<br />
beam combination (Guyon 2005; Lane, Muterspaugh and Shao 2006).<br />
One such approach, dubbed “coherent calibration”, is outlined in Figure 4-20. In this approach, one takes<br />
advantage of the fact that light leaking through the null is coherent with light from the star, but not with<br />
light from the planet. Hence it is possible to use the bright output from the nuller (which would otherwise<br />
simply be discarded) as a “reference beam” to be mixed with part of the nulled output from the<br />
interferometer. This mixing process will yield an interferometric fringe, the amplitude of which is a<br />
direct measure of the amount of starlight leaking through the nuller.<br />
Simulations of coherent calibration shown in Fig. 4-21 indicate that it is possible relax the required levels<br />
of field matching, possibly by factors of 10 or more. However, further work is required to demonstrate the<br />
approach in the laboratory, and to understand the ultimate limits to the level of calibration precision that<br />
can be attained before other limitations become manifest.<br />
Figure 4-20. Schematic outline of coherent calibration. Part of the science beam (I d ) is mixed with a<br />
reference beam (I b ) taken from discarded starlight; the resulting fringes are measured at I C1 and I C2 and<br />
used to infer the amount of starlight leaking through the null and contaminating the science<br />
measurement. Although only a single-Bracewell nuller is shown, the concept can be applied to more<br />
complicated nulling architectures (e.g., the X array) in a straightforward manner.<br />
83
C HAPTER 4<br />
It should be noted that this calibration approach does carry some cost in the form of a more complex<br />
beam-combination system (i.e., inserting a Mach-Zender interferometer into the system directly behind<br />
the nuller) and some loss of photon flux (a fraction of the science beam must be mixed with the reference<br />
beam). However, the amplitude and path-control requirements on this second beam combiner are nowhere<br />
near as stringent as of the nulling system.<br />
Figure 4-21. Simulated images reconstructed from raw and calibrated data, with three different noise<br />
levels. Top: 1 nm of phase noise and 0.01% amplitude mismatch. Middle: 10 nm of phase noise and<br />
0.1% amplitude mismatch. Bottom: 50 nm of phase noise and 0.5% amplitude mismatch.<br />
84
D ESIGN AND A R C H I T E C T U R E T RADE S TUDIES<br />
4.9 Imaging Properties<br />
The primary motivation for the Terrestrial Planet Finder missions is their ability to directly detect photons<br />
from Earth-sized planets. Orbit determination requires that the emission can be localized and tracked over<br />
time. Spectroscopy is only meaningful if the photons can be attributed to the right object. This may be<br />
straightforward for the case of a single planet orbiting a star, but it will be very difficult to establish this a<br />
priori. The publication of the first spectrum from an exo-solar Earth would be heavily compromised by<br />
the possibility of spectral contamination by unresolved confusing sources, whether background objects,<br />
lumps in the exozodiacal dust emission, or other planets. It is, therefore, very important that <strong>TPF</strong>-I can<br />
resolve the emission from the multiple sources that might be present. This is why we must understand the<br />
a)<br />
V<br />
M<br />
E<br />
b)<br />
Percentile<br />
c)<br />
Percentile<br />
100<br />
90<br />
80<br />
70<br />
60<br />
50<br />
40<br />
30<br />
20<br />
10<br />
0<br />
100<br />
90<br />
80<br />
70<br />
60<br />
50<br />
40<br />
30<br />
20<br />
10<br />
0<br />
Earth-Venus<br />
Earth-Mars<br />
Combination<br />
0 20 40 60 80 100 120 140 160 180<br />
Separation / mas<br />
Earth-Venus<br />
Earth-Mars<br />
Combination<br />
0 20 40 60 80 100 120 140 160 180<br />
Separation / mas<br />
Figure 4-22. Angular separations of the Earth–Mars–Venus system viewed at 15 pc. (a) The<br />
angular separations are reduced as the orbits are viewed closer to edge-on. (b) Results of Monte<br />
Carlo simulation showing the probability that planets are separated by less than a particular value.<br />
For example, in 50% of cases we expect that two of the planets will be separated by 45 mas or less.<br />
(c) Same as (b), but includes the anti-star negative images of the planets.<br />
85
C HAPTER 4<br />
Negative antistar<br />
image<br />
Main peak<br />
Sidelobes<br />
Satellite<br />
peaks<br />
Figure 4-23. Example of the broad-band point-spread function for the X-array 2:1, obtained by coadding<br />
the monochromatic PSFs from five wavelengths spanning 7 to 17 μm.<br />
imaging properties of different array configurations. The following sections describe the distinction<br />
between the nulling and imaging baselines, the angular resolution needed to separate multiple planets, the<br />
properties of the point-spread function, the requirement on array size, and some of the approaches that<br />
have been proposed for image deconvolution.<br />
4.9.1 Separating Multiple Planets<br />
In this section we derive a criterion for the angular resolution that is desirable to resolve multiple planets.<br />
In the absence of measured planet data, we adopt the inner Solar System (Venus–Earth–Mars) as the<br />
benchmark case. Figure 4-22 shows the statistics for the relative angular separation of these three planets<br />
as viewed from a distance of 15 pc, averaged overall viewing angles. Figure 4-22b shows the cumulative<br />
statistics for the separations between the planets themselves. If we also include the negative anti-Sun<br />
image of each planet (a consequence of phase chopping – see next section), the average separations are<br />
reduced, as illustrated in Fig. 4-22c.<br />
With an angular resolution of 20 mas, Fig. 4-22c indicates that an Earth at 15 pc will be confused with<br />
Venus or Mars approximately 25% of the time. We adopt this as the basis for a requirement on angular<br />
resolution. Since the mid-Habitable Zone subtends 67 mas at this distance, we require that the full-widthto-half-maximum<br />
(FWHM) of the PSF is less than or equal to 0.3 times the angle subtended by the mid-<br />
HZ:<br />
θres<br />
≤ 0.3θ<br />
MHZ<br />
(2)<br />
This is the requirement that drives the size of the array needed in most cases (Section 4.9.4).<br />
86
D ESIGN AND A R C H I T E C T U R E T RADE S TUDIES<br />
4.9.2 Point-Spread Function<br />
The point-spread function (PSF) described here is not the instantaneous response of the array on the sky.<br />
Rather, it is correlation map of the sky obtained from a point source after synthesis of all the observations<br />
(see Section 4.1). It is the analog of the PSF for an optical telescope, or the dirty beam of interferometric<br />
synthesis imaging. The PSF for a phased array is more complex than that of a standard imaging<br />
interferometer (which makes measurements from only pair-wise combinations of collectors). A full<br />
analysis that derives the structure of the PSF can be found in Lay (2005).<br />
The basic features of the PSF for the X-array (2:1 aspect ratio) are depicted in Figure 4-23. This is the<br />
broad-band version of Figure 4-4, obtained by co-adding the PSFs for several spectral channels. The main<br />
peak is centered on the cross that denotes the actual location of the point source. This main peak is<br />
flanked by four satellite peaks, each of which has a set of sidelobes. Note that the sidelobes are<br />
suppressed in the broad-band PSF relative to the monochromatic case, but the satellite peaks are not. The<br />
phase chopping described in Section 4.1 results in an inverted anti-Sun image. The number, amplitude,<br />
and location of the satellite peaks relative to the main peak are determined by the shape of the nulling<br />
configuration. We define the angular resolution of the array to be the FWHM of the main peak, which can<br />
be predicted from the average length of the imaging baselines in the configuration:<br />
λ<br />
θ ≈ 0.48 av , (3)<br />
res<br />
B img<br />
where the average wavelength was taken to be 12 μm. This relationship was used to determine the size of<br />
the array needed to observe a given star (see next section). In addition, the rms level of the satellite and<br />
sidelobe structure in the PSF was used as a metric to assess ease of deconvolution.<br />
4.9.3 Array Size Criterion<br />
Combining Eqs. (2) and (3) we obtain a requirement on the average length of the imaging baselines:<br />
λav<br />
Bimg<br />
≥ 1.6 . (4)<br />
θMHZ<br />
The criterion for inner working angle is<br />
λav<br />
Bnull<br />
≥ 0.9 . (5)<br />
θMHZ<br />
For most configurations, it is Eq. (4) that drives the size of the array needed to observe a given target. The<br />
big advantage of the X-array over other configurations is that the length of the imaging baselines is<br />
decoupled from the length of the nulling baselines; the long dimension of the array is stretched to meet or<br />
exceed the angular resolution requirement of Eq. (4), while the short dimension is held to just meet the<br />
inner working angle requirement of Eq. (5). For the other configurations in Fig. 4-8, the array size needed<br />
to meet Eq. (4) leads to null baseline lengths that greatly exceed the minimum requirement in Eq. (5) and<br />
incur a large penalty from increased stellar leakage.<br />
4.9.4 Deconvolution Approaches<br />
The ability to extract the information about the planet from the reflected light from a planet in orbit in the<br />
habitable zone of a star up to 30 pc away is crucial to the design and architecture of the <strong>TPF</strong><br />
87
C HAPTER 4<br />
interferometer. How this information is processed determines such fundamental properties as the proper<br />
geometry of the spacecraft and the size of the telescopes. It became clear early in the design stage that<br />
understanding planetary signal extraction (PSE) would be important in the Pre-Phase A design, if realistic<br />
designs were to be considered.<br />
There is an extensive literature on signal processing from Earth-bound interferometers, both optical and<br />
radio. When <strong>TPF</strong>-I was first proposed, the problem of detecting a signal was already realized as being<br />
important. The work of the PSE Working Group was to determine whether these techniques were<br />
adequate, and if not, to develop improved methods. In addition, a set of metrics was developed which<br />
was independent of signal processing technique that could be used to evaluate different architectures<br />
without the computationally expensive process of actually testing each proposed architecture with several<br />
different PSE algorithms and many different target solar systems.<br />
The basic performance parameter is SNR. In this effort, the signal is the planetary signal, which is the<br />
output of the phase-chopped interferometer. Noise comes from two sources (the star itself and extraneous<br />
light), and it comes in two ways (simple background and systematic errors). In the studies that we did,<br />
we considered only astronomic sources of background (local zodiacal and exozodiacal light), and we did<br />
not yet study systematic backgrounds and errors (imperfect maintenance of the null and thermal<br />
backgrounds from other spacecraft). The difficulty of the problem is that the SNR is inherently low,<br />
limited by finite observing times and the aperture of the telescopes, and that the most interesting signal<br />
bands are at the high and low wavelengths, where the sensitivity of the interferometer is lowest. The<br />
other fundamental problem is that any interferometer has limited coverage in the u-v plane, so the<br />
information obtained from the planetary system is fundamentally incomplete. This is exacerbated by the<br />
probability that there are multiple planets in the system, causing confusion in the signal. The combination<br />
of low SNR and incomplete information makes identifying a planet and extracting a spectrum a difficult,<br />
but not impossible, challenge. These challenges fundamentally drive the mission design.<br />
The most basic source of noise is the stellar leakage from the finite suppression of the interferometric<br />
null, which is determined by the architecture of the interferometer. For these preliminary studies, we<br />
developed a simulation that included the effects of stellar leakage, exozodical dust, and local zodiacal<br />
background, and that could simulate the light from arbitrary planetary systems. Systematic effects were<br />
not included. This simulation was independently validated by comparison to several other calculations<br />
and simulations.<br />
Many methods have been proposed for extracting the signal from background by different members of the<br />
<strong>TPF</strong>-I collaboration. In the literature, inconsistent assumptions have been made in testing various<br />
algorithms, so we decided to have a blind comparison of various algorithms using the JPL standard<br />
simulator and a small set of test cases which included solar systems which we thought would be both easy<br />
and difficult.<br />
A group of scientists from JPL, The University of Arizona, Ball Aerospace, and eventually several other<br />
organizations formed a science working group and developed several new algorithms, in addition to a<br />
baseline cross-correlation/CLEAN (CC/CLEAN) algorithm. Each of these was tested against simulated<br />
planetary systems with a realistic SNR. It was found that the CC/CLEAN algorithm did reasonably well,<br />
and improved algorithms were both proposed and implemented. While none of these have yet turned out<br />
88
D ESIGN AND A R C H I T E C T U R E T RADE S TUDIES<br />
to be a silver bullet for planet finding, the results are quite encouraging. It should be emphasized that this<br />
research is still in an early state.<br />
In order to compare architectures without running time-consuming simulations (both generating planetary<br />
systems and analyzing them), we developed a set of metrics based on the PSF, which allowed us to<br />
calculate comparative planet-finding ability between proposed architectures. These metrics were<br />
validated against the CC/CLEAN algorithm and found to be representative of the performance of different<br />
spatial configurations and telescope apertures.<br />
There is much work left to be done in this area. When this work wound down, the following items were<br />
still pending as possible future areas of research:<br />
• Identify regular and pathological solar systems – what phase space needs to be tested<br />
• Add bumps in the zodiacal background.<br />
• Incorporate prior knowledge of exozodiacal spatial covariance into a point process algorithm.<br />
This should suppress false positives.<br />
• What is the density of background objects<br />
• Do spectroscopy.<br />
• What is the optimal number of channels<br />
• How do you get a quick spectra<br />
• How do you obtain reliable spectra<br />
• How does variability of planets over observational time scales affect spectroscopy (and<br />
detection)<br />
• What is the optimal strategy for baseline selection<br />
• Investigate changing baselines to increase u-v plane coverage.<br />
• How do we set confidence limits for false positives, false negatives<br />
• Start incorporating revisit information.<br />
• Alternate approaches to cross-correlation for initial maps.<br />
• Literature search—written survey of possibilities considered and discarded.<br />
• Think of a better algorithm. Still open to new ideas.<br />
This work led to two peer-reviewed papers. Draper et al. (2006) laid out the problem, defined important<br />
metrics (such as SNR, which is more complex in this problem than it might seem), and tested various<br />
solutions. In addition, Velusamy et al. (2005) came up with a new approach at analyzing the signal which<br />
seems very promising in initial tests.<br />
89
C HAPTER 4<br />
4.9.5 Trade Study<br />
A complete description of the trade study can be found in Lay et al. (2005). The scoring process is based<br />
on the Kepner-Tregoe methodology. The idea is simple. The options are judged against a set of<br />
mandatory criteria (“musts”) and a set of discriminators (“wants”). Each must is scored as a pass/fail for<br />
each option, whereas the wants are weighted by importance and scored for each option on a scale of 1 to<br />
10. Failing a mandatory criterion disqualifies the option from consideration. The highest weighted sum of<br />
the discriminator scores determines the best option.<br />
The options in this case are the six architectures described in the Section 4.3. The list of mandatory<br />
criteria and discriminators was established through a lengthy process of iteration, based on initial inputs<br />
from a joint <strong>TPF</strong>/Darwin workshop and then edited in a series of meetings of the <strong>TPF</strong>-I Architecture and<br />
Table 4-3. Scores for Nulling Architectures Considered in Trade Study<br />
Linear DCB X-Array (2:1) Diamond DCB Z-Array Triangle Linear 3<br />
Overall score / 1000 816 860 789 749 779 795<br />
Performance 381 385 337 341 292 342<br />
Cost / risk 435 475 452 408 487 452<br />
Table 4-4. Key Discriminators in Trade Study, with Scoring Relative to Linear DCB Array<br />
Metric<br />
Linear DCB<br />
X-Array<br />
(2:1)<br />
Diamond<br />
DCB<br />
Z-Array Triangle Linear 3<br />
Performance<br />
Number of planet systems characterized by spectroscopy at<br />
high angular resolution, beyond minimum required<br />
Star count 0 0 -13 -4 -25 -19<br />
Fidelity of image reconstruction<br />
Redundancy / graceful degradation<br />
rms/peak (in Point Spread Function for<br />
planet at high res inner working angle)<br />
Expected % of stars observed after loss<br />
of 1 spacecraft<br />
0 -2 -6 -8 -14 -4<br />
0 4 -17 -6 -17 -17<br />
General astrophysics potential Dynamic range of baselines (max/min) 0 -4 -5 -10 -8 -4<br />
Cost and Risk<br />
Number of types of spacecraft # types 0 14 0 -9 0 0<br />
Mass margin Mass margin 0 0 3 3 15 6<br />
Beam transport optics complexity # hops to combiner 0 12 0 -10 0 0<br />
Beamcombiner optics complexity # parts (from schematic) 0 0 0 0 -10 -10<br />
Number of mechanisms/ moving parts # mechanisms / deployments 0 0 4 4 11 4<br />
Difficulty of integration and test # spacecraft 0 0 7 7 17 7<br />
Complexity of flight operations # spacecraft 0 0 4 4 10 4<br />
0 43 -27 -66 -33 -22<br />
90
D ESIGN AND A R C H I T E C T U R E T RADE S TUDIES<br />
Design Teams. This process involved representatives from Ball Aerospace, Lockheed Martin and<br />
Northrop Grumman. Inputs were also solicited from the <strong>TPF</strong>-I Science Working Group. Participants were<br />
asked to weight the discriminators; an average of the responses was taken to determine the initial values,<br />
and the weights were normalized so that the sum of all weights equals 100. The weights represent the<br />
relative importance given to the discriminators and are separate from any consideration of the options.<br />
Wherever possible, a discriminator was quantified using one or more metrics. For example, for the<br />
discriminator “Control system complexity” the metric chosen was the number of control loops needed for<br />
the basic array operation. These metrics helped to inform the scoring process, although scoring is<br />
fundamentally subjective. The scoring of the discriminators for each option was conducted at a 2-day<br />
meeting held at JPL in December 2004, with approximately 20 participants from JPL and the contractors.<br />
For each discriminator the best option was scored a 10, and a simple voting system was used to establish<br />
the scores for the other options. Sometimes the scores bore a linear relationship to the metrics; sometimes<br />
explicitly not. If there was little difference between the options then the scores were close together; large<br />
differences were reflected in a low score for the worst option. The contribution to the final score is given<br />
by the product of the weight and the score, with the weight reflecting the importance of the discriminator<br />
and the score showing the size of the difference between the options. The weighted sum of the scores has<br />
a maximum possible value of 1000 points for each option.<br />
After the initial round of scoring there were multiple rounds of iteration in which both the weights and<br />
scores could be adjusted. This may sound like “gaming the system,” but the intent is not that we turn the<br />
crank on the process and blindly accept the outcome; rather it is that the final table should reflect the<br />
collective engineering judgment of the group. The process is inevitably subjective (particularly the<br />
assigning of weights), but is highly transparent. It structures the analysis, focuses discussion on the key<br />
areas, and invites criticism and comment.<br />
-18 m -9 m +9 m +18 m<br />
Config A 0 ±π/2<br />
π ±3π/2<br />
Nulling baselines:<br />
Imaging baselines:<br />
B null = 27 m<br />
B img = 15 m<br />
Config B 0 π ±π/2 ±3π/2<br />
Nulling baselines:<br />
Imaging baselines:<br />
B null = 9 m<br />
B img = 27 m<br />
Figure 4-24. Schematic showing collector spacing for the Structurally Connected Interferometer. There are two<br />
different ways to phase the interferometer. In Configuration A, the nulling baselines are interleaved. In<br />
Configuration B, the nulling baselines are adjacent.<br />
91
C HAPTER 4<br />
The full set of metrics and scores for each combination of option and discriminator is listed in Lay et al.<br />
(2005). The final scores are tabulated in Table 4-3, with the breakdown into performance and cost/risk.<br />
The X-Array scored the highest, followed by the Linear Dual Chopped Bracewell. Table 4-4 gives a<br />
breakdown of the key discriminators, ie. those responsible for most of the differentials in the final scores.<br />
4.10 Structurally Connected Interferometer<br />
Prior to 2004, the <strong>TPF</strong>-I project developed designs for both a formation-flying interferometer (FFI) and a<br />
structurally connected interferometer (SCI) architecture. In the following we briefly describe the SCI<br />
design and summarize a 2006 reassessment of its planet-finding performance.<br />
4.10.1 Baseline design<br />
The SCI architecture created by the <strong>TPF</strong>-I Design Team has four 3.2-m diameter collectors, spaced along<br />
a 36-m linear structure as depicted in Fig. 4-24. The light from the collectors can be phased as a Dual<br />
Chopped Bracewell Nuller in two different ways. Configuration A has longer nulling baselines and<br />
therefore a small inner working angle, but the short imaging baselines result in poor angular resolution.<br />
a)<br />
b)<br />
c)<br />
Figure 4-25. (a) SCI with deployed thermal shade. (b) SCI with thermal shade removed. (c) End view to illustrate<br />
the ±45 degree solar shading limit.<br />
92
D ESIGN AND A R C H I T E C T U R E T RADE S TUDIES<br />
Configuration B has almost twice the angular resolution, but it has three times the inner working angle.<br />
Different views of the SCI design are shown in Fig. 4-25. The combiner optics are located at the center of<br />
the structure, as is the spacecraft bus.<br />
The 36-m length is constrained by the volume available in the shroud of the Delta IV Heavy launch<br />
vehicle (Fig. 4-26). The structure is folded at three hinge points. Further deployments are necessary for<br />
the thermal shades and secondary mirror supports.<br />
4.10.2 Performance Assessment<br />
With a maximum baseline of 36 m, the SCI has lower planet-finding capability compared to an FFI. The<br />
planet-finding process has three stages: (1) Detection of candidate planets, (2) Orbit determination, and<br />
(3) Spectroscopic characterization. Orbit determination and spectroscopy require greater angular<br />
resolution than the initial detection, and it is therefore these stages that most constrain the SCI<br />
performance.<br />
Three criteria were applied to determine those stars for which an Earth-like planet could be detected and<br />
characterized: (a) Inner Working Angle (IWA) — at least 50% of the planet’s orbit must lie outside the<br />
IWA, averaged over all inclinations, (b) Angular resolution — the planet should be unconfused with other<br />
planets at least 50% of the time, and (c) Spectroscopy time — no more than 100 days of integration time<br />
is allowed to achieve an SNR of 5 relative to the continuum over 9.5–10 μm (for detection of ozone). The<br />
angular resolution criterion was evaluated by calculating the fraction of time that a planet in an Earth-like<br />
orbit would be confused (i.e., not resolved as a separate entity) with either a Venus or Mars analog.<br />
2b<br />
2a<br />
1b<br />
1a<br />
2<br />
3a<br />
3b<br />
3<br />
Outer<br />
Collector<br />
Inner<br />
Collector<br />
Deployment of each arm<br />
occurs in 3 steps:<br />
1) Rotation of folded arm<br />
assembly about s/c y-axis<br />
2) Rotation of short<br />
segment into final position<br />
3) Rotation of outer<br />
segment into final position<br />
1<br />
2 3<br />
1<br />
Figure 4-26. Stowed configuration for launch on a Delta-IV Heavy and schematic of on-orbit<br />
deployment sequence.<br />
93
C HAPTER 4<br />
based on SNR 1.01.xls<br />
30.00<br />
25.00<br />
All (1014)<br />
50 days<br />
100 days<br />
200 days<br />
> 200 days<br />
Distance / pc<br />
20.00<br />
15.00<br />
10.00<br />
5.00<br />
0.00<br />
7<br />
12<br />
13<br />
9<br />
35<br />
6<br />
4<br />
1<br />
0 50 100 150 200 250 300 350<br />
MHZ semi-major angle / mas<br />
8<br />
10<br />
19<br />
29 candidates require < 100 days<br />
Figure 4-27. Candidate stars available for a 36-m SCI mission. Stars in the maroon area are excluded by the<br />
IWA criterion. Stars in the blue and maroon areas are excluded by the confusion criterion. The stars are colorcoded<br />
according to the integration time needed to detect ozone with an SNR = 5 (see legend). The small numbers<br />
indicate the integration times for specific nearby examples. The large numbers show the number of observable<br />
targets in each integration bin. The dashed line encloses (almost) the region containing the 29 observable stars<br />
with characterization times of less than 100 days. See Section 5.9 for an introduction to this representation of the<br />
target stars.<br />
For a planet orbit that just meets both the IWA and angular resolution criteria, only 1/16 th of the orbit is<br />
available on average for orbit determination (planet lies inside IWA 50% of the time; planet is confused<br />
50% of the time; and star is observable 25% of the time due to ±45 degree solar shading constraint).<br />
Figure 4-27 shows how the application of the three criteria results in 29 candidate target stars for the<br />
Configuration B phasing (Fig. 4-24). For Configuration A, the smaller IWA pushes the red zone well to<br />
the left, but the poor angular resolution increases the confusion and extends the blue zone out to beyond<br />
200 mas, greatly reducing the number of candidate targets. Figure 4-28 illustrates how the performance<br />
capability degrades rapidly as the length of the structure is reduced below 36 m.<br />
94
D ESIGN AND A R C H I T E C T U R E T RADE S TUDIES<br />
60<br />
50<br />
36 m 30 m 20 m<br />
50 days<br />
100 days<br />
200 days<br />
# candidates<br />
40<br />
30<br />
20<br />
10<br />
0<br />
100 150 200 250 300 350<br />
MHZ / mas<br />
Figure 4-28. Dependence of the number of candidate target stars on the array length. For the 100-day limit on<br />
spectroscopic integration time (orange curve), the nominal 36-m design has access to 29 stars. Shrinking this to 30<br />
m extends the maroon and blue areas to the right by a factor of 36/30 in Fig. 4-27 and reduces the number of stars<br />
available to 12. For a 20-m structure this is reduced to 3. Increasing the allowed integration time to 200 days does<br />
not dramatically improve the performance (red curve).<br />
4.10.3 Summary<br />
The major advantage of the SCI architecture is that it does not require the new technology of formation<br />
flying. The maximum size of 36 m is constrained by the volume of the launch shroud, and limits the IWA<br />
and angular resolution. The demands of orbit determination and spectroscopy limit the number of<br />
candidate stars to less than 30. This number falls off rapidly as the array size is reduced.<br />
95
C HAPTER 4<br />
4.11 References<br />
Angel, J. R. P., and Woolf, N. J., “An imaging nulling interferometer to study extrasolar planets,”<br />
Astrophys. J. 475, 373–379, (1997).<br />
Beichman, C. A., Woolf, N. J., and Lindensmith, C. A., Terrestrial Planet Finder: a <strong>NASA</strong> Origins<br />
program to search for habitable planets, JPL Publication 99-3, Jet Propulsion Laboratory, Pasadena, CA<br />
(1999).<br />
Draper, D. W., Elias, N.M., II, Noecker, C., Dumont, P. J., Lay, O. P. and Ware, B., “Planet Signal<br />
Extraction for the Terrestrial Planet Finder Interferometer,” Astron. J. 131, 1822–1836 (2006).<br />
Dubovitsky, S., and Lay, O. P., “Architecture selection and optimization for planet-finding<br />
interferometers,” Proc. SPIE 5491, 284–295 (2004)<br />
Hamlin, L. A., Henry, C. A., Adams, D. S., MacNeal, P. D., Cardone, J. M., and Holm, R. G. “Current<br />
status of the Terrestrial Planet Finder structurally connected interferometer concept,” edited by R. B.<br />
Hoover, G. V. Levin, A. Y. Rozanov; Proc. SPIE 5555, 231–240 (2004).<br />
Karlsson, A. L., Wallner, O., Perdigues Armengol, J. M., and Absil, O., “Three telescope nuller based on<br />
multi beam injection into single-mode waveguide,” New Frontiers in Stellar Interferometry, Proc. SPIE<br />
5491, 831–841 (2004).<br />
Kelsall, T., Weiland, J. L., Franz, B. A., Reach, W. T., Arendt, R. G., Dwek, E., Freudenreich, H. T.,<br />
Hauser, M. G., Moseley, S. H., Odegard, N. P., Silverberg, R. F., and Wright, E. L., “The COBE diffuse<br />
infrared background experiment search for the cosmic infrared background. II. Model of the<br />
interplanetary dust cloud,” Astrophys. J. 508, 44–73 (1998).<br />
Kepner, C. H., and Tregoe, B. B., The New Rational Manager, Princeton Research Press, Princeton, NJ<br />
(1981).<br />
Lay, O. P., “Systematic errors in nulling interferometers,” Appl. Opt. 43, 6100–6123 (2004).<br />
Lay, O. P., and Dubovitsky, S., “Nulling interferometers: the importance of systematic errors and the X-<br />
array,” Proc. SPIE 5491, 874–885 (2004).<br />
Lay, O. P., “Imaging properties of rotating nulling interferometers,” Appl. Opt. 44, 5859–5871 (2005)<br />
Lay, O. P., Gunter, S. M., Hamlin, L. A., Henry, C. A., Li, Y-Y., Martin, S. R., Purcell, G. H., Ware, B.<br />
J., Wertz, A., Noecker, M. C., “Architecture trade study for the Terrestrial Planet Finder interferometer,”<br />
Proc. SPIE 5905, 8–20 (2005).<br />
Lay, O. P. “Removing Instability Noise in Nulling Interferometers,” Proc. SPIE 6268, 62681A (2006).<br />
96
D ESIGN AND A R C H I T E C T U R E T RADE S TUDIES<br />
MacNeal, P. D., Adams, D. S., Henry, C. A., Blackhall, H. G., and Cardone, J. M., “Structural<br />
configuration for the Terrestrial Planet Finder structurally connected interferometer concept,” edited by J.<br />
Antebi and D. Lemke, Proc. SPIE 5495, 383–393 (2004).<br />
Noecker, C., Wei, Z., and Decino, J. “Stray light estimates for the <strong>TPF</strong> formation flying interferometer,”<br />
Proc. SPIE 5526, edited by P. T. C. Chen, J. C. Fleming, and M. G. Dittman, 249–256 (2004).<br />
Noecker, C., and Lieber, M., “Terrestrial Planet Finder control system requirements for structurally<br />
connected interferometers,” edited by W. A. Traub, Proc. SPIE 5491, 373–382 (2004).<br />
Noecker, C. and Leitch, J., “Beam transport for the <strong>TPF</strong> interferometer,” Techniques and Instrumentation<br />
for Detection of <strong>Exoplanet</strong>s II, edited by D. R. Coulter, Proc. SPIE 5905, 590504 (2005).<br />
Peters, R. D., Lay, O. P., Hirai, A., and Jeganathan, M., “Adaptive nulling for the Terrestrial Planet<br />
Finder Interferometer,” Proc. SPIE 6268, 62681C (2006).<br />
Serabyn G., and Mennesson, B., “<strong>TPF</strong> Interferometer architecture drivers and implementation,” Proc.<br />
2004 IEEE Aerospace Conf., Big Sky, MT, 4, 2144–2155, (2004).<br />
Velusamy, T., Marsh, K. A., Ware, B., “Point Process Algorithm: A New Bayesian Approach for <strong>TPF</strong>-I<br />
Planet Signal Extraction,” Direct Imaging of <strong>Exoplanet</strong>s: Science and Techniques, Proc. IAU Colloquium<br />
200, editors Aime C., and Vakili, F., Cambridge University Press, Cambridge, UK, pp. 621–626 (2006).<br />
97
<strong>TPF</strong>-I F L I G H T B ASELINE D ESIGN<br />
5 <strong>TPF</strong>-I Flight Baseline Design<br />
5.1 Introduction<br />
In this chapter we describe the design and performance capability of the nominal formation-flying<br />
interferometer (FFI) architecture. This is the stretched X-array configuration. Prior to the trade study<br />
described in the previous chapter, the baseline design was the linear dual chopped Bracewell<br />
configuration. The X-array 2:1 was the highest ranked in the trade study, but it was superseded by the<br />
stretched X-array, with its ability to eliminate instability noise.<br />
The array geometry is summarized in the next section, followed by a description of the spacecraft design<br />
in Section 5.3 and the optics in Section 5.4. The sensitivity to planets is shown in Section 5.5 with the<br />
inner and outer working angles, and Section 5.6 shows the stars that can be surveyed for planets. The<br />
spectroscopic sensitivity is given in Section 5.7, followed by the imaging capabilities in Section 5.8.<br />
5.2 Array Geometry<br />
Figure 5-1 shows the stretched X-array geometry. All spacecraft lie in a plane normal to the direction of<br />
the incoming starlight. The beams are then routed to the central combiner spacecraft in a single hop. The<br />
aspect ratio is 6:1.This is still a dual chopped Bracewell design; the nulling baselines (π phase difference)<br />
are along the short dimension of the array, and the imaging baselines form the long sides and diagonals.<br />
The phases are inverted to switch between the two chop states. The collector spacecraft are identical, and<br />
have apertures with a diameter of 3.8 m, consistent with packaging into the shroud of a Boeing Delta IV<br />
0<br />
±π/2<br />
±π<br />
±3π/2<br />
Figure 5-1. The stretched X-array configuration. Blue circles represent collector spacecraft, and the<br />
yellow circle is the central combiner spacecraft. Numerical values represent the relative phasing of<br />
each collector as implemented in the beam combiner<br />
99
C HAPTER 5<br />
Heavy launch vehicle. The minimum array size of 120 × 20 m is constrained by the desire to maintain at<br />
least 20 m separation between the centers of the spacecraft. The maximum array size of 612 × 102 m is<br />
limited by the maximum distance (311 m) over which the beams can be relayed without introducing<br />
significant amounts of stray light for the thermal shields. These constraints result in a dynamic range of<br />
5:1 in the array size.<br />
Figure 5-2. The main optical components of the collector telescope spacecraft.<br />
100
<strong>TPF</strong>-I F L I G H T B ASELINE D ESIGN<br />
5.3 Optical Beam Train<br />
5.3.1 Collector Spacecraft<br />
The beam train consists of the following main elements. First the collector telescopes, a three-mirror<br />
design. Beneath the telescope primary mirror, see Figure 5-2, are systems for maintaining pointing at the<br />
star and internal alignment and metrology systems. A deformable mirror (DM) is included in the<br />
beamtrain to allow wavefront correction; further analysis will be needed to examine the necessity for this<br />
unit and its range of operation. Following recollimation of the beam, a number of fold mirrors transmit<br />
the beam up to near the top of the telescope body and send it to the next spacecraft. The next spacecraft<br />
then relays the beam to the beamcombiner spacecraft.<br />
Cold Sunshade<br />
Deployment Booms<br />
Stray Light Baffle<br />
Payload Cryo Radiator<br />
4-m Diameter<br />
Telescope Aperture<br />
Five Layer<br />
Sunshade<br />
Warm Sunshade<br />
Deployment Booms<br />
15.3 m<br />
Body-Fixed<br />
Solar Arrays<br />
Spacecraft Bus<br />
Thruster Modules<br />
Figure 5-3. Collector Spacecraft.<br />
101
C HAPTER 5<br />
5.3.2 Combiner Spacecraft<br />
On the beamcombiner spacecraft, the beam is first compressed from approximately 150 mm in diameter<br />
to 30 mm in diameter, and it passes through a multistage delay line. Following the delay line, it enters the<br />
adaptive nuller where the phase and amplitude are adjusted across the spectral band. After the adaptive<br />
nuller it enters a switch, which allows selection of T1–T2, T3–T4 or T1–T3, T2–T4 beam combination.<br />
Then it enters the nuller itself, at which point the fringe tracking light is separated from the science<br />
beams. After nulling and interfering the beams at the appropriate phases, the science light enters a single<br />
spatial mode fiber, and then it is dispersed spectrally before striking the science detector. Numerous beam<br />
train systems exist to maintain and adjust the alignment and the collector spacecraft phase of the beams.<br />
These will be discussed below.<br />
Cold Sunshade<br />
Deployment Booms<br />
Stray Light Baffle<br />
Payload Cryo Radiator<br />
Cryogenic Nulling<br />
Beam Combiner<br />
Five Layer<br />
Sunshade<br />
Body-Fixed<br />
Solar Arrays<br />
Warm Sunshade<br />
Deployment Booms<br />
15.3 m<br />
Thruster Modules<br />
Spacecraft Bus<br />
Gimballed High<br />
Gain Antenna<br />
Figure 5-4. Combiner Spacecraft<br />
102
<strong>TPF</strong>-I F L I G H T B ASELINE D ESIGN<br />
5.3.3 Telescope Assembly<br />
The telescope design is a three-mirror anastigmat design using conic sections: the primary is an ellipse;<br />
the secondary is a hyperbola; and the tertiary is an ellipse. After reflection from the secondary, the beam<br />
passes through a hole in the center of the primary and is folded into a plane beneath the primary. The<br />
primary mirror has a diameter of 4.0 m, and the secondary has a diameter of 0.3 m, giving an obscuration<br />
ratio of ~0.023, excluding spiders and mounts. An offset field angle used in previous designs was<br />
eliminated to reduce the number of differences between the left and right sets of collector telescopes. The<br />
new design was also required to have a very uniform wavefront performance across the field of view.<br />
This is to ensure that as the telescope drifts in space, the Strehl ratio remains the same, so that the<br />
coupling onto the single mode fiber at the end of the beamtrain does not vary. This ensures that the null<br />
depth will remain constant during the observation. It was not considered desirable to continuously operate<br />
the DM to compensate for these small wavefront changes. A mirror placed between the tertiary and the<br />
DM acts as a field of regard (FOR) mirror; it tilts to bring light from a chosen star into the main beam<br />
path and maintains that alignment continuously during observations.<br />
Figure 5-5. Beam transits between spacecraft are made as nearly as possible across diameters. The beam<br />
layout ensures that no angle changes as the formation expands. The layout also gives maximum shading<br />
from the sunshields; each mirror looks across the width of the spacecraft.<br />
5.3.4 Beam Train Optics<br />
Beneath the primary mirror, the beam strikes a fold mirror that tilts to bring the starlight into the main<br />
beam path. Next it strikes the third mirror of the three-mirror telescope and the FOR dichroic mirror.<br />
Behind this dichroic mirror are an alignment beam launcher and a metrology beam retro-reflector. Next,<br />
the beam strikes the DM, which corrects static wavefront errors. This pair of mirrors (the DM and the<br />
FOR) is controlled from the output of sensors placed behind the WFS/FGS dichroic, next in line, which<br />
separates out some light from the star for pointing and wavefront sensing. Next the beam is recollimated<br />
and transmitted to the top of the spacecraft. An active pointing mirror relays it to the next spacecraft.<br />
103
C HAPTER 5<br />
5.3.5 Beam Transfer between Spacecraft<br />
The active pointing mirror is controlled by beam shear sensors located behind a mirror on the next<br />
spacecraft. This continuously relays signals via an RF system to maintain accurate pointing. For<br />
interspacecraft transfers, the mirrors are arranged so that there is maximum shielding of the mirror from<br />
the sunshade of the next spacecraft. This is important for stray light mitigation. In earlier <strong>TPF</strong>-I designs,<br />
the number of folds and their angles were maintained in a symmetric fashion for each beamtrain. In this<br />
design, the fold angles are allowed to vary resulting in easier engineering of the layout and the<br />
consequential small asymmetries are compensated for by the adaptive nuller.<br />
Figure 5-6. First side of vertical optical bench.<br />
Figure 5-7. Second side of vertical optical bench.<br />
5.3.6 Stray-Light Modeling<br />
Analysis showed that for a beam transfer mirror a view of the opposite spacecraft’s sunshade, particularly<br />
the gap between the topmost shades, would admit an excessive number of stray-light photons into the<br />
science beam. This is because of the small imperfections of real mirrors and the need to detect extremely<br />
low levels of light from the target. Two stray-light analyses were performed, one a simple spreadsheet<br />
analysis and the other using an optical modeling code known as FRED (developed by Photon<br />
Engineering). Good agreement was obtained between these models for collector–collector transfers. Both<br />
models showed that for beam transfer heights 4 m above the sunshades, the collector–collector separation<br />
could be as much as 165 m. Baffle diameter was 125 mm at the transmitting spacecraft and 150 mm and<br />
the receiving spacecraft. Further analysis is needed for beam transfers between collector and combiner.<br />
5.3.7 Combiner Spacecraft<br />
The combiner spacecraft contains the majority of the optical systems. Each beam train is replicated<br />
exactly with minor differences at the simplified nuller. The top of the spacecraft receives the beams in a<br />
“maximum shading” arrangement and folds them down onto one side of a two-sided vertical main bench,<br />
see Figure 5-6. Here the beams are compressed to 30 mm diameter and passed through multistage delay<br />
lines before passing through to the opposite side of the bench and entering the adaptive nullers as shown<br />
in Figure 5-7. At the output of the adaptive nullers the beams are sent to the switch and into the nulling<br />
104
<strong>TPF</strong>-I F L I G H T B ASELINE D ESIGN<br />
beamcombiner. The exit pupil of the adaptive nuller forms the pupil of the beamcombiner system. The<br />
nuller bench is appended to the base of the vertical bench.<br />
5.3.8 Beam Conditioning<br />
The beam conditioning systems are: pupil stops and apertures to define the beams and restrict stray light,<br />
DM (on the collector spacecraft), adaptive nuller to tune amplitude and phase across the spectrum, delay<br />
lines for coarse through fine stages of fringe acquisition, and pointing and shear detectors for both<br />
interspacecraft beam transfers and for internal alignment principally on the beamcombiner spacecraft.<br />
Another system needed in the FFI design allows adjustment of the polarization angle of the incoming<br />
beams which can change as the spacecraft drift. The final system is the single mode spatial filter placed<br />
before the science detector. This selects the fundamental mode of the beam and reduces the sensitivity to<br />
shear and pointing misalignments as well as higher order beam asymmetries.<br />
5.3.9 The Adaptive Nuller<br />
The adaptive nuller consists of a deformable mirror placed at the focus of a parabolic mirror in an<br />
arrangement similar to a cat’s eye delay line. At the focus, the input beam is dispersed in wavelength and<br />
separated into two orthogonally polarized stripes. By pistoning the mirror elements, phase can be added<br />
or subtracted from different spectral regions of the beam; and by tilting the mirror elements across the<br />
length of the stripe, the pointing of the output beam can be varied. By clipping the output beam against an<br />
aperture, the beam intensity can be varied for a particular range of wavelengths. One of these systems is<br />
placed in each beam, and it allows the correction of small differences in throughput and phase between<br />
beams arising from alignment changes and variations between optical components throughout the beam<br />
train. This capability operates independently on orthogonal polarizations.<br />
5.3.10 Delay Lines<br />
A multistage delay line is conceived for this system. A coarse stage of >20 cm range allows initial<br />
acquisition of the fringe and it is then parked. Subsequent stages allow range adjustment from 50 pm to 5<br />
cm in three stages. The fine stage is a high speed stage based on a similar concept to stages used in JPL’s<br />
Planet Detection Testbed3. These are re-actuated piezo-electrically driven stages capable of moving a 50<br />
mm diameter mirror a distance of 3 mm at a rate of more than 2 kHz. The fine stage is a separate item<br />
mounted on the second side of the optical bench. The other two stages form a single unit with voice coil<br />
actuation. The operating ranges of the three stages overlap the regions 50 pm to 50 nm, 50 nm to 50 μm,<br />
and 50 μm to 50 mm.<br />
5.3.11 Alignment System<br />
Pointing and shear detectors are located at various stages in the system. A full-aperture alignment beam<br />
produced by a laser mounted on the collector spacecraft is co-aligned with the science light and used for<br />
beam shear or pointing sensing at interspacecraft transfers, after the compressors and after the adaptive<br />
nullers. The same beam is used for polarization angle sensing and correction on the beamcombiner<br />
spacecraft immediately after the compressors. Pointing adjustments are made at the last mirror before<br />
transmission to the next spacecraft, at the entrance to the compressor, and possibly at the entrance to the<br />
nullers (depending on the predicted stability). Pointing and shear corrections are made at the entrance to<br />
the adaptive nuller.<br />
105
C HAPTER 5<br />
Figure 5-8. Control scheme: telescopes spacecraft.<br />
5.3.12 Simplified Nuller<br />
For the FFI design work, one desire was to try to simplify the MMZ nuller used for the SCI design. The<br />
main benefits would be that only one internal laser metrology beam would be needed for each beam of the<br />
interferometer rather than two, the attenuation or round trip insertion loss would be less for the metrology<br />
light, and the science light would emerge on only two beams rather than four, offering a small but<br />
significant improvement in signal to noise ratio at the detector. There would also be associated<br />
engineering simplifications. Because of the wide spectral band to be covered by <strong>TPF</strong>-I, the nuller is<br />
actually divided into two units stacked next to one another, one operating on the wavelength range 7 to<br />
11 μm and the other on the range 11 to 17 μm. This arrangement necessitates an additional metrology<br />
path and possibly a second fringe tracking system. By splitting the spectrum, we generate less demanding<br />
coating requirements on the beamsplitters, which must give a near 50/50 split for the highest efficiency.<br />
Also, single spatial-mode filters (which cover these spectral bands) are expected to become available.<br />
The simplified nuller uses a beamsplitter/compensator plate arrangement to obtain a near-match of optical<br />
path across the waveband. Residual error in reflection/transmission ratio (R/T) is taken up using one<br />
specially fabricated coating on one side of the compensator plate. Models showed that throughput could<br />
then be matched across the spectral band on both incoming beams to better than 1%. The residual<br />
amplitude and phase errors are then well within the compensation range of the adaptive nuller.<br />
106
<strong>TPF</strong>-I F L I G H T B ASELINE D ESIGN<br />
5.3.13 Science Detector and Fringe Tracking<br />
The science detector operates on the two complementary outputs of the cross-combiner. Light emerging<br />
from the cross-combiner is focused through the single-mode spatial filter (subject of a <strong>TPF</strong>-I technology<br />
development effort) and then dispersed through a prism before being detected on the science array. Since<br />
only two beams are output from each cross-combiner, a single science detector array (nominally a Si:As<br />
array) can handle all four beams from the pair of cross-combiners.<br />
The nuller layout includes a fringe-tracking camera which detects the phase on each nuller and on the<br />
cross-combiner. One beam from each nuller is extracted from the rejected light output (all the 7- to 17-μm<br />
wavelength starlight exits the system from this output) and is dispersed onto the camera array. From the<br />
cross-combiner, two beams are extracted, so a total of four beams are sensed at the array. For the second<br />
cross-combiner, a second fringe tracker would be needed unless a laser metrology could be used to<br />
transfer measured phase to the second nuller.<br />
5.4 Control System<br />
With so many moving parts the observatory requires an extensive control system. The basic requirements<br />
for nulling performance to meet our planet-detection goals imply amplitude control of the incoming<br />
beams to 0.1%, and phase control of the beams to 2 nm across the band. In turn, the amplitude control<br />
requirement can be broken down into a pointing and shear requirement at the input to the spatial filter.<br />
Mirrors that move cause translation of the beams at other mirrors and because of mirror imperfections and<br />
non-uniformities. This can change the phase and distribution of phase and amplitude across the passband,<br />
changing the null depth and introducing a noise component into the signal. The full complexity of these<br />
and other effects (for example, diffraction effects over long beam paths) is yet to be modeled, but the<br />
basic layout of the control system can be deduced from experience in the nulling laboratory and the<br />
modeling that has been done so far. In smaller systems null depths of 10 -6 , adequate for the performance<br />
needs of <strong>TPF</strong>-I, have been reached using monochromatic light, and work is in progress to extend these<br />
results to broader spectral bands and to systems which null on two pairs of beams. The Keck<br />
Observatory’s nuller control system also shares features of the <strong>TPF</strong>-I design although the layout is<br />
somewhat different. The Planet Detection Testbed incorporates a number of the control systems<br />
envisioned for <strong>TPF</strong>-I.<br />
For deep nulling, the optical properties of the two incoming beams need to be matched to a high degree.<br />
The single-mode spatial filter can alleviate some of these requirements, so for example, incoming beam<br />
tilt and shear errors do not have to be so finely controlled as a simple analysis would suggest. Even so, for<br />
the flight design, the pointing requirement will be on the order of 1 arc seconds, and the shear requirement<br />
will be about 1.2% of beam diameter. The polarization rotation angle matching requirement is about 2 arc<br />
minutes. Before corrective action by the flight system, the telescope attitude can drift in space to angles as<br />
much as 1 arc min from the star, and this would result in a similar rotation of the polarization of the<br />
telescope’s output beam. After transfer through the second collector and into the beamcombiner, and<br />
allowing for static errors in the setup, the requirement could be exceeded unless correction is possible.<br />
107
C HAPTER 5<br />
Figure 5-9. First section of beamcombiner spacecraft control system.<br />
The basic control scheme is laid out in the series of Figures 5-8 through 5-11. Some alignments will take<br />
place continuously, and others will take place occasionally; these have been differentiated using different<br />
gray shades for calibration-phase and observation-phase processes. Calibration-phase processes might<br />
take place once every few hours up to once every few days, depending on the stability of the systems<br />
involved. Observation-phase processes will have characteristic times of milliseconds up to minutes.<br />
5.4.1 System Summary<br />
The system is briefly summarized here, and more detail is added in the following section. Referring to<br />
Figure 5-8, starlight enters the main beam train at the FOR mirror and starts its journey to the<br />
beamcombiner. A fine-guidance sensor behind the dichroic mirror controls the FOR mirror and maintains<br />
pointing on the star. A pointing light sensor and an alignment mirror allow the starlight and an alignment<br />
beam to be accurately co-aligned in the beamtrain. Also, a wavefront sensor allows sensing of any<br />
primary mirror aberrations which would be corrected by the DM. A metrology retroreflector reflects fullaperture<br />
metrology, co-aligned with the starlight, back to the beamcombiner spacecraft. An internalalignment<br />
mirror is included to facilitate any necessary post-launch adjustments, and then the science<br />
beam and alignment beam leave the telescope spacecraft via a pointing mirror. This pointing mirror is<br />
controlled from a shear sensor located on the next collector spacecraft, requiring a control loop running<br />
through the radio frequency (RF) link. Similarly, a pointing mirror on the second telescope is controlled<br />
by a shear sensor on the beamcombiner spacecraft (lower box on Figure 5-8). Thus, the science light,<br />
alignment, and metrology beams arrive at the beamcombiner spacecraft.<br />
108
<strong>TPF</strong>-I F L I G H T B ASELINE D ESIGN<br />
Figure 5-10. Second section of beamcombiner spacecraft control system.<br />
Figure 5-11. Final section of beamcombiner spacecraft control system.<br />
109
C HAPTER 5<br />
Figure 5-9 shows the first section of the beamcombiner beamtrain. A coarse pointing mirror controlled<br />
from a sensor further down the beamtrain directs the light through the compressors and K-mirrors. The K-<br />
mirrors are controlled by tilt sensors located next in line, allowing small angular deviations in the<br />
polarization vector of the science beam to be controlled. Next the beams pass the metrology<br />
injection/extraction point (Figure 5-10) where laser metrology beams are directed up to the telescope retro<br />
and also down to the beamcombiner retro at the end of the beamtrain following the cross-combiner. The<br />
beams enter the delay lines, which are controlled by inputs from the downstream fringe trackers and also<br />
from the laser metrology gauges. The high-speed delay line is in fact located separately slightly further<br />
down the beamtrain. The beams are then accurately aligned in shear and pointing prior to entering the<br />
adaptive nullers. Accurate pre-alignment is necessary here because the adaptive nullers function by<br />
controlling beam shear at the output and require accurate pointing onto the focal plane, so these<br />
parameters must be fixed at the input. Therefore, the pointing and shear sensors immediately precede the<br />
adaptive nullers; these same sensors also control the coarse pointing mirrors previously mentioned. Each<br />
laser metrology beam has its own alignment mirror, which would only be adjusted occasionally.<br />
The adaptive nuller is set up during the calibration phase using data acquired by the science camera,<br />
removing small amplitude and phase differences across the waveband so that the nulling performance can<br />
be optimized.<br />
Figure 5-11 shows the final section of the beamtrain. Only one set of nullers is shown, but there would<br />
also be a split to separate the 7- to 11-μm waveband from the 11- to 17-μm waveband. After the split, a<br />
second set of pointing sensors is required to actuate fast-pointing mirrors, which control the final part of<br />
the beamtrain. The beams then enter the nullers, and at the exit an optical path chop (OPD is used rather<br />
than phase chop because there is only a small efficiency reduction) is applied in one beam, controlled by<br />
the OPD control system utilizing both fringe tracker and metrology data. The science beams are then<br />
cross-combined, and the internal laser metrology is retroreflected to the launchers. Finally, the science<br />
beam is filtered to a single spatial mode, angularly dispersed, and focused onto the science camera.<br />
5.4.2 Optical Metrology<br />
A polarized laser beam is launched from behind the FOR mirror on each collector towards the combiner.<br />
See Figure 5-11. This beam is used throughout the beamtrain for the pointing and shear metrology and for<br />
polarization rotation metrology.<br />
5.4.3 Pointing Metrology<br />
Short wavelength radiation from the star (0.8 to 1.0 μm) is focused onto a sensor behind the dichroic<br />
mirror on the collector spacecraft. Its position on the sensor is controlled by the FOR mirror, thus forming<br />
a loop controlling the angle of the starlight with respect to the beam train. A polarized laser beam of<br />
wavelength 850 nm is launched behind the FOR mirror and sensed on another sensor behind the dichroic<br />
mirror also shown in Figure 5-12. The laser beam is pointed using a tilt mirror behind the FOR mirror,<br />
thus forming another closed pointing loop. Calibrations can be made to co-align the stellar beam and the<br />
laser beam by integrating the starlight on the laser sensor with the laser turned off. Thus, a bright<br />
reference beam for the science beam is formed and can be used downstream for maintaining alignment.<br />
110
<strong>TPF</strong>-I F L I G H T B ASELINE D ESIGN<br />
The beam angle is also sensed and corrected on the beamcombiner spacecraft just before entering the<br />
adaptive nullers. Simple lens and quad cell assemblies suffice for sensing and a high speed tip/tilt mirror<br />
corrects the angle in conjunction with a coarse pointing mirror located at the input to the compressors. An<br />
additional stage of pointing correction is needed before entry to the beamcombiner to allow for<br />
misalignments introduced by the switch and the 11–17 μm split.<br />
Figure 5-12. Telescope ancillary optical components.<br />
Figure 5-13. Transfer mirror shear sensor.<br />
111
C HAPTER 5<br />
5.4.4 Shear Metrology<br />
Shear metrology uses the same laser beam as the pointing system; the two systems are closely coupled.<br />
By placing a pupil stop at the FOR mirror, the alignment laser beam and the starlight have the same initial<br />
shear. Shear is first sensed after transfer to the next collector by a dichroic mirror with a set of lenses<br />
placed behind it (Figure 5-13). This dichroic lets through a portion of the 850-nm radiation, but the<br />
dichroic reflects most of it together with all the other useful light. The sensor output is run back to the<br />
transfer mirror on the first spacecraft to point the beam at the center of the dichroic shear sensor mirror.<br />
An identical method is used for transfer to the beamcombiner spacecraft. Once inside the beamcombiner,<br />
the shear is again sensed after the delay lines and corrected before entry to the adaptive nullers.<br />
5.4.5 Polarization Rotation<br />
Polarization-rotation metrology uses the same laser beam as the pointing system. The beam is initially<br />
polarized, and this forms a reference for beamtrain-induced rotations of the polarization angle. On arrival<br />
at the beamcombiner spacecraft, the beam is compressed and then passed through a K-mirror assembly,<br />
which allows the polarization angle to be rotated. A polarization-angle sensor is placed immediately after<br />
the K-mirror; thus, a loop can be formed to allow continuous correction of the polarization angle.<br />
Figure 5-14. Metrology scheme for simplified nulling beamcombiner.<br />
112
<strong>TPF</strong>-I F L I G H T B ASELINE D ESIGN<br />
This polarization control loop is needed because although the adaptive nuller can (in principle) correct for<br />
the rotation error by adjusting intensities, it cannot do so on the timescales consistent with formation-drift<br />
motions. Note that there is an unsensed rotational component caused by clocking of the telescopes around<br />
the line-of-sight to the star; this would need to be known and sensed by means probably involving<br />
transfer-mirror angle knowledge.<br />
5.4.6 OPD Metrology<br />
The OPD metrology system forms part of the fringe tracking system and effectively extends the<br />
frequency response of that system up to several hundred hertz. The fringe tracker relies on light from the<br />
star and typically will sense some 107 photons per second. Calculations show that the response time of<br />
the fringe tracker will be ~ 0.01 second, and the OPD control-time constant will therefore be ~ 0.1<br />
second. This is most likely inadequate given that the expected spacecraft vibration will extend to many<br />
tens of hertz with appreciable amplitudes (see below). Therefore, a laser metrology system operating at<br />
wavelengths near 1550 nm is used to sense and allow control of the higher frequency vibrations using<br />
principally the high-speed stage of the delay line.<br />
Key elements of the metrology system are that it fills the aperture of the science beam, it measures down<br />
to the last beamsplitter, and it measures (as far as possible) only internal optical path. One area of the<br />
beam train is unsensed at present, that is the section from the FOR mirror to the primary mirror. It is<br />
worth noting that one possible motion cannot in any case be sensed, and that is high speed motion of the<br />
primary mirror with respect to the star; more on this issue later. The metrology system is divided into two<br />
components, internal and external, as shown in Figure 5-14. Internal metrology extends from the<br />
launchers just ahead of the delay lines down to a single retroreflector following a dichroic mirror placed<br />
after the cross-combiner beamsplitter. Beams from the four input paths are differentiated by having<br />
different heterodyne frequencies. External metrology extends from the same launch dichroic to a<br />
retroreflector placed behind the FOR mirror. These beams could all run at the same frequency shift,<br />
assuming no interference via the beamcombiner retroreflector, but would have a different wavelength<br />
from the internal metrology, nominally 1570 nm. The reference point for both internal and external<br />
metrology is at the launch dichroic, a complex custom optic. Metrology pointing and shear correction is<br />
active during calibration periods and consists of adjusting the mirrors placed behind the launch dichroic to<br />
maximize the return signal from the collector and combiner retroreflectors. Once set, these should require<br />
infrequent adjustment since the alignment is maintained by the separate alignment system.<br />
5.5 Optomechanical Layout<br />
5.5.1 Beamcombiner spacecraft<br />
The four beams enter at the top of the spacecraft as far away as possible from the plane of the sunshades.<br />
The maximum shading principle is followed so that the beams cross over the center of the spacecraft. One<br />
side of the vertical bench supports the compressors and delay lines, the metrology launchers/receivers, the<br />
K-mirrors and the tilt sensors. The other side supports the adaptive nullers, the high/low resolution<br />
switch, and the shear and pointing sensors and actuators. The whole assembly will be contained within a<br />
cylindrical cover. The adaptive nullers are angled away from the bench because they have prisms at the<br />
entrance and exit, and these prisms refract the light away from the plane of the bench.<br />
113
C HAPTER 5<br />
Figure 5-15. <strong>TPF</strong>-I Flight formation of telescopes for a linear dual-chopped Bracewell array.<br />
The nullers are built as a separate unit attached to the base of the bench together with the fringe tracking<br />
cameras and the science detector. These detectors could (alternatively) be attached to the vertical bench,<br />
and the light would be brought in via optical fibers. Below the vertical bench is a thermal shield<br />
separating it from the spacecraft main bus and the other spacecraft systems, including the solar shade.<br />
Since the science detector requires cooling to 7 K, the bus also carries a cryocooler.<br />
5.6 Spacecraft Design<br />
The spacecraft are equipped with a five-layer square-shaped sunshade that permits the bulk of the optical<br />
system to be maintained at about 40 K by passive cooling. Some parts of the system on the beamcombiner<br />
are actively cooled to lower temperatures, notably the science detector at 7 K. These low temperatures<br />
minimize the self-radiation of the optical beam train which would add a noise signal to the science light.<br />
Spacecraft electronics and mechanical components are placed on the side of the spacecraft exposed to the<br />
Sun and are maintained near room temperature. Additional components include reaction wheels and small<br />
thrusters for formation flying. The spacecraft also have RF systems for communications both between<br />
themselves and the ground and RF sensors for coarse formation-flight control.<br />
The spacecraft carry enough propellant to allow the complex maneuvering that the observations require<br />
for a mission duration of a minimum of 5 years. While some mission configurations have employed a<br />
single launch, for this study we allowed launching in two heavy vehicles, giving sufficient mass and size<br />
margin to allow larger telescopes to be carried. When the collector spacecraft are released from the cruise<br />
vehicle, two major deployments will take place. These will include the deployment of the sunshade and<br />
the deployment of the telescope secondary mirror, the beam transfer optics, and the cylindrical shade. The<br />
latter systems are folded down for launch to reduce the volume of the system. The principal deployment<br />
of the combiner spacecraft is the sunshade.<br />
114
<strong>TPF</strong>-I F L I G H T B ASELINE D ESIGN<br />
Figure 5-16. Induced vibrations of secondary mirror caused by reaction wheel vibration.<br />
5.6.1 Thermal Modeling<br />
A limited amount of thermal modeling has been done on this design. A model originally developed by<br />
Ball Aerospace was used to test the thermal environment with the spacecraft in close proximity and in a<br />
separated linear formation. Also, the X-array configuration has also been briefly studied. Results showed<br />
that the sunshades of the collector telescope spacecraft produce passive cooling down to 24 K at the<br />
secondary mirror, with little difference between close and widely separated formations. These<br />
temperatures meet our targets for the beamtrain optics, but the primary mirror (40 K) was at the target<br />
temperature, meaning that there is no margin here. The results exclude the influence of any cold-side heat<br />
sources which will need to be maintained at low power. Some changes would need to be made to improve<br />
this. For example, increasing the inter-shade angle (currently 0.5º) and spacing (currently 75 mm) per<br />
shade would reduce the primary mirror temperature. On the beamcombiner spacecraft, colder sections of<br />
the optics (a small part of the beamcombiner and the science detector) will be actively cooled by the<br />
cryocooler, and this must be added to the model. Additional work needs to be done to produce a thermal<br />
model of the instrument payload both on the collectors and combiner, including the optical benches with<br />
their optics, actuators, and sensors.<br />
5.6.2 Structural Modeling<br />
A limited amount of structural modeling has been performed on the collector telescopes to look at the<br />
effect of vibration from the reaction wheels on two of the main mirrors and at the effect of thruster firings<br />
on the optical path. From an instrument perspective, the main findings are that the motion of the<br />
115
C HAPTER 5<br />
secondary mirror along the optical axis may exceed 1 nm over much of the spectrum, as shown by the<br />
uppermost trace in Figure 5-16. Below 28 Hz, the amplitude varies, but it peaks at more than 10 nm near<br />
17 Hz. Also between 60 and 80 Hz, amplitudes are large. They exceed the rate that can be corrected by<br />
the fringe tracker, and they are in the section of the beamtrain that is not monitored by laser metrology,<br />
which stops near the FOR mirror. An error budget for the beamtrain has not been developed, but it is<br />
likely to be significantly less than 1 nm for frequencies greater than a few hertz. However, on the positive<br />
side, the vibration amplitudes are sufficiently small that it is possible that vibration mitigation efforts<br />
would reduce them sufficiently. Such mitigations might be (for example) improved isolation of reaction<br />
wheels, or no reaction wheels, and spacecraft controlled by proportional thrusters or another low vibration<br />
system. In the worst case, a laser metrology system could be added to the telescopes to measure much of<br />
the unmonitored path. Primary-mirror vibrations were typically an order of magnitude smaller, so they are<br />
much less likely to cause concern. Additional work to look at the major bending modes of the primary is<br />
also desirable.<br />
5.7 Mission Description<br />
The current concept of the <strong>TPF</strong>-I mission begins with the launch of a single heavy-class launch vehicle<br />
from Kennedy Space Center. The complete observatory, traveling as one integrated assembly, is flown to<br />
the Sun–Earth L2 point. At the L2 point the observatory is inserted into a halo orbit. L2 was chosen over<br />
an Earth drift-away orbit like that used by the Spitzer mission because L2 offers simpler<br />
telecommunications geometry, a lower insertion energy requirement, and the option to launch groundbased<br />
spare spacecraft to the orbit after the deployment of the original formation.<br />
Figure 5-17 depicts a concept for the cruise stage. The cruise stage is used to transport the formation as<br />
packaged for launch from Earth to L2. The cruise stage also protects the optics from some potential<br />
contamination sources during launch. The stage includes a separate propulsion system, solar panels, and a<br />
mechanical structure. The electronics on the combiner spacecraft are used to control the cruise stage. On<br />
Cruise Stage Enclosure<br />
Section separates to<br />
expose Collector #2 for<br />
deployment<br />
Combiner<br />
Spacecraft<br />
Collector Spacecraft (4)<br />
Aft Prop Module /<br />
Collector Enclosure<br />
Section 1 separates to<br />
expose Collector #1 for<br />
deployment<br />
Cruise Stage Position and<br />
Attitude maintained by<br />
Combiner S/C using<br />
Cruise Stage Forward<br />
RCS<br />
Cruise Stage<br />
Collector #1 Separates<br />
from S/C aft attach<br />
fitting, deploys with<br />
gentle spring push off<br />
Cruise Stage sustains launch<br />
loads and provides<br />
contamination protection for<br />
optics during launch and<br />
cruise phases<br />
Figure 5-17. Cruise Stage (RCS is Reaction Control System).<br />
116
<strong>TPF</strong>-I F L I G H T B ASELINE D ESIGN<br />
the way to L2, the cruise stage performs a slow “barbecue” roll to maintain a benign thermal environment<br />
for the spacecraft within its shell. After arrival at L2, the cruise stage is used to deploy the individual<br />
spacecraft of the observatory one at a time. Ground operators verify successful deployment of each<br />
spacecraft before deploying subsequent spacecraft. After all the spacecraft are deployed, the formation is<br />
formed, and calibration begins. Following initial calibrations, the observatory is commissioned, and the<br />
prime mission begins.<br />
Table 1-2 has a summary of the properties of the current <strong>TPF</strong>-I observatory concept. The prime mission<br />
lasts 5 years with approximately 3 years budgeted for star-system surveys and 2 years budgeted for<br />
detailed, follow-up studies of targets found by the surveys. Enough expendable resources are carried to<br />
permit extending the mission another 5 years if consumption of these resources is as predicted and the<br />
observatory remains healthy.<br />
Observations consist of aligning the observatory’s viewing axis to a target star, adjusting the formation<br />
baseline length to an optimum value (tuning), and then rotating about that axis for multiple hours until a<br />
sufficient signal-to-noise ratio (SNR) is attained. Depending on the length of the observation, data are<br />
either downlinked before slewing to the next target system or recorded and played back after completing<br />
the observation of a multiple-target set. It is envisioned that the observatory will be capable of<br />
completing slews and observations of multiple targets autonomously. However, it is not certain that this<br />
capability will be used since the frequency of calibrations requiring ground interaction has not been<br />
analyzed yet.<br />
Geometrical thermal constraints will limit the target set to stars within ~± 45° of the ecliptic. This band<br />
of stars will be observed multiple times as the Earth/observatory system orbits the Sun. The target set<br />
includes many of the stars to be observed by the <strong>TPF</strong> Coronagraph.<br />
5.8 Performance of Flight Baseline Design<br />
5.8.1 Inner and Outer Working Angles<br />
Figure 5-18 shows how the rms signal from a planet of unit flux varies with position relative to the star.<br />
The rms is taken over the full range of array-rotation angles. These maps of the ‘rms modulation<br />
efficiency’ show how the peak of the PSF varies with position. The example on the left is for the smallest<br />
array size of 120 × 20 m, at a wavelength of 10 μm. The response for the largest array size of 612 × 102<br />
m is shown on the right. The overall response is a product of the primary beam taper and the effect of the<br />
interferometric fringes.<br />
The outer working angle (OWA) is taken to be the half-power point of the primary beam taper. With a<br />
collector diameter of 3.8 m, this is 280 mas, although the value is increased if we consider the nonuniform<br />
response of the single-mode fiber over the input aperture. The OWA is independent of the array<br />
size. At longer wavelengths the taper is reduced.<br />
117
C HAPTER 5<br />
a)<br />
c)<br />
b)<br />
d)<br />
IWA = 43 mas OWA = 280 mas<br />
IWA = 9.6 mas OWA = 280 mas<br />
Figure 5-18. Response to planet emission at 10 μm for the stretched X-array. (a) Sky response for the<br />
minimum array size of 120 × 20 m at λ = 10 μm. (b) Section through the sky response for minimum<br />
array size. The IWA is 43 mas. The OWA is 280 mas. (c) Sky response for maximum array size (612<br />
× 102 m). (d) Section showing IWA of 9.6 mas.<br />
At the center of each response is the dark hole that represents the effect of the central null. The Inner<br />
Working Angle is defined to be the offset angle from the star at which the signal response (blue solid line)<br />
first crosses the asymptotic response (green dashed line), for a wavelength of 10 μm. This IWA scales<br />
approximately as B null -1 . At the minimum array size of 120 × 20 m, the IWA = 43 mas; at the maximum<br />
array size of 612 × 102 m, the IWA = 9.6 mas.<br />
Figure 5-18 shows the response to planet signal photons; this is not the same as the sensitivity to planet<br />
photons which depends on the signal-to-noise ratio. The noise sources described in Section 4.2 result in a<br />
statistically uniform distribution in the rms noise over the map. The noise level integrates down with time,<br />
so that the effective contrast that can be achieved scales with T int 1/2 . This is different from the<br />
coronagraph, which has a fixed contrast floor introduced by the instrument that ultimately limits the<br />
performance. For the interferometer, the powerful combination of fast phase chopping and spectral-fitting<br />
(described in Section 4.8) should ensure that any residual noise will be random in nature.<br />
118
<strong>TPF</strong>-I F L I G H T B ASELINE D ESIGN<br />
30.00<br />
25.00<br />
Dominated by<br />
Local Zodi<br />
All (1014)<br />
C HAPTER 5<br />
planets found. Figure 5-22 compares the planets surveyed by <strong>TPF</strong>-I and <strong>TPF</strong>-C, as well as the masssensitivity<br />
of the Space Interferometry Mission (SIM-PlanetQuest). The coronagraph approach of<br />
maximizing the number of planets found is currently being applied to the interferometer so that we can<br />
better compare the relative performance of the two missions.<br />
Table 5-2. Parameters Assumed for the Prediction of the Number of Stars Surveyed<br />
Parameter<br />
Constraint<br />
Mission time available for survey<br />
2 yr<br />
Fraction of survey time spent integrating 50%<br />
Number of visits per star for 90% completeness 3<br />
Solar shading constraint<br />
±45 deg anti-Sun<br />
30<br />
25<br />
All (1014)<br />
1 Earth mass (241)<br />
0.5 Earth mass (156)<br />
0.1 Earth mass (57)<br />
Distance / pc<br />
20<br />
15<br />
10<br />
5<br />
0<br />
0 50 100 150 200<br />
Projected radius of Inner Habitable Zone / mas<br />
Figure 5-20. Number of systems surveyed in 2-year mission time as a function of the mass<br />
sensitivity. 57 stars are covered with a deep survey down to 0.1 Earth mass limit (yellow). 156<br />
targets are covered with medium depth survey to 0.5 Earth mass limit (yellow + green). 241 targets<br />
are covered with shallow survey to 1 Earth mass limit (yellow + green + blue). These are mutually<br />
exclusive scenarios.<br />
120
<strong>TPF</strong>-I F L I G H T B ASELINE D ESIGN<br />
30<br />
25<br />
All (1014)<br />
2 Earth mass (231)<br />
1 Earth mass (100)<br />
0.5 Earth mass (44)<br />
0.25 Earth mass (22)<br />
0.1 Earth mass (9)<br />
Distance / pc<br />
20<br />
15<br />
10<br />
5<br />
0<br />
0 50 100 150 200<br />
Projected radius of Inner Habitable Zone / mas<br />
Figure 5-21. Planet mass sensitivity for a single array rotation of 50,000 s. 9 nearby stars can be<br />
surveyed for planets in the Habitable Zone with masses as low as 0.1 Earth mass. The mass<br />
sensitivity improves as T 0.75 , assuming constant density of the planet.<br />
A candidate selection will be followed up with further observations to determine the orbit and to rule out<br />
the possibilities of background sources and lumps in the exozodiacal emission. This phase of the planetfinding<br />
process is less well studied than the initial detection, but it should be greatly eased by the<br />
excellent angular resolution of the stretched X-array (see Section 5.8). The spectroscopic characterization<br />
phase is the subject of the next section.<br />
5.8.3 Spectroscopy<br />
Following detection and orbit determination, the goal is to obtain a spectrum of candidate planets. The<br />
outputs of the single-mode spatial filters are dispersed into ~100 spectral channels on a detector array.<br />
The array always observes at the full spectral resolution because the response on the sky is wavelengthdependent,<br />
and lower spectral resolution will restrict the useful field of view. The channels are co-added<br />
in the post-processing to maximize the SNR for detection and orbit determination, but this data also<br />
provides a first look at the spectrum, albeit with low SNR.<br />
121
C HAPTER 5<br />
30<br />
25<br />
5 M earth<br />
3 M earth<br />
All (1014)<br />
<strong>TPF</strong>-C [75 - 100%] (26)<br />
<strong>TPF</strong>-C [50 - 75%] (24)<br />
<strong>TPF</strong>-C [25 - 50%] (27)<br />
<strong>TPF</strong>-C [0 - 25%] (17)<br />
<strong>TPF</strong>-I [90%] (240)<br />
Series7<br />
10 M earth<br />
SIM (100 stars)<br />
Distance / pc<br />
20<br />
15<br />
2 M earth<br />
10<br />
Sun @ 10 pc<br />
5<br />
1 M earth<br />
0<br />
301 605<br />
0 50 100 150 200<br />
Projected radius of Inner Habitable Zone / mas<br />
Figure 5-22. Comparison of <strong>TPF</strong>-I, <strong>TPF</strong>-C, and SIM Missions. The colored circles represent those stars<br />
for which an Earth-sized planet could be detected in the Habitable Zone by the <strong>TPF</strong>-C mission. The color<br />
indicates the completeness of the measurement, as indicated in the legend. For example, the yellow<br />
symbols show stars for which there is a probability of between 50 and 75% that a given Earth-sized<br />
planet in the habitable zone is detected. There are 24 such stars. The completeness diminishes with<br />
distance and proximity of the habitable zone to the star. The circles with a heavy outline denote the 240<br />
stars that can be surveyed for Earth-sized planets in the habitable zone with 90% completeness by the<br />
<strong>TPF</strong>-I mission. The blue contours represent the planet mass sensitivity of the SIM mission for an Earthequivalent<br />
orbit. The astrometric signature is proportional to the mass of the planet and the projected orbit<br />
radius, and inversely proportional to the mass of the parent star. For a star lying on the 3-Earth-mass<br />
contour, there is a 50% probability that a given 3-Earth-mass planet will be detected.<br />
The spectroscopy observations are made in exactly the same manner as for detection and orbit<br />
determination: that is, the array is rotated continuously about the line of sight to the star and<br />
measurements are made “on-the-fly.” Many rotations may be needed to accumulate the necessary<br />
integration time. Efficiency (integration time/mission time) is assumed to be 75%.<br />
Figure 5-23 shows how the SNR in a 0.5-μm wide channel varies with wavelength, for an integration time<br />
of 29 days on an Earth-sized planet at 15 pc. Much of the variation in SNR (Fig. 5-23b) can be attributed<br />
to the variation in signal photon rate from the planet (modeled as a 265-K black body as shown in Fig. 5-<br />
23a). The SNR is reduced at short wavelengths by the increase in stellar leakage, since the width of the<br />
null is proportional to the wavelength. At long wavelengths the SNR is depressed by the increase in<br />
122
a) b)<br />
Signal / (photons / s)<br />
0.16<br />
0.14<br />
0.12<br />
0.10<br />
Planet BB<br />
0.08<br />
'Signal + 1 sigma<br />
0.06<br />
'Signal - 1 sigma<br />
0.04<br />
0.02<br />
0.00<br />
6 8 10 12 14 16 18 20<br />
Wavelength / μm<br />
<strong>TPF</strong>-I F L I G H T B ASELINE D ESIGN<br />
SNR<br />
18<br />
16<br />
14<br />
12<br />
10<br />
8<br />
6<br />
4<br />
2<br />
0<br />
6 8 10 12 14 16 18 20<br />
Wavelength / μm<br />
Figure 5-23. (a) Chopped planet signal rms vs. wavelength. The spectrum is divided into channels of<br />
width 0.5-μm. The planet is Earth-sized, at a distance of 15 pc, and with a 265-K black body spectrum.<br />
The magenta lines indicate the ±1 σ noise level after integrating for 29 days with the stretched X-array<br />
configuration. This time was chosen to give SNR = 10 in the 9.5–10 μm channel, corresponding to the<br />
ozone line, as shown in (b).<br />
thermal noise emitted by the instrument, and, to a lesser extent, the local zodiacal emission. The peak<br />
sensitivity for spectroscopy is in the 12–15 μm region. The water-vapor features shortward of 8 μm will<br />
be very challenging to detect, given the low SNR, and will require integration times of many months. For<br />
this reason, the water-vapor features beyond 15 μm are more attractive.<br />
Figure 5-24 is a histogram showing the integration times needed to achieve an SNR of 10 in the 9.5–<br />
10 μm ozone channel, for the nearest 200 candidate stars.<br />
30<br />
# candidate targets<br />
25<br />
20<br />
15<br />
10<br />
5<br />
0<br />
0<br />
0.5<br />
1<br />
2<br />
4<br />
8<br />
12<br />
16<br />
20<br />
25<br />
30<br />
35<br />
40<br />
50<br />
60<br />
70<br />
80<br />
90<br />
Integration time / days<br />
100<br />
Figure 5-24. Histogram of spectroscopy integration times for 200 best candidate targets for<br />
SNR = 10 in the 9.5–10 μm channel.<br />
123
C HAPTER 5<br />
5.8.4 Angular Resolution and Imaging<br />
The imaging properties of nulling arrays are discussed in Section 4.9. Angular resolution—essentially the<br />
width of the main peak in the point spread function—is distinct from the IWA discussed in Section 5.8. A<br />
key feature of the stretched X-array is its excellent angular resolution, resulting from the long imaging<br />
baselines. Figure 5-25 compares synthesized dirty maps for the regular X-array 2:1 and the stretched X-<br />
array 6:1. The IWA is the same in each case, but the angular resolution is improved by a factor of 3. The<br />
angular resolution scales linearly with wavelength and is inversely proportional to the array size, as<br />
illustrated in Table 5-3.<br />
High angular resolution is highly desirable for (1) separating the contributions of multiple planets; (2)<br />
rapid and unambiguous orbit determinations; and (3) discrimination against lumps in the exozodiacal<br />
disk.<br />
For previous arrays with relatively poor angular resolution, image deconvolution was considered to be a<br />
major issue, since there can be substantial overlap between the PSFs of different sources. Sidelobes and<br />
satellite peaks can combine to produce false peaks or mutually cancel and prevent detection. The greatly<br />
enhanced angular resolution of the stretched X-array (Fig. 5-25b) minimizes these overlaps, and it should<br />
go a long way to retiring these issues.<br />
Figure 5-25. (a) Dirty map of two planets (indicated by the × symbols), synthesized from multichannel<br />
observations of an X-array 2:1 array configuration (70 × 35 m); (b) Equivalent dirty map<br />
for the stretched X-array 6:1 configuration (210 × 35 m).<br />
124
<strong>TPF</strong>-I F L I G H T B ASELINE D ESIGN<br />
Figure 5-26. Examples of u-v coverage and dirty beam profiles for the stretched X-array in<br />
snapshort and full configuration. Snapshot: (left column) 10-μm wavelength, 5 h on 3 targets<br />
with calibrator (1.7 h per target), 180-degree array rotation over a baseline range from 20 to 60<br />
m on the short side of the rectangle. Beam FWHM = 3.9 × 3.4 mas and highest sidelobe is 20%.<br />
Full: (right column) 6-μm wavelength, 12 h on 1 target with calibrator, 360-degree rotation<br />
over full baseline range (20 to 100 m on short side of rectangle). Beam FWHM = 1.5 × 1.2 mas<br />
and highest sidelobe is 10%.<br />
125
C HAPTER 5<br />
Table 5-3. Angular Resolution (FWHM of PSF) of the Stretched X-Array<br />
Array Size<br />
Wavelength<br />
6 μm 10 μm 18 μm<br />
120 × 20 m 4.9 mas 8.2 mas 14.8 mas<br />
612 × 102 m 1.0 mas 1.6 mas 2.9 mas<br />
Here we have assumed that the 6:1 aspect ratio of the array is held fixed, which simplifies the input optics<br />
on the combiner. One design option would be to allow for a variable aspect ratio. The nulling baseline<br />
length would be set according to the angle subtended by the inner habitable zone, and the imaging<br />
baseline would be made as larger as possible. Fore general astrophysics without nulling, the imaging<br />
properties of the stretched X-array are depicted in Fig. 5-26.<br />
5.8.5 Optimized <strong>Program</strong> Completeness<br />
Each star on the <strong>TPF</strong>-I target list has a habitable zone, which scales by luminosity and is defined as the<br />
region around a star in which liquid water could exist. We model the habitable zone by populating this<br />
region with 1,000 pseudo-planets. The pseudo-planets have random inclination, eccentricity over the<br />
range [0, 0.1], and a semi-major axis in the range of 0.75 L ≤ x≤ 1.8 L . The planets are Earth-like in<br />
size and albedo. <strong>Program</strong> completeness is then defined to be the fraction of potentially observable planets<br />
that are detected over a mission. Our algorithm selects the most productive of the <strong>TPF</strong> candidate stars to<br />
observe in each week of the mission. It accounts for multiple visits, solar constraints, variable baselines,<br />
and planet orbital motion, removing many of the assumptions that were necessary in previous analyses.<br />
The procedure for this analysis is shown in Fig. 5-27.<br />
The changes to previous methods of computing completeness include temperature-dependence of the<br />
planet across the habitable zone, a more realistic exozodiacal model, a tapered, wavelength-dependent<br />
representation of the IWA, and the optimization of visit timing. We perform this optimization by<br />
evaluating stars on the completeness per time that is provided by a given observation. We calculate the<br />
curve of completeness vs. integration time fore each star determining the best array size at each point.<br />
Several example curves are shown in Fig. 5-28. The curves start out flat due to overhead and a minimum<br />
integration time needed to observe any pseudo planets. The curves rise and then flatten out at different<br />
levels depending on the stellar type and distance to the star. (the IWA limits the possible planet<br />
observations for stars that are farther.) We define an instantaneous efficiency (change in completeness<br />
per hour, i.e., the red dot indicating the slope of the completeness curve in Fig. 5-28) for all available<br />
stars. The observation time per star is then defined as the time needed to observe the star up to the slope<br />
cut off point (t 1 , t 2 or t 3 in Fig.5-28). The stars are then evaluated on net efficiency (i.e., the green dashed<br />
lines indicating overall completeness per observation time). Those stars with the largest net efficiency are<br />
then selected for a visit.<br />
126
<strong>TPF</strong>-I F L I G H T B ASELINE D ESIGN<br />
eccentricity<br />
phase<br />
inclination<br />
argument<br />
Start<br />
next week<br />
repeat up to 3 years<br />
Determine if<br />
star is<br />
available for<br />
observation<br />
Eliminate<br />
planets that are<br />
observed with<br />
visit<br />
Evolve<br />
orrery of<br />
planets<br />
Determine stellar<br />
visits and observation<br />
time based on<br />
efficiency threshold<br />
optimization<br />
Compute<br />
SNR for<br />
every planet<br />
for every BL<br />
for every star<br />
Compute<br />
completeness<br />
for every BL<br />
for every star<br />
planets<br />
stars in list<br />
1=available<br />
0=observed<br />
End<br />
<strong>Program</strong><br />
Completeness<br />
Figure 5-27. Flow diagram <strong>TPF</strong>-I completeness optimization. Pink boxes indicate inputs for the<br />
1000 pseudo-planets. Blue boxes indicate steps in the program completeness computation. Green<br />
boxes indicate outputs. We compute completeness for every baseline (BL) for every star as a<br />
function of integration time.<br />
Completeness<br />
Star #1<br />
Star #2<br />
Star #3<br />
Time<br />
t 1 t 3 t 2<br />
Figure 5-28. Each stellar curve is composed of the portion between time = 0 and the red dot on<br />
the curve. The red dot is located at a common slope point for all stellar curves. The green<br />
dashed lines show the net efficiency of a given stellar observation. The stars with the best<br />
completeness per time (t 1 , t 2 or t 3 ) are then selected for a visit.<br />
127
C HAPTER 5<br />
The optimization works by solving the following question: Given a set of completeness curves vs. time<br />
for the available stars in the current 1-week period, what is the optimum set of integration times that<br />
maximizes the number of planets found<br />
Solve by applying two rules: 1) For stars that are observed, we must be operating at a point on each<br />
completeness curve that has the same slope. Otherwise we can increase efficiency by transferring<br />
integration time from a target with shallow slope to one with steeper slope (i.e., ΔC Δ t = const .<br />
2) The observed stars are those with the highest net efficiencies. Otherwise we could increase overall<br />
δ Ct is maximized).<br />
completeness by swapping in a star with higher net efficiency (i.e., ( )<br />
We then repeat for different values of ΔC Δ t to find the most productive set of integration times.<br />
The baseline mission concept includes a 2-year mission duration with an X-array (aspect ratio of 6:1)<br />
architecture. In this scenario, we assume a 70% integration time efficiency and a 4.3 hr slew time per<br />
target observation. With this baseline, we are able to obtain a total accumulated completeness of 192.0<br />
habitable zones searched with 385 observations over 384 different targets. This is equivalent to stating<br />
that we would find 192 planets if each target had one Earth-like planet and 19 planets if one tenth of the<br />
targets had such a planet. Unlike previous simulations, all but one target (Hipp# 80337) are visited only<br />
Habitable Zone completeness for Earth-sized planet after 2 year survey<br />
30<br />
25<br />
All (1014)<br />
0.8 - 1.0 (48)<br />
0.6 - 0.8 (54)<br />
0.4 - 0.6 (113)<br />
0.2 - 0.4 (169)<br />
Distance / pc<br />
20<br />
15<br />
10<br />
5<br />
0<br />
0 50 100 150 200 250 300<br />
Angular radius of Mid-Habitable Zone / mas<br />
Figure 5-29. Completeness for visited stars.<br />
128
<strong>TPF</strong>-I F L I G H T B ASELINE D ESIGN<br />
once. Additionally, the completeness per star varies in the new simulation. In general, the closer stars are<br />
more complete than those that are further away. The completeness per star as a function of angular radius<br />
to the mid-HZ and distance to the star is shown in Fig. 5-29.<br />
The completeness calculations for this simulation are lower than previous estimations because there is<br />
now more fidelity in the current model. We compute planet flux as a function of HZ distance in the new<br />
simulations. Because there is a sharp fall-off in the mid-IR flux in the outer HZ, fewer outer HZ planets<br />
are observable. Furthermore, if we map completeness across the HZ, there is a marked fall-off of<br />
completeness as a function of pseudo-planet distance. Future work includes a study of the effect of forced<br />
revisits on completeness.<br />
5.9 References<br />
Lay, O. P., “Imaging properties of rotating nulling interferometers,” Appl. Opt. 44, 5859–5871 (2005).<br />
Martin, S., “The flight instrument design for the Terrestrial Planet Finder Interferometer,” Techniques and<br />
Instrumentation for Detection of <strong>Exoplanet</strong>s II, Proc. SPIE 5905, edited by D. R. Coulter, 21–35<br />
(2005).<br />
129
T E C H N O L O G Y R OADMAP FOR <strong>TPF</strong>-I<br />
6 Technology Roadmap for <strong>TPF</strong>-I<br />
The Technology Plan for the Terrestrial Planet Finder Interferometer (Lawson and Dooley 2005)<br />
contains a detailed description of the areas of technical work that need to be developed for <strong>TPF</strong>-I prior to<br />
entering Phase A of its mission life cycle. The document describes the requirements and error budgets for<br />
the mission relevant to starlight suppression, formation flying, and cryogenic technology. Also included<br />
are testbed descriptions, and for each testbed, a schedule of milestones and technical gates.<br />
The technology plan emphasizes the relationship between error budgets, theoretical predictions, and<br />
experimental results. The approach to technology development for <strong>TPF</strong>-I includes the notion that as our<br />
understanding of the instrument matures and our ability to model the experiments improves, the<br />
corresponding error budgets need be revised and updated, and the performance targets for each testbed<br />
need to be reassessed. Our understanding of instability noise and methods of its mitigation (described in<br />
Section 4.8) has evolved greatly since 2005. The technology plan is therefore overdue for revision, as it<br />
no longer reflects our current understanding of the mission requirements.<br />
Also worth noting is that the scope of work on <strong>TPF</strong>-I has been greatly reduced since 2005 because of<br />
changes in the <strong>NASA</strong> budget. The ongoing work is focused on starlight suppression and formation flying<br />
and is described in the following sections.<br />
6.1 Technology Gates<br />
The technology goals for <strong>TPF</strong>-I in Pre Phase A are listed here. Within the plan the milestones are listed<br />
that lead towards major gates in technology development. These gates are shown below. It is worth<br />
emphasizing that our current understanding of mitigating instability noise should enable us to relax the<br />
null depth requirement by a factor of ~10 (Lay 2006) over the targets listed here. As such, the technology<br />
gates for starlight suppression now seem overly strict, but they are included here from the 2005 plan for<br />
completeness. A high-level overview of the flight requirements and testbed requirements, as they were<br />
described in 2005, is given in Table 6-1.<br />
6.1.1 Optics and Starlight Suppression Gates<br />
Starlight Suppression (Depth and Bandwidth at Temperature): Using the Achromatic Nulling<br />
Testbed, demonstrate that infrared light over a spectral bandwidth of ≥ 25% can be suppressed by ≥ 10 6 at<br />
≤ 40 K. Accompany these results with an optical model of the Achromatic Nulling Testbed, validated by<br />
test data, to be included in the model of the flight-instrument concept. This demonstrates the approach to<br />
the broad-band starlight suppression needed to characterize terrestrial planets for habitability at a flightlike<br />
temperature. Gate TRL 5.<br />
131
C HAPTER 6<br />
Table 6-1. Comparison of 2005 Flight Requirements with Pre-Phase A Nulling Testbed<br />
Requirements<br />
Technology Specifications Performance to Date Performance<br />
target prior to<br />
Phase A<br />
Flight<br />
Performance<br />
(Preliminary)<br />
Starlight Suppression<br />
Formation Flying<br />
Average null depth<br />
0.5 × 10 -5 (25 % BW)<br />
5.0 × 10 -7 (laser)<br />
Less than<br />
1 × 10 -6 *<br />
Amplitude control 0.2 % 0.12% 0.13<br />
Less than<br />
7.5 × 10 -7 *<br />
Phase control 2.0 nm 2.0 nm 1.5 nm<br />
Stability timescale Not tested 5,000 s > 50,000 s<br />
Bandwidth 8.3–10.7 μm (25%) 8.3–10.7 μm (25%) 7–17 μm<br />
Number of s/c 2 robots 3 robots 5 s/c<br />
Relative control<br />
7-cm range, 80-arcmin<br />
bearing<br />
5 cm range, 60<br />
arcmin bearing<br />
* The new stretched X-array design relaxes both these null depth requirements to 1 × 10 -5 .<br />
2-cm range, 20-<br />
arcsec bearing<br />
Planet Extraction: Using the Planet Detection Testbed (PDT), demonstrate extraction of a simulated<br />
(laser) planet signal at a star/planet contrast ratio of ≥ 10 6 for a rotation of the flight formation lasting ≥<br />
5000 s. Accompany these results with a control system model of the Planet Detection Testbed, validated<br />
by test data, to be included in the control system model of the flight-instrument concept. Success shows<br />
flight-like planet sensing at representative stability levels within a factor of 20 of the contrast at 1/10 the<br />
flight observation duration. Gate TRL 5.<br />
Dispersion Control at Temperature: Using the Adaptive Nuller, demonstrate that optical beam<br />
amplitude can be controlled with a precision of ≤ 0.2% and phase with a precision of ≤ 5 nm over a<br />
spectral bandwidth of > 3 μm in the mid IR for two polarizations at ≤ 40 K. Accompany these results<br />
with a model of the Adaptive Nuller, validated by test data, to be included in the model of the flightinstrument<br />
concept. This demonstrates the approach for compensating for optical imperfections that<br />
create instrument noise that can mask planet signals at the temperature required for flight operations.<br />
Gate TRL 5.<br />
6.1.2 Formation Flying Gates<br />
Formation Flying (5-Spacecraft Simulation With Fault Recovery): Using the Formation Algorithms<br />
& Simulation Testbed, simulate the safing and recovery of a five-spacecraft formation subjected to a set<br />
of typical spacecraft faults that could lead to mission failures unique to formation flying such as<br />
collisions, sensor faults, communication drop-outs, or failed thrusters in on or off states. Simulations can<br />
be limited to single-fault scenarios. This demonstrates the robustness of formation control architecture, as<br />
well as fault-tolerance of the on-board formation guidance, estimation, and control algorithms to protect<br />
against faults that have a reasonable probability of occurring sometime during the <strong>TPF</strong>-I prime mission<br />
and that are unique to <strong>TPF</strong>-I’s unprecedented use of close formation flying. Gate TRL 5.<br />
132
T E C H N O L O G Y R OADMAP FOR <strong>TPF</strong>-I<br />
Formation Flying (Multiple Robot Demonstration With Fault Recovery): Using the Formation<br />
Control Testbed, demonstrate that a formation of multiple robots can be safed following the injections of<br />
a set of typical spacecraft faults that have a reasonable probability of occurring during flight.<br />
Demonstrations can be limited to single-fault scenarios. This validates the software simulation of fault<br />
recovery for formation flight. Gate TRL 5.<br />
6.1.3 Cryogenic Technology Gate<br />
Cryocooler Development: With the Advanced Cryocooler Technology Development <strong>Program</strong>,<br />
demonstrate that the development model coolers meet or exceed their performance requirements to<br />
provide ~30 mW of cooling at 6 K and ~150 mW at 18 K. This demonstrates the approach to cooling the<br />
science detector to a temperature low enough to reveal the weak planet signals. Gate TRL 5. Completed<br />
Q2 2005.<br />
6.1.4 Integrated Modeling Gate<br />
Observatory Simulation: Demonstrate a simulation of the flight observatory concept that models the<br />
observatory subjected to dynamic disturbances (e.g., from reaction wheels). Validate this model with<br />
experimental results from at least the Planet Detection Testbed at discrete wavelengths. Use this<br />
simulation to show that the depth and stability of the starlight null can be controlled over the entire<br />
waveband to within an order of magnitude of the limits required in flight to detect Earth-like planets,<br />
characterize their properties, and assess their habitability. Gate TRL 5.<br />
6.2 Nulling Interferometry<br />
<strong>TPF</strong>-I is in Pre Phase A of its project life cycle, and its technology development is therefore directed at<br />
demonstrating the feasibility of the techniques that will be used. For starlight suppression it was thought<br />
impractical to demonstrate all that needed to be demonstrated on a single testbed. The effort has therefore<br />
been divided into tasks that can be addressed independently:<br />
1. Deep broad-band two-beam nulling;<br />
2. Planet detection with a four-beam nulling interferometer;<br />
3. Adaptive correction of amplitude and phase; and<br />
4. Suppression of higher-order wavefront modes using single-mode mid-infrared fiber optics.<br />
The requirements for the nulling testbeds from the 2005 technology plan are summarized in Table 6-2.<br />
6.2.1 State of the Art in Nulling Interferometry<br />
Progress in nulling interferometry is summarized in Figure 6-1. The plot shows rejection ratio as a<br />
function of bandwidth, for laboratory experiments that have been undertaken since 1998. On the far lefthand<br />
side of the plot are shown the results obtained using lasers at visible, near-infrared, and mid-infrared<br />
wavelengths. Experiments with bandwidths as large as 28% are shown. Results from ground-based<br />
observations of astronomical targets are not included; the rejection ratio obtained from experiments at<br />
telescopes have been less than 1000:1, dominated by atmospheric fluctuations. Of principal concern to<br />
133
C HAPTER 6<br />
Figure 6-1. The State of the Art of Nulling Interferometry: Laboratory results showing null depth as a<br />
function of bandwidth for experiments at visible, infrared, and mid-infrared wavelengths. Results that are<br />
plotted with a zero bandwidth are laser measurements. Almost all results are limited to a singlepolarization<br />
input. All but one of the results are from two-beam nulling interferometers. The result by<br />
Martin et al. (2005) is from the four-beam Planet Detection Testbed, described later in this Section. The<br />
result by Gappinger (2006) is an unpublished result from the Achromatic Nulling Testbed. The result by<br />
Peters (2007) is a preliminary and unpublished result from the Adaptive Nuller. The literature references,<br />
where available, are listed at the end of this chapter.<br />
<strong>TPF</strong>-I are the experiments that have been conducted at mid-infrared wavelengths, which are indicated by<br />
the red circles in the plot.<br />
From the results to date, we can draw the following conclusions.<br />
1. Experiments have shown that achromatic effects (predominantly pathlength variations) can be<br />
controlled in the lab at a level that allows rejection ratios better than 1,000,000:1 to be achieved<br />
repeatedly. This level of performance exceeds the requirements for <strong>TPF</strong>-I. Narrow-bandwidth<br />
laser nulls have been attained with mid-infrared rejection ratios of 2,000,000:1 and at visible<br />
wavelengths of 10,000,000:1.<br />
134
T E C H N O L O G Y R OADMAP FOR <strong>TPF</strong>-I<br />
2. The best broad-band mid-infrared results were obtained in January 2007 with the Adaptive Nuller<br />
tesbed, noted in Fig. 6-1 as “Peters 2007.” A null depth of 50,000:1 was obtained with a 32%<br />
bandwidth. This rejection ratio is only a factor of 2 from the 100,000:1 required for the stretched<br />
X-array. Broad-band nulling results to date are therefore extremely promising. Also of particular<br />
note is the result by Samuele et al. (2007) showing nulling at almost 10 -6 with a bandwidth of<br />
15%. This result, at a wavelength 20 times shorter than mid-infrared wavelengths, suggests there<br />
is no fundamental reason why similar null depths cannot be achieved in the mid-infrared.<br />
The best broad-band mid-infrared null is arguably only a factor of two removed from Pre Phase A<br />
requirements for <strong>TPF</strong>-I, if one takes into account the relaxation of requirements due to advances in our<br />
understanding of instability noise. The literature references for the points noted in Fig. 6-1 are listed at<br />
the end of this Chapter. Descriptions of the <strong>TPF</strong>-I starlight suppression testbeds are given in the<br />
following pages.<br />
Table 6-2 Comparison of 2005 Flight Requirements with Pre-Phase A Nulling Testbed<br />
Requirements<br />
Parameter<br />
Flight<br />
Performance<br />
Achromatic<br />
Nuller<br />
Planet Detection<br />
Testbed<br />
Adaptive<br />
Nuller<br />
Null depth 7.5 × 10 -7 1 × 10 -6 1 × 10 -6 1 × 10 -5<br />
Amplitude control 0.13% Derived 0.12% 0.2% (static)<br />
Phase control 1.5 nm Derived 2 nm 5 nm (static)<br />
Stability timescale 50,000 s + 100 s 5,000 s 6 h<br />
Bandwidth 7–17 μm 25% λ = 10.6 μm 30 %<br />
6.2.2 Achromatic Nulling Testbed (ANT)<br />
Perhaps the most fundamental technical demonstration for <strong>TPF</strong>-I is to show that deep broad-band nulling<br />
is possible. For the ANT, a bandwidth of 25% was chosen at a central wavelength of 10 μm and a target<br />
null depth of 1 × 10 -6 . The nuller being used is a compact two-beam Mach-Zehnder interferometer using<br />
opposite field flips in each arm with an arrangement of periscope mirrors. The interferometer is pictured<br />
in Fig. 6-2. The ANT has also implemented a dispersive plate nuller and a through-focus nuller. The best<br />
results to date have come from the periscope nuller, yielding broad-band nulls of 15,000:1 in unpolarized<br />
light. Our efforts to characterize the limitations of the periscope nuller have shown that the null is not<br />
dispersion limited; dispersion and chromatic effects are very well compensated within the nuller, and<br />
decreasing the bandwidth of the light source from 25% to 10% does not improve the null. However, there<br />
is evidence that polarization-dependent amplitude and phase errors are present in the testbed. Tests using<br />
the same optics, 10-μm laser light, and mid-infrared polarizers have yielded null depths of 200,000:1. It is<br />
difficult to model and predict these effects, as the predictions require knowledge of the material properties<br />
of the beamsplitter coatings, which unfortunately remains proprietary. The laser nulling results suggest,<br />
however, that a factor of 10 improvement in broad-band nulling is possible in the near future. This work<br />
is now in progress.<br />
135
C HAPTER 6<br />
Figure 6-2. The Achromatic Nulling Testbed (ANT). The ANT includes three testbeds to explore<br />
technology for broad-band deep nulling. The goal of the testbed is to achieve mid-infrared null<br />
depths of 1000,000:1 using a bandwidth of 25 %, centered at a wavelength near 10 μm. The view of<br />
the ANT in the above photo shows the periscope assembly (on the left). Mid-infrared nulls of<br />
15,000:1 have been achieved in unpolarized light with a 25% bandwidth. Mid-infrared laser nulls of<br />
200,000:1 have been obtained using the exact same interferometer. The principal investigator (PI) of<br />
the ANT is Robert Gappinger, pictured here.<br />
6.2.3 Planet Detection Testbed (PDT)<br />
The leading candidate architectures for the <strong>TPF</strong> Interferometer (the X-array and the linear dual-chopped<br />
Bracewell) are both four-beam nullers that use interferometric chopping to detect planets in the presence<br />
of a strong mid-infrared background. The Planet Detection Testbed (PDT) was developed to demonstrate<br />
the feasibility of four-beam nulling, the required null stability, and the detection of faint planets using an<br />
approach similar to the ones contemplated for a flight-mission (Martin et al. 2006). A view of the PDT is<br />
shown in Fig. 6-3. The PDT includes numerous control loops that periodically degrade the null in the<br />
search of the best alignment for pathlength and tilt control of the four beams. The time-series of data from<br />
the PDT, plotted on a log-scale, show the signature of these modulations and yet the null degradations are<br />
so slight that deep nulling is maintained. As shown in Fig. 6-4, in 2005 the PDT demonstrated four-beam<br />
nulling with null depths of 250,000:1 and the detection of a simulated planet at a contrast level two<br />
million times fainter than its star.<br />
Upcoming milestones for the Planet Detection Testbed include a demonstration of nulling stable to 0.1 %<br />
and phase chopping.<br />
136
T E C H N O L O G Y R OADMAP FOR <strong>TPF</strong>-I<br />
Figure 6-3. The Planet Detection Testbed (PDT). The PDT is a four-input nulling interferometer that<br />
uses 10-μm laser light and servo loops that modulate the null depth to perform experiments related to<br />
instability noise, interferometric chopping, and planet detection. The testbed configuration shown here<br />
was used to obtain 200,000:1 laser nulls and detect a simulated planet with a contrast ratio of<br />
2000,000:1. The PI of the PDT is Stefan Martin, shown in the white lab coat.<br />
Figure 6-4. Four-beam nulling with the Planet Detection Testbed was achieved at a nul depth of 10 -5<br />
and demonstrated the ability to extract a planet signal two million times fainter than a simulated star.<br />
137
C HAPTER 6<br />
6.2.4 Adaptive Nuller Testbed (AdN)<br />
Deep broadband nulls require that the amplitude and phase of the electric field from each arm of the<br />
interferometer are very carefully matched over the full range of wavelengths and two polarization states.<br />
This becomes very challenging with large beamtrains — the tolerances on the surface figure and coatings<br />
of the many optical components is very tight. The Adaptive Nuller (Peters et al 2006) is a device inserted<br />
into each beamtrain that compensates the amplitude and phase errors independently for each spectral<br />
channel and polarization state. It effectively converts the broadband nulling challenge into a parallel set of<br />
narrow-band nulls, and enables robust deep nulling with mismatched optics and coatings. A deformable<br />
mirror is used to compensate amplitude and phase individually at each wavelength and polarization. The<br />
concept was first tested successfully at near-infrared wavelengths before moving to the mid-infrared<br />
system shown in Fig. 6-5. Testing is ongoing, but a null of 50,000:1 has already been demonstrated with<br />
mismatched optics over a bandwidth of 8–12 microns. Extending this to larger bandwidths should be<br />
simply a matter of adding more actuators to the deformable mirror.<br />
Figure 6-5. The Adaptive Nuller Testbed (AdN). The Adaptive Nuller has as its goal to demonstrate<br />
phase and intensity compensation of beams within a nulling interferometer to a level of 0.12% in<br />
amplitude and 5 nm in phase. This version of the AdN operates over a wavelength range of 8–12 μm.<br />
The AdN separates the two linear polarizations and produces spectra that are imaged one above the<br />
other at the surface of a deformable mirror. The long-focus parabolas, used in AdN are seen on the<br />
upper right. The PI of the AdN is Robert Peters.<br />
138
T E C H N O L O G Y R OADMAP FOR <strong>TPF</strong>-I<br />
6.2.5 Mid-Infrared Single-Mode Spatial Filters<br />
The <strong>TPF</strong>-I project has had several contracts for the development and production single-mode mid-infrared<br />
fibers (Ksendzov et al. 2006). As a result of this work the project has approximately 16 high-quality<br />
single-mode fibers that include chalcogenide fibers from the Naval Research Laboratory (Aggarwal et al.<br />
2005) and silver halide fibers from the University of Tel Aviv (Shalem et al. 2005). This is a significant<br />
change from the state of the art in 2002, when only one or two short samples of chalcogenide fibers had<br />
been produced by Le Verre Fluoré (Bordé et al. 2003). The technology for silver halide fibers is now<br />
advanced but still maturing. Computer control of the extrusion process for silver halide fibers has now<br />
greatly reduced inhomogeneities in the fibers. We have been pleased with test results of several bare<br />
samples, but only in 2006 were the first silver halide fibers received complete with casings and<br />
connectors. Nulling tests with these fibers are greatly anticipated because they hold the potential of<br />
extending the long-wavelength range of the testbeds.<br />
6.3 Formation Flying<br />
Formation flying and distributed collaborative systems have been an area of research at JPL dating back<br />
to the 1980s. Formation flying was originally sponsored by <strong>NASA</strong> as basic research within Code-R under<br />
the Distributed Spacecraft Technology (DST) element. When the two-spacecraft StarLight mission was in<br />
development, the DST efforts were focused towards key formation-flying controls technology, which at<br />
that time was at a relatively low technology-readiness level. A close collaboration between the DST and<br />
the StarLight Formation Guidance and Control (G&C) teams resulted in a rapid maturation of the scalable<br />
formation flying Control Architecture and key algorithms, including, Formation Guidance, Formation<br />
Acquisition, and Collision Avoidance.<br />
The StarLight mission development effort was ended in 2003, and the continuing work became the <strong>TPF</strong>-I<br />
technology effort aimed at providing a robust demonstration of formation flying through ground-based<br />
laboratory work. This was divided into two complementary efforts: 1) the Formation Algorithms and<br />
Simulation Testbed (FAST), and 2) the Formation Control Testbed (FCT). The FAST, is a high-fidelity<br />
distributed realtime close-loop formation control simulation, while, the Formation Control Testbed (FCT)<br />
is a multi-robot system level hardware testbed to validate the FAST formation control architecture and<br />
algorithms. An overview of these efforts and the results to date are given in the following sections.<br />
Further details are provided in Appendix C.<br />
6.3.1 Formation-Flying Requirements<br />
The top-level “flight requirements” for <strong>TPF</strong>-I mission are summarized in Table 6-3. Requirements are<br />
listed separately for knowledge and control of range, bearing, attitude, and the first-derivative with respect<br />
to time (rates) of these quantities. The requirements depend on the operating mode of the array. In<br />
addition, a number of functional requirements were also imposed, such as maintaining collision-free<br />
operation at all times, using minimum resources (fuel, time/cryogen, etc.) to accomplish the mission and<br />
be robust to transient faults.<br />
139
C HAPTER 6<br />
Table 6-3 Flight Requirements for Formation Flying with the <strong>TPF</strong> Interferometer<br />
Ref Parameter <strong>TPF</strong>-I Formation Flying Requirements per Operating Mode<br />
1 Operating Envelope<br />
Units Safe-Standoff Reconfiguration Hand-off Observation<br />
2 Formation Sensor Acquis. Sensor Acquis. Sensor Med<br />
Sensor<br />
Fine Sensor<br />
3 Inter-S/C Range m 20–200 20–10,000 20–80 20–80<br />
4 Inter-S/C Bearing – 4π steradians 4π steradians 10° cone 10 arcmin<br />
cone<br />
5 Inter-S/C Range<br />
Rate<br />
6 Inter-S/C Bearing<br />
Rate<br />
< cm/s 200 200 5 0.2<br />
< arcmin/s 60 60 10 2.5<br />
7 Acquisition Time < s 5 30 10 10<br />
8 Range<br />
9 Knowledge cm 100 50 1 0.1<br />
10 Control cm 200 200 5 2<br />
11 Range Rate<br />
12 Knowledge cm/s 1 0.1 0.1 0.001<br />
13 Control cm/s 5 0.5 0.5 0.050<br />
14 Bearing<br />
15 Knowledge arcmin 1800 60 1 0.067<br />
16 Control arcmin – 300 5 0.333<br />
17 Bearing Rate<br />
18 Knowledge arcmin/s – 1 0.167 0.0007<br />
19 Control arcmin/s – 5 1.000 0.0100<br />
20 Attitude (Abs.<br />
Sensor)<br />
21 Knowledge arcmin 1 1 0.1 0.1<br />
22 Control arcmin 60 60 3.0 1.0<br />
23 Attitude Rate (Abs.<br />
Sensor)<br />
24 Knowledge arcsec/s 1 1 1 1<br />
25 Control arcsec/s 5 5 5 5<br />
140
T E C H N O L O G Y R OADMAP FOR <strong>TPF</strong>-I<br />
There are four operating modes that have been defined: safe stand-off, reconfiguration, hand-off, and<br />
observation. The precise boundary between the different operating modes is to some extent arbitrary,<br />
since it depends on the capability of the sensors that are chosen. The acquisition sensor has the poorest<br />
resolution but the widest coverage in range and bearing angle. The acquisition sensor will be used<br />
primarily to establish the array configuration, reconfigure it, and recover from faults that would cause<br />
elements of the array to lose their station. The fine sensor has the most restricted coverage in bearing<br />
angle and is used to maintain the formation during science observations. The medium sensor has a<br />
capability allowing hand-off between the acquisition sensor and the fine sensor. It is the delay and delayrate<br />
limitations of the interferometer during the science observations that drive the formation-flying<br />
requirements.<br />
The requirements on formation flying are decoupled as much as possible from the requirements on<br />
nulling. The formation-flying system is envisioned as the “coarse stage” of a multi-layer control system<br />
that maintains the optical pathlengths. Centimeter-level variations in the relative positions of the<br />
spacecraft are sensed by the instrument’s fringe tracking system and compensated for by the optical-delay<br />
lines in each beamtrain, each of which is required to provide a control range of ±10 cm of optical delay.<br />
The small changes in the relative bearing angles between the spacecraft are compensated by the<br />
articulation of steering mirrors on the collector and combiner spacecraft. The thrusters and reaction<br />
wheels will be important disturbance sources for the interferometer, but optomechanical modeling will be<br />
needed to establish the appropriate requirements.<br />
The range and bearing control requirements during science observations are imposed by the limitations of<br />
the fringe sensor and delay line of the interferometer. If the fringes are allowed to move beyond the throw<br />
of the delay line, they will be lost. Similarly, if the fringes move too quickly for the fringe tracker to<br />
sense them, they will also be lost, even if they are within range of the delay line. The limitations of the<br />
delay line therefore impose requirements on range and bearing angle, and limitations of the fringe tracker<br />
impose requirements on range rate and bearing rate.<br />
The optical path-difference is required to be controlled to ±1 cm along the beam path, for both in-plane<br />
and out-of-plane directions. This ±1-cm control requirement is shown in Table 6-3, row 10 under the<br />
‘Observation’ operating mode. A bearing requirement of ±0.33 arcmin is equivalent to ±1 cm spacecraft<br />
position control at the shortest baseline with the collector spacecraft center-to-center separation of 100 m.<br />
Specific requirements are also levied on the ground technology development during the current pre-Phase<br />
A efforts. Since the flight conditions can be simulated in a high-fidelity simulation, the Formation<br />
Algorithms and Simulation Testbed is identical to the flight requirements listed in Table 6-3. The<br />
requirements for the multi-robot based Formation Control Testbed are somewhat relaxed, though scalable<br />
to flight requirements, and are given in Table 6-4.<br />
141
C HAPTER 6<br />
Table 6-4. Requirements of the Formation Control Testbed vs. Flight Requirements<br />
Parameter Flight Performance Formation<br />
Control Testbed<br />
Comments<br />
Number of spacecraft 5 3<br />
Operational capability<br />
Standalone operations 5 yr 36 min Total floatation time<br />
Mission duration 5 yr 5+ yrs<br />
Observational duration ~20 hr ~15 min For an “observation on the fly”<br />
Availability Continuous 8 hrs/day Ground testbed facility<br />
Motion DOFs 6 5+1 FCT:+ articulated DOF<br />
Operating envelope 3D space 2D plane FCT: with limited out-of-plane<br />
Control 2 cm / 20 arcsec 5 cm / 60 arcmin<br />
Fault recovery Active and passive None<br />
Flight capability<br />
Sensor<br />
Inertial Gyro/accel Gyro/accel<br />
Celestial Star tracker Pseudo-star tracker<br />
Relative Coarse, Med., Fine Medium<br />
Actuator Thruster, RWA Thruster, RWA<br />
Control Architecture Distributed Distributed<br />
Control Algorithms Flight Flight Developed by FAST<br />
Dynamic DOFs 6 5 FCT: +1 articulated DOF<br />
Range of motion<br />
Angular-in-plane 2π 2π<br />
Angular-out-of-plane ± 45° ± 45°<br />
Linear-in-plane<br />
Linear-out-of-plane<br />
Maneuvers<br />
Limited by sensor<br />
range<br />
Limited by sensor<br />
range<br />
Limited by lab<br />
space<br />
Acquisition 3D space 2D space<br />
Array rotation in-plane Yes Yes<br />
Array re-sizing Yes Yes<br />
Array re-targeting Yes Yes<br />
Collision Avoidance 3D space 2D space<br />
± 25 cm Emulate deadband during<br />
observations<br />
142
T E C H N O L O G Y R OADMAP FOR <strong>TPF</strong>-I<br />
6.3.2 Formation Algorithms and Simulation Testbed (FAST)<br />
Formation and Attitude Control System (FACS) lies at the heart of the formation-flying software. It is<br />
designed to provide three-axis inertial attitude and inter-s/c range and bearing control of each of the<br />
spacecraft in the <strong>TPF</strong>-I formation. Additionally, FACS provides the capability of initializing/reacquiring<br />
the formation through the acquisition of inter-s/c range/bearing knowledge, using the available on-board<br />
formation sensing capability. FACS ensures collision free operation of the formation throughout all<br />
nominal phases of the <strong>TPF</strong>-I mission. It is described in more detail in Appendix C. Here it is used for<br />
two software demonstrations that are described in the following pages.<br />
Two high-level scenarios have been demonstrated in FAST. The first consists of two spacecraft<br />
functioning as a distributed interferometer. The second is a two-robot simulation of the FCT.<br />
Figure 6-6. (top left) Spacecraft spring apart, arrest separation velocity, acquire relative sensor, and<br />
rotate formation to center Sun on panels; (top right) Beginning of second retarget: only relative position is<br />
controlled, the formation is drifting downwards; (bottom left) Approximately half-way through second<br />
retarget. Bowed trajectory is for collision avoidance; (bottom right) View after second retarget<br />
completed.<br />
143
C HAPTER 6<br />
Two-Spacecraft Distributed Interferometer<br />
The purpose of this simulation was to demonstrate nominal, ground-based operation of a distributedinterferometer<br />
formation with high-level commands and autonomous formation reconfigurations with<br />
collision avoidance. The spacecraft are in deep space and have several flexible modes due to a large<br />
sunshield with a fundamental mode at 0.5 Hz. An additional requirement for this FACS design was that<br />
all thruster firings for both attitude and relative position control across all spacecraft occur in the same 4-s<br />
window every 60 s. This requirement allows nanometer-level interferometer control loops to reacquire a<br />
fringe and make a science observation between impulsive disturbances due to thrusters. Subsequently, the<br />
selection of throttle-able ion thrusters that do not impart impulsive disturbances obviated this thruster<br />
quiescence requirement.<br />
The spacecraft go through individual modes to become power positive (such as detumble, Sun-search, and<br />
Sun-point) and then begin to acquire the formation. In this scenario, the two spacecraft are assumed to be<br />
in a stack and to separate via springs. Propagation using accelerometers is used to determine an<br />
approximate position of the other spacecraft. With this knowledge, the spacecraft point their formation<br />
sensors at one another. The autonomous-formation flying (AFF) sensor was used in this simulation,<br />
which is RF-based with a Global Positioning System-like (GPS-like) signal structure. The field-of-view<br />
of the sensors is 70 deg. After acquiring relative sensor lock and establishing inter-spacecraft<br />
communication (ISC), a coarse control loop is closed to maintain a constant distance, and the formation<br />
rotates toward the Sun on the formation solar panels. This formation is held until a command is received.<br />
144<br />
Figure 6-7. Visualization of FAST demonstration of two-robot FCT.
T E C H N O L O G Y R OADMAP FOR <strong>TPF</strong>-I<br />
Two commands were sent in this demonstration, both of which specify stellar targets to observe. The<br />
stop-and-stare observations consist of holding a constant relative position with the thruster quiescence<br />
requirement. The commands include the baseline to hold while observing, and the time allotted for<br />
retargeting. In response to a retarget command, the formation guidance algorithm first plans collisionavoidance<br />
constrained, energy-optimal relative spacecraft trajectories to achieve the desired baseline. This<br />
process is non-trivial, since the unconstrained, energy-optimal trajectories for the second retarget lead to a<br />
collision. Figure 6-6 shows several visualizations from this distributed, real-time demonstration of<br />
formation flying.<br />
Two-Robot FCT<br />
The purpose of this demonstration is to validate the FACS used on the FCT robots before implementation<br />
on the actual robotic hardware, including flight-like ISC and control-cycle synchronization. The<br />
formation software used the Real-Time protocol, wireless links, and time-offset estimation via echo<br />
packets, and control cycle synchronization. Additionally, the sensors models use measured sensor noise<br />
values. For example, each fiber-optic gyroscope on the robots was calibrated, and measured values of<br />
rate-random walk, angle-random walk, and angle white noise were used in the gyroscope model. The<br />
control cycles were initially 0.5 s out of synchronization, and the clock models had a relative drift of 0.1<br />
ms/s.<br />
In addition to autonomous reconfiguration, synchronized rotations were demonstrated in which the<br />
formation rotation rotates as a virtual rigid body. Synchronized rotations are used for observations “onthe-fly”<br />
and can also be used to retarget a formation. In the latter case, the rotation axis is not along the<br />
formation boresight.<br />
Figure 6-8 shows visualization from the two-robot FAST demonstration. The top of the figure shows the<br />
modes that the “Combiner” and “Collector” robots go through. In the figure, they are in Formation<br />
Observation mode and performing the first synchronized rotation. The lower part of the robots with the<br />
white tanks serves as a translation stage. The upper, cylindrical portions are referred to as the attitude<br />
stages and emulate spacecraft. As can be seen in the lower left, the attitude stages are a rotating and<br />
translating in a plane inclined to the experiment floor. This plane is normal to the star direction.<br />
These two FAST simulations demonstrated formation software for autonomous formation flying with<br />
realistic inter-spacecraft communication and asynchronous clocks. In particular, formation algorithms for<br />
actuation-constrained formation control, autonomous collision-free reconfiguration, and synchronized<br />
rotation were demonstrated. This formation software has been integrated with the Formation Control<br />
Testbed robots for a flight-like, hardware demonstration of precision-formation flying.<br />
6.3.3 Formation Control Testbed (FCT)<br />
The Formation Control Testbed (FCT) is the testing-ground for flight software developed for formation<br />
flying for <strong>TPF</strong>-I. It includes the two robots pictured in Fig. 6-8. Each robot uses cylinders of compressed<br />
air and linear air bearings (the circular metal pads seen in the photo) to float freely above a polished metal<br />
floor. A spherical air bearing supports a stage (shown tilted in the photograph) upon which are housed<br />
the avionics and processors of each robot. The robots have a master–slave relationship and algorithms for<br />
autonomous guidance. They can either be operated independently or together in “cooperative” mode.<br />
145
C HAPTER 6<br />
Figure 6-8: The Formation Control Testbed (FCT). Shown here are the two robots of the FCT, with<br />
Jason Keim. Each robot carries cannisters of compressed air that allow them to float off a polished metal<br />
floor. The floor is flat to within 2 one-thousandths of an inch (~50 μm) and spans a much larger area than<br />
shown here. The robots carry a platform (shown tilted for each robot) that is supported on a spherical ball<br />
bearing, also driven with compressed air so that the support of the platform is entirely frictionless. The<br />
robots serve as the hardware interface and testing ground for flight software developed for space<br />
applications in formation flying. The robots have completed their functional testing in cooperative mode<br />
and should achieve their major milestone of range and bearing control in mid 2007. The Principal<br />
Investigator of the Formation Control Testbed is Daniel Scharf.<br />
The robots are being tested within a celestarium that had been used previously to calibrate star trackers<br />
used by spacecraft. The spherical ceiling of the interior building has an array of artificial stars on it that<br />
the robot cameras can use to derive absolute position information down to the level necessary to reach the<br />
testbed's performance milestone.<br />
The FCT was planned as a ground-based laboratory consisting of three test robots in its fully deployed<br />
configuration. Much like in the distributed simulation under FAST, the FCT demonstrates formation<br />
acquisition, <strong>TPF</strong>-like formation maneuvering, and collision-free operations using the formation<br />
algorithms developed in the FAST. A high level of flight relevance was designed into the FCT avionics<br />
architecture, with on-board flight-like capabilities: (a) wireless communication emulating inter-spacecraft<br />
and spacecraft to ground communication; (b) on-board sensing and actuation using star tracker, gyros,<br />
thrusters, and reaction wheels for attitude and translation control; and (c) PowerPC flight control<br />
146
T E C H N O L O G Y R OADMAP FOR <strong>TPF</strong>-I<br />
Figure 6-9. Inter-robot position error, showing performance slightly outside the range<br />
requirements. Ongoing upgrades to the robot thrusters should bring the performance within<br />
requirements.<br />
computer on a compact peripheral communications interconnect (PCI) local bus under a vxWorks<br />
Realtime operating system. The on-board formation control software for the FCT is being developed by<br />
the Formation Algorithm and Simulation Testbed (FAST). To emulate the real spacecraft dynamics, the<br />
FCT was designed for realistic spacecraft-like dynamical behavior, mobility, and agility using linear and<br />
spherical air-bearings. With such 6-degrees-of-freedom dynamical motion and functional similarity to the<br />
<strong>TPF</strong> spacecraft, the FCT provides direct emulation of both individual spacecraft and formation behavior<br />
under autonomous on-board control. These architectural, functional, and dynamical similarities between<br />
the FCT and <strong>TPF</strong>-I provide a direct path of development to the <strong>TPF</strong> flight system.<br />
The requirements for the FCT have been listed in detail in Table 6-4. The layout of the FCT emulates the<br />
distribution of the formation-flying telescopes, which is limited to a plane to minimize stray light from<br />
adjacent spacecraft. The vertical air bearing has a range of ±25 cm, and the pitch and roll axes of each<br />
robot’s motion is limited to ±30°, which is a physical limitation due to the spherical air bearings.<br />
The FCT is designed to demonstrate an end-to-end system level formation flying control capability<br />
(functional and performance requirements) scaleable to flight, within a ground-test environment. The<br />
ground-operating environment for the FCT provides a more severe disturbance environment compared to<br />
the conditions in space. The net linear disturbance force due to solar pressure of ~6 µN/m 2 (at 1 AU) for<br />
the <strong>TPF</strong>-I spacecraft (assuming a 5.7-m radius sunshade with a surface area of 102 m 2 ) is around 0.6 mN,<br />
comparable to the robot linear drift force of ~0.26N due to maximum residual floor slope of 80 µrad.<br />
147
C HAPTER 6<br />
Figure 6-10. Detailed view of a Formation Control Testbed robot.<br />
148
T E C H N O L O G Y R OADMAP FOR <strong>TPF</strong>-I<br />
Moreover, the residual center-of-gravity (CG) mass imbalance torque of 5 mN-m of the top attitude<br />
platform of the FCT robot is about 33 times worse than the expected solar pressure induced torque of<br />
0.15 mN-m on the <strong>TPF</strong>-I spacecraft sunshade due CG to center of solar-pressure offset of ~0.25 m.<br />
The integration of the FACS software was successfully completed in February 2006, enabling the two<br />
FCT robots to operate in a formation mode for the first time. There are a number of calibration activities<br />
underway (inertia, thrusters, etc.); however, initial test results indicate that the closed-loop formation<br />
performance is very close to the required level (within factor of 2). Further formation tests will be<br />
performed once the ongoing calibration activities are completed.<br />
Figure 6-9 shows the two-robot baseline-hold performance while pointing to a specified (non-zenith)<br />
position. The plot shows the performance during the baseline/target hold, after two robots have<br />
maneuvered to achieve the desired baseline (2 m) and target star pointing (20 deg. off zenith). The<br />
required performance bounds are also indicated on the plot.<br />
The FCT currently does not have formation sensors to directly measure the inter-robot/spacecraft range<br />
and bearing. The range and bearing values for the FCT robots are currently derived from the position and<br />
attitude measurements from the star tracker on each robot — using parallax from the near-field FCT<br />
pseudo-star beacons mounted on the dome ceiling. An optical range and bearing sensor is currently under<br />
final hardware integration and test (I&T) phase to provide direct relative sensing capabilities in the near<br />
future. The difference of a factor of 60 in bearing control between the flight design and FCT requirement<br />
(1 vs. 60 arcmin) arises from the greatly reduced spacing between the 'spacecraft' in the testbed. The size<br />
of the control volume within which each spacecraft is constrained at a given time is comparable for the<br />
two cases. The technology gap between testbed and flight is really the precision of the bearing sensor that<br />
is needed to maintain the formation. Bearing sensing in the flight design will be achieved with a<br />
combination of inertial star trackers on each spacecraft and encoders on the steering mirrors that direct the<br />
science and metrology beams between the spacecraft, both of which are well within the current state-ofthe-art.<br />
In FY2006, using the two deployed FCT robots, FCT has functionally validated the FAST algorithms and<br />
the end-to-end formation-flying architecture, and the FCT team is currently in the process of validating<br />
the FAST predicted performance.<br />
6.4 Future Hardware for General Astrophysics<br />
The Terrestrial Planet Finder Interferometer (<strong>TPF</strong>-I) has immense potential to broadly transform<br />
astrophysics as well as to detect Earth-like planets. This potential relies on exploiting the high angular<br />
resolution and high sensitivity of <strong>TPF</strong>-I simultaneously in an imaging mode. Both hardware and software<br />
for aperture synthesis imaging capabilities must be developed to work well with a high-dynamic range<br />
over a small field-of-view (from one to a few diffraction-limited ‘primary beams’) using faint off-axis<br />
guide stars. This may require substantial modifications to the <strong>TPF</strong> system architecture beyond the<br />
minimum hardware architecture necessary for the baseline requirement of nulling interferometry over a<br />
narrow field (within one primary beam) around bright targets. However, the discovery potential for <strong>TPF</strong>-I<br />
will be so radically expanded by incorporating these additional imaging capabilities that they should be<br />
seriously considered as part of the overall <strong>TPF</strong>-I design. In this section we explore the potential hardware<br />
149
C HAPTER 6<br />
that would expand the general astrophysics capability of the current baseline design. Although such<br />
hardware is not currently funded for development within the <strong>TPF</strong>-I project, its importance has been<br />
emphasized by the <strong>TPF</strong>-I <strong>SWG</strong> for funding in future years.<br />
6.4.1 Off-Axis Phase Referencing<br />
The most critical hardware requirement for maximizing general astrophysics will be the addition of phase<br />
referencing using an off-axis guide star, a capability not needed for the planet finding activity where the<br />
primary star acts as the phase reference. This capability is crucial to obtain the theoretical sensitivity limit<br />
that is needed for very faint objects, since current baseline designs require an external reference for<br />
monitoring OPD drifts internal to the spacecraft and perhaps for monitoring array geometry.<br />
Having the capability of using an off-axis star, and hence an additional beam transport system, for phase<br />
referencing may not pose a problem if it is incorporated into the design process from the beginning, but it<br />
surely will require substantial modifications to the optics at the collector telescopes. <strong>TPF</strong>-I is a system<br />
optimized for low thermal background and off-axis phase referencing may require non-trivial changes to<br />
the current design of a “dual-star” module that is used to select the off-axis reference star while passing<br />
the on-axis light directly as is done with VLTI/PRIMA (Quirrenbach et al. 2004) and the Palomar Testbed<br />
Interferometer (PTI) (Colavita et al. 1999). Another possible approach would be to include a “fast<br />
switching” capability to the feed system or secondary mirrors on the collectors, to alternate between a<br />
guide star and the target star as is currently done in ground-based radio and mm-wave interferometry. A<br />
final option would be use an efficient dichroic to select a star in the field as a phase reference while<br />
allowing the mid-IR beam train to contain a different target. Further study is necessary to develop<br />
optimal designs for off-axis guiding that are consistent with the nulling requirements.<br />
6.4.2 Wavelength Coverage<br />
We must also consider the broadest possible spectral coverage when optimizing scientific return for<br />
general astrophysics. Based on the science case for terrestrial planet finding, the short wavelength side of<br />
<strong>TPF</strong>-I is generally restricted to ~5 μm due to: a) planets in the habitable zone have temperatures near<br />
room temperature, giving a peak in blackbody emission near 10 μm, and hence limited emission at short<br />
wavelengths; b) the performance requirements for the optics and wavefront quality that are driven for<br />
maximum performance around 10 μm to provide sufficient starlight suppression (deep nulling) to detect<br />
planets in the habitable zone.<br />
Because these limitations are not relevant for general astrophysical observations, the final <strong>TPF</strong>-I design<br />
should consider incorporating a secondary beam combiner optimized for general astrophysics. While this<br />
could add significant cost and complexity to the system, one option might be to design the phasereferencing<br />
combiner for this purpose. This idea is further explained below.<br />
It is likely that a ‘fringe tracking’ system will be incorporated into any baseline <strong>TPF</strong>-I design to control<br />
internal and external optical path difference (OPD) drifts. Most such designs operate by using off-band<br />
(near-infrared) light from the target itself (i.e., an “on-axis” guide star). In principle, this subsystem could<br />
be designed with its own separate beamcombiner that might function for example in the 1–5 μm band, to<br />
be used in parallel with the 5–15 μm beam combiner that is optimized for nulling and other lower-spatialresolution<br />
astrophysics.<br />
150
T E C H N O L O G Y R OADMAP FOR <strong>TPF</strong>-I<br />
6.4.3 Spectral Resolution<br />
Spectral resolution plays an important role both in allowing<br />
robust spectroscopy and also in aperture synthesis imaging,<br />
where the bandpass must be restricted to avoid “bandwidth<br />
smearing” distortion. Bandwidth smearing sets a minimum<br />
spectral resolution for imaging all objects within a single<br />
‘primary beam’ (truly, the minimum field-of-view<br />
requirement): the requirement on spectral resolving power, i.e.,<br />
R ~ λ / Δλ ≥ B / D, where λ is the wavelength, Δλ is the<br />
bandpass, B is the baseline length, and D is the diameter of the<br />
telescopes in the array. For 200-m baselines (12.5 mas<br />
resolution at 10 μm) and 4-m telescopes (primary beam of<br />
FWHM ~ 0.6”), we see that R > 40. This resolution can be<br />
obtained with a simple prism or grism that would likely be part<br />
of any detection system. Even extending the baseline to 1 km<br />
(2.5-mas resolution) would only require R > 200 spectrograph<br />
for imaging.<br />
While this minimum spectral resolution for imaging is easy to<br />
achieve, higher spectral resolution in the infrared would be<br />
invaluable for many other scientific goals. A special combiner<br />
for general astrophysics (suggested in the last section) could<br />
host a spectrograph with multiple levels of dispersion<br />
depending on the science goal.<br />
Figure 6-11. Beam combiner for pairwise<br />
combination.<br />
While it may difficult to obtain high spectral resolution (R>20000) for space-based telescopes due to<br />
weight and payload size limitations, the science gains from resolving ro-vibrational lines themselves<br />
could be immense by combining this kinematic information with the high angular resolution of the<br />
interferometer. As an alternative to deploying an echelle spectrograph, the interferometer could be used<br />
in a Fourier-transform spectrometer (FTS) mode to allow high-spectral-resolution interferometric<br />
observations, a potential gold-mine of information to probe the many mid-IR transitions of diatomic and<br />
polyatomic molecules associated with star formation and the extragalactic interstellar medium.<br />
6.4.4 Beam Combination and Field-of-View (FOV)<br />
There are readily available and proven techniques for imaging the entire field-of-view of the primary<br />
beam. However, this is a very small beam for <strong>TPF</strong>-I (~0.6″ at 10 μm) and thus would impose large costs<br />
in observing time to image a large FOV (such as Hubble Deep Field or nearby galaxies). Despite this<br />
limitation, the science case laid out in Chapter 3 is clearly transformational, resolving otherwise point-like<br />
objects across our Galaxy and indeed across the Universe. In this section we discuss options for imaging<br />
with <strong>TPF</strong>-I and explore ways to optimize the potential.<br />
With a symmetric rotating array of four telescopes arranged in either a line or a rectangle, there are only<br />
three fully independent baselines. All of the necessary beam combinations can be generated with a<br />
straightforward two-level four-beam combiner, as shown in Figure 6-11. Indeed, one of the outputs is in<br />
fact redundant (allowing for application of this output to the lowest signal-to-noise combination). If<br />
151
C HAPTER 6<br />
<strong>TPF</strong>-I is designed with the capability of arranging the telescope array into a non-redundant geometry, then<br />
an alternate beam combiner could be used that maximized the Fourier coverage and, thus, the imaging<br />
capabilities.<br />
There are possibilities for giving <strong>TPF</strong>-I truly wide-field imaging capabilities, extending beyond a single<br />
primary beam. Wide-field imaging is best obtained using homothetic pupil mapping (Beckers 1986),<br />
which is difficult to implement in practice for a reconfigurable array geometry, although formation flying<br />
offers a possible context for application. An FOV intermediate between a single primary beam but smaller<br />
than the optical vignetting limits can be attained through pupil densification, so-called hyper-telescope<br />
concept (Labeyrie et al. 2000, 2003)<br />
Novel optical arrangements have also been proposed that, when combined with special OPD modulation<br />
schemes, promise to provide a wide-field imaging capability simultaneous with high spectral resolution<br />
(e.g., the SPECS concept; Leisawitz et al. 2000). Recently, these schemes have been partially validated in<br />
the laboratory, clearly offering attractive features, and further research in this area should be pursued<br />
(Rinehart et al. 2006).<br />
6.4.5 Double Fourier Interferometry<br />
The mid-IR is rich in spectral features from source components in the solid state and gas phase. The<br />
spectrum includes atomic hydrogen recombination lines, ionized neon (Ne), argon (Ar), and sulfur (S)<br />
forbidden lines, H 2 rotational lines, and silicate, SiC and polycyclic aromatic hydrocarbon (PAH)<br />
features. These features appear on a continuum of thermal-dust emission. A wealth of information is<br />
available from the mid-IR spectrum, such as the radiation field intensity and hardness, the dust<br />
temperature, and the chemical state of the medium. Kinematic information is potentially available as well,<br />
but only when the available spectral resolution is ~10 4 for galaxies or ~10 5-6 for protostars and objects of<br />
similar size.<br />
The spectral resolution of <strong>TPF</strong>-I can be increased by increasing the stroke of the delay line. R = 1000 at<br />
10 μm requires only a 1-cm stroke, but R = 10 6 requires a 10-m delay-line stroke, a packaging challenge.<br />
Such very high resolutions probably require the addition of a grating.<br />
The wide field-of-view double Fourier technique (e.g., Mariotti and Ridgway 1988) can enable a <strong>TPF</strong><br />
mid-IR interferometer to provide high spatial resolution, high spectral resolution observations of spatially<br />
extended astrophysical sources. <strong>TPF</strong>-I could map protostars, debris disks, extragalactic star-forming<br />
regions, and protogalaxies on relevant spatial scales and simultaneously provide the spectroscopic data<br />
that would enable deep insight into the physical conditions in these objects. table 6-5 below shows<br />
desired measurement capabilities for a variety of targets and indicates that 10 mas is an interesting<br />
angular resolution and that ~1 arcmin is an interesting FOV for a wide variety of applications.<br />
152
T E C H N O L O G Y R OADMAP FOR <strong>TPF</strong>-I<br />
Table 6-5. Desired Measurement Capabilities for Desired Targets<br />
Ancillary<br />
Science Target<br />
Protostar<br />
(envelope, disk,<br />
outflow)<br />
Interesting<br />
Physical<br />
Scales<br />
Typical<br />
Distance<br />
Interesting Angular Scales<br />
(arcsec)<br />
Desired<br />
Resolution<br />
1 – 10 4 AU 140 pc 0.007 70<br />
Desired FOV<br />
Debris disk 1 – 300 AU 3.2 pc (e Eri) 0.3 93<br />
30 pc 0.03 10<br />
Extragalactic<br />
Giant H II<br />
Region<br />
Coma cluster<br />
galaxy<br />
High-z<br />
protogalaxy<br />
1 – 100 pc 5 Mpc 0.04 4<br />
0.01 - 10 kpc 107 Mpc 0.02 19<br />
1/100th source<br />
to separation<br />
between<br />
merging<br />
systems<br />
N/A 0.01 4<br />
The idea behind the double Fourier technique is that a Michelson stellar interferometer equipped with a<br />
pupil-plane beamcombiner and a scanning optical delay line can be operated like a Fourier transform<br />
spectrometer (FTS). Instead of providing only a visibility measurement for the interferometer baseline<br />
established by the collecting aperture locations, such a device produces an interferogram whose 1-D<br />
Fourier transform is the spectrum of the target scene on the spatial scales to which the interferometer is<br />
sensitive. Combined, the interferograms from all the baselines provide a three-dimensional data cube<br />
where the cube has two spatial and one spectral dimension, like the data from the integral field units<br />
discussed above.<br />
Using a conventional double-Fourier system, a <strong>TPF</strong> interferometer with 4-m diameter collectors operating<br />
at λ = 10 μm with a maximum baseline of 300 m could image a 0.6-arcsec diameter FOV at 4.8-mas<br />
spatial resolution. This field of view would be inadequate for the science programs mentioned above.<br />
However, the Wide-field Imaging Interferometry Testbed (WIIT) at <strong>NASA</strong>’s Goddard Space Flight<br />
Center was designed to develop and demonstrate a technique for wide-field (i.e., FOV >> 1.2λ/D)<br />
imaging in which a detector array is used to enhance the spatial multiplexing efficiency (Leisawitz et al.<br />
2003). In this design, light from field angles θ >> 1.2λ/D relative to the principal axis of the<br />
interferometer focuses onto additional pixels in a detector array, which records interferograms shifted by<br />
a geometric delay corresponding to |b| times the sine of the component of θ aligned with the baseline<br />
vector b. The field of view accessible to an interferometer like WIIT is given by θ FOV = N pix θ p /2, where<br />
θ p = 1.2λ/D is the primary beam diameter, N pix is the number of pixels along one dimension of the<br />
detector array, and the factor 2 allows for Nyquist sampling of the primary beam. For a 256 2 pixel array<br />
153
C HAPTER 6<br />
(N pix = 256) on the interferometer described above (D = 4 m, λ = 10 μm), θ FOV = 79 arcsec, a good match<br />
to the requirements outlined in Table 6-5.<br />
The critical technology for wide field-of-view double Fourier interferometry is already mature. Detector<br />
arrays such as those aboard the Spitzer Space Telescope (IRAC and IRS instruments), the Wide-field<br />
Infrared Survey Explored (WISE) mission, and their planned successors are well suited for this<br />
application, both in sensitivity and pixel count. The moving scan mechanism in the Composite Infrared<br />
Spectrometer (CIRS) on the Cassini mission provides ~10 cm scan range. FTS scan mechanism<br />
technology has extensive heritage in space.<br />
Caveat: The double-Fourier method is best suited for low to moderate spectral resolution. Resolution in<br />
the R = 10 4 –10 6 range is attainable with the double-Fourier method, but a long-delay line stroke is<br />
required, and the sensitivity is poorer than that available via dispersive methods and may be inadequate<br />
for certain sources and spectral lines.<br />
6.5 Bibliography<br />
6.5.1 References for Figure 6-1<br />
Bokhove, H., Kappelhof, J. P., Vink, H. J. P., Vosteen, L. L. A., Sodnik, Z., “Broadband nulling using a<br />
prism phase shifter,” Towards Other Earths: Darwin/<strong>TPF</strong> and the Search for Extrasolar<br />
Terrestrial Planets, edited by M. Fridlund, T. Henning, ESA SP-539, European Space Agency,<br />
Noordwijk, The Netherlarnds, 367–369 (2003).<br />
Brachet, F., Labèque, A., Léger, A., Ollivier, M., Lizambert, C., Hervier, V., Chazelas, B., Pellet, B.,<br />
Lépine, T., Valette, C., “Nulling interferometry for the Darwin misison: Polychromatic laboratory<br />
test bench,” New Frontiers in Stellar Interferometry, edited by W. A. Traub, Proc. SPIE 5491,<br />
991–998 (2004).<br />
Buisset, C., Rejeaunier, X., Rabbia, Y., Ruilier, C., Barillot, M., Lierstuen, L., Perdigues Armengol, J. M.,<br />
“Multi-axial nulling interferometry: Demonstration of deep nulling and investigations of<br />
polarization effects, ” Advances in Stellar Interferometry, edited by J. D. Monnier, M. Schöller,<br />
W. C. Danchi, Proc. SPIE 6268, 626819 (2006).<br />
Ergenzinger, K., Flatscher, R., Johann, U., Vink, R., Sodnik, Z., “EADS Astrium nulling interferometer<br />
breadboard for Darwin and GENIE,” Proc. Int. Conf. Space Optics 2004. ESA SP-554, European<br />
Space Agency, Noordwijk, The Netherlarnds, 223–230 (2004).<br />
Haguenauer, P., Serabyn, E., “Deep nulling of laser light with a single-mode-fiber beam combiner,” Appl.<br />
Opt. 45, 2749–2754 (2006).<br />
Martin, S. R., Serabyn, E., Hardy, G. J., “Deep nulling of laser light in a rotational shearing<br />
interferometer,” Interferometry for Optical Astronomy II, edited by W. A. Traub, Proc. SPIE<br />
4838, 656–667 (2003).<br />
154
T E C H N O L O G Y R OADMAP FOR <strong>TPF</strong>-I<br />
Martin, S. R., Gappinger, R. O., Loya, F. M., Mennesson, B. P., Crawford, S. L., Serabyn, E., “A midinfrared<br />
nuller for Terrestrial Planet Finder: Design, progress, and results,” Techniques and<br />
Instrumentation for Detection of <strong>Exoplanet</strong>s, edited by D. R. Coulter, Proc. SPIE 5170, 144–154<br />
(2003).<br />
Martin, S., Szwaykowski, P., Loya, F., “Testing exo-planet signal extraction using the Terrestrial Planet<br />
Finder Planet Detection Testbed,” Techniques and Instrumentation for Detection of <strong>Exoplanet</strong>s II,<br />
edited by D. R. Coulter, Proc. SPIE 5905, 590508 (2005).<br />
Mennesson, B., Crawford, S. L, Serabyn, E., Martin, S., Creech-Eakman, M., Hardy, G., “Laboratory<br />
performance of the Keck Interferometer nulling beam combiner,” Towards Other Earths:<br />
Darwin/<strong>TPF</strong> and the Search for Extrasolar Terrestrial Planets, edited by M. Fridlund, T.<br />
Henning, ESA SP-539, European Space Agency, Noordwijk, The Netherlarnds, 525–529 (2003).<br />
Mennesson, B., Haguenauer, P., Serabyn, E., Liewer, K., “Deep broad-band infrared nulling using a<br />
single-mode fiber beam combiner and baseline rotation,” Advances in Stellar Interferometry,<br />
edited by J. D. Monnier, M. Schöller, and W. C. Danchi, Proc. SPIE 6268, 626830 (2006).<br />
Morgan, R. M., Burge, J. H., Woolf, N. J., “Final laboratory results of visible nulling with dielectric<br />
plates,” Interferometry for Optical Astronomy II,” edited by W. A. Traub, Proc. SPIE 4838, 644–<br />
655 (2003).<br />
Ollivier, M., Contribution à la Recherche d’Exoplanètes: Coronagraphie Interférentielle pour la Mission<br />
Darwin, Ph.D. thesis, University Paris XI (1999).<br />
Samuele, R., Wallace, J. K., Schmidtlin, E., Shao, M., Levine, B. M., Fregoso, S., “Experimental progress<br />
and results of a visible nulling coronagraph,” 2007 IEEE Aerospace Conference, Big Sky<br />
Montana, paper 1333 (2007).<br />
Schmidtlin, E., Wallace, J. K., Samuele, R., Levine, B. M., Shao, M., “Recent progress of visible light<br />
nulling and first 1 million null result,” Direct Imaging of <strong>Exoplanet</strong>s: Science and Techniques,<br />
Proc. IAU Colloq. 200, edited by C. Aime and F. Vakili, 353–360 (2006).<br />
Serabyn, E., Wallace, J. K., Hardy, G. J., Schmidtlin, E. G. H., Nguyen, H. T., “Deep nulling of visible<br />
laser light,” Appl. Opt. 38, 7128–7132 (1999).<br />
Vosteen, L. L. A., Vink., H. J. P., van Brug, H., Bokhove, H., “Achromatic phase-shifter breadboard<br />
extensions,” Techniques and Instrumentation for Detection of <strong>Exoplanet</strong>s II, edited by D. R.<br />
Coulter, Proc. SPIE 5905, 59050A (2005).<br />
Weber, V., Barillot, M., Haguenauer, P., Kern, P., Schanen-Duport, I., Labeye, P., Pujol, L., Sodnik, Z.,<br />
“Nulling interferometer based on an integrated optics combiner,” New Frontiers in Stellar<br />
Interferoemetry, Proc. SPIE 5491, edited by W. A. Traub, 842–850 (2004).<br />
Wallace, K., Hardy, G., Serabyn, E., “Deep and stable interferometric nulling of broadband light with<br />
implications for observing planets around nearby stars,” Nature 406, 700–702 (2000).<br />
155
C HAPTER 6<br />
6.5.2 Achromatic Nulling Testbed<br />
Gappinger, R. O., Wallace, J. K., Bartos, R. D., Macdonald, D. R., Brown, K. A., “Current progress on<br />
<strong>TPF</strong>-I nulling architectures at Jet Propulsion Laboratory,” in Techniques and Instrumentation for<br />
Detection of <strong>Exoplanet</strong>s II, Proc. SPIE 5905, edited by D. R. Coulter, 55–61 (2005).<br />
Wallace, J. K., Babtiwale, V., Bartos, R., Brown, K., Gappinger, R., Loya, F., MacDonald, D., Martin, S.,<br />
Negron, J., Truong, T., Vasisht, G., “Mid-IR interferometric nulling for <strong>TPF</strong>,” New Frontiers in<br />
Stellar Interferometry, Proc. SPIE 5491, edited by W. A. Traub, 862–873 (2004).<br />
Wallace, J. K., Bartos, R., Gappinger, R., F. Loya, S. Moser, J. Negron, “Progress in broadband infrared<br />
nulling technology for <strong>TPF</strong>,” in Techniques and Instrumentation for Detection of <strong>Exoplanet</strong>s II,<br />
Proc. SPIE 5905, edited by D. R. Coulter, 47–54 (2005).<br />
6.5.3 Planet Detection Testbed<br />
Martin, S., “<strong>TPF</strong> Planet Detection Testbed: a four beam infrared testbed demonstrating deep, stable<br />
nulling and planet detection,” 2005 IEEE Aerospace Conference, Big Sky, Montana (2005)<br />
Martin, S., “Progress in four-beam nulling: results from the Terrestrial Planet Finder Planet Detection<br />
Testbed,” 2006 IEEE Aerospace Conference, Big Sky, Montana, 4–11 March (2006).<br />
Martin, S., Szwaykowski, P., and Loya, F., “Testing exo-planet signal extraction using the Terrestrial<br />
Planet Finder planet detection testbed,” Techniques and Instrumentation for Detection of<br />
<strong>Exoplanet</strong>s II, Proc. SPIE 5905, edited by D. R. Coulter, 70–79 (2005).<br />
Martin, S. R., Szwaykowski, P., Loya, F. M., and Liewer, K., “Progress in testing exo-planet signal<br />
extraction on the <strong>TPF</strong>-I Planet Detection Testbed,” Advances in Stellar Interferometry, Proc.<br />
SPIE 6268, edited by J. D. Monnier, M. Schöller, W. C. Danchi, 626818 (2006).<br />
6.5.4 Adaptive Nuller Testbed<br />
Lay, O. P., Jeganathan, M., Peters, R., “Adaptive nulling: a new enabling technology for interferometric<br />
exo-planet detection,” Techniques and Instrumentation for Detection of <strong>Exoplanet</strong>s, Proc. SPIE<br />
5170, edited by D. R. Coulter, 103–112 (2003).<br />
Peters, R. D., Hirai, A., Jeganathan, M. Lay, O. P., “Near-IR demonstration of adaptive nuller based on<br />
deformable mirror,” New Frontiers in Stellar Interferometry, Proc. SPIE 5491, edited by W. A.<br />
Traub, 1630–1638 (2004).<br />
Peters, R. D., Hirai, A., Jeganathan, M., Lay, O. P., “Adaptive nulling with a deformable mirror in the<br />
near-IR,” Techniques and Instrumentation for Detection of <strong>Exoplanet</strong>s II, Proc. SPIE 5905,<br />
edited by D. R. Coulter, 62–69 (2005).<br />
Peters, R. D., Lay, O. P., Hirai, A. Jeganathan, M., “Adaptive nulling for the Terrestrial Planet Finder<br />
Interferometer,” Advances in Stellar Interferometry, Proc. SPIE 6268, edited by J. D. Monnier,<br />
M. Schöller, W. C. Danchi, 62681C (2006).<br />
156
T E C H N O L O G Y R OADMAP FOR <strong>TPF</strong>-I<br />
6.5.5 Mid-Infrared Single Mode Spatial Filters<br />
Aggarwal, D., Shaw, L. B., and Sanghera, J., “Chalcogenide glass for mid- and longwave IR fiber lasers,”<br />
Fiber Lasers II: Technology, Systems, and Applications, edited by A. J. W. Brown, J. Nilsson,<br />
Proc. SPIE 5709, 242–248 (2005).<br />
Bordé, P., Perrin, G., Amy-Klein, A., Daussy, C., and Mazé, G., “Updated results on prototype<br />
Chalcogenide fibers for 10 micron wavefront spatial filtering,” Towards Other Earths:<br />
Darwin/<strong>TPF</strong> and the Search for Extrasolar Terrestrial Planets, edited by M. Fridlund and T.<br />
Henning, ESA SP 539, European Space Agency, Noordwijk, The Netherlands, pp. 371–374<br />
(2003).<br />
Ksendzov, A., Bloemhof, E,. White, V., Wallace, J. K., Gappinger, R. O., Sanghera, J. S., Busse, L. E.,<br />
Kim, W. J., Pureza, P. C., Nguyen, V. Q., Aggarwal, I. D., Shalem, S., and Katzir, A.,<br />
“Measurement of spatial filtering capabilities of single mode infrared fibers,” Advances in Stellar<br />
Interferometry, edited by J. D. Monnier, M. Schöller, W. C. Danchi, Proc. SPIE 6268, 626838<br />
(2006).<br />
Shalem, S., Tsun, A., Rave, E., Millo, A., Nagli, L., Katzir A., “Silver halide single-mode fibers for the<br />
middle infrared,” Appl. Phys. Lett. 87, 09113 (2005).<br />
6.5.6 Future Hardware for General Astrophysics<br />
Beckers, J. M., “Field of view considerations for telescope arrays,” Advanced Technology Optical<br />
Telescopes III, Proc. SPIE 628, edited by L. D. Barr, 255–260 (1986).<br />
Colavita, M. M., et al. “The Palomar Testbed Interferometer,” Astrophys. J. 510, 505–521 (1999).<br />
Lardière, O., et al. “VIDA (Vlti Imaging with a Densified Array), a densified pupil combiner proposed<br />
for snapshot imaging with the VLTI,” Interferometry for Optical Astronomy II, Proc SPIE 4838,<br />
edited by W. A. Traub, 1018–1027 (2003).<br />
Leisawitz, D. et al., “Scientific motivation and technology requirements for the SPIRIT and SPECS farinfrared/submillimeter<br />
space interferometers,” UV, Optical, and IR Space Telescopes and<br />
Instruments, Proc. SPIE 4013, edited by J. B. Breckinridge and P. Jakobsen, 36–46 (2000).<br />
Leisawitz, D., Frey, B. D., Leviton, D. B., et al., “Wide-field imaging interferometry testbed I: purpose,<br />
testbed design, data, and synthesis algorithms,” Proc. SPIE 4852, 255–267 (2003).<br />
Mariotti, J.-M, and Ridgway, S. T., “Double Fourier spatio-spectral interferometry,” Astron. Astrophys.<br />
195, 350–363 (1988).<br />
Martin, S., “The flight instrument design for the Terrestrial Planet Finder Interferometer,” Techniques and<br />
Instrumentation for Detection of <strong>Exoplanet</strong>s II, Proc. SPIE 5905, edited by D. R. Coulter, 21–35<br />
(2005).<br />
157
C HAPTER 6<br />
Pedretti, E., et al., “First images on the sky from a hypertelescope,” Astron. Astrophys. Sup. Ser.147,<br />
285–290 (2000).<br />
Quirrenbach, A. et al. “The PRIMA astrometric planet search project,” New Frontiers in Stellar<br />
Interferometry, Proc SPIE 5491, edited by W. A. Traub, 424–432 (2004).<br />
Rinehart, S. A. et al., “The wide-field imaging interferometry testbed: recent results,” Advances in Stellar<br />
Interferometry, Proc. SPIE 6268, edited by J.D. Monnier, M. Schöller, and W. C. Danchi, 626836<br />
(2006).<br />
158
F UTURE D EVELOPMENTS<br />
7 Preparatory Science for <strong>TPF</strong>-I<br />
The development of precursor science for <strong>TPF</strong>-I is shown schematically in Fig. 7-1, which highlights the<br />
major project phases and gate reviews. In green, we indicate the most significant programmatic decisions<br />
the mission must face. In the sections below, we describe in more detail how scientific questions feed<br />
directly into the decisions that <strong>TPF</strong>-I faces during its development.<br />
7.1 Pre-Phase A<br />
In Pre-Phase A, the focus of <strong>TPF</strong>-I science will be to contribute to the Mission Concept Review that will<br />
allow <strong>TPF</strong>-I to enter Phase A of its project life cycle. Key questions will include the level of exozodiacal<br />
emission and its influence on the designs of interferometer architectures, an assessment (mostly complete)<br />
of the spectral markers for <strong>TPF</strong>-I, and an initial selection of appropriate target stars.<br />
7.1.1 Priority 1: Exozodiacal Dust<br />
For the interferometer, a driving requirement is the need to suppress or reject starlight so that planet light<br />
can be detected. Moreover, atmospheric spectroscopy must be possible within the bands of biomarkers<br />
that have been identified. A starlight rejection of ~ 10 5 –10 6 :1 is needed for a mid-IR interferometer.<br />
Previous architecture studies have shown that the brightness of dust in the habitable zone of the target star<br />
adversely affects the integration time necessary to detect planets. Thus, in addition to a critical assessment<br />
of the technology needed for each architecture, it is important to characterize and understand the<br />
brightness of the average exozodiacal emission surrounding potential target stars prior to the Mission<br />
Concept Review.<br />
• A survey of a representative sample of target stars for dust on all orbital scales, from < 1 AU out to<br />
100 AU, is important for both the mission concept review and selection of preliminary targets.<br />
Although selected stars may be studied through individual peer-reviewed proposals, a program<br />
coordinated between <strong>NASA</strong> and ESA is needed that will make the best use of missions such as<br />
Spitzer and Herschel.<br />
• The <strong>TPF</strong>-I and Darwin Projects should also work to coordinate and make best use of upcoming<br />
ground-based facilities, such as the nulling instruments at KI and LBTI.<br />
• Our understanding of levels of exozodiacal dust and the relation of those levels to the search for<br />
planets would be further bolstered by strong support for a wide-ranging program of theory and<br />
modeling.<br />
159
C HAPTER 7<br />
7.1.2 Priority 2: Frequency of Terrestrial Planets<br />
Improved knowledge of extrasolar planetary systems will allow us to predict with greater certainty the<br />
scientific return from <strong>TPF</strong>-I. This question has highest priority once each mission enters Phase A, and<br />
therefore should have a high priority in the preceding years.<br />
• A comprehensive theoretical investigation into many aspects of the formation and evolution of<br />
planets and planetary systems must provide the framework within which to understand necessarily<br />
incomplete observational results. The combination of the existing and near-term radial velocity and<br />
transit programs—with theoretical insights into the orbital stability of planets, planetary migration,<br />
and the relationship between gas giants and rocky planets—will further enrich our understanding of<br />
extrasolar planetary systems.<br />
• Our current understanding of the frequency of Earth-like planets is based on observations of highermass<br />
planets discovered through radial velocity surveys, transit surveys, and on inferences from<br />
gravitational microlensing results. These highly successful programs should be further supported and<br />
encouraged as new detections of lower-mass and longer-period planets continue to refine our estimate<br />
of the frequency of Earths.<br />
• Radial velocity surveys would be better supported through the development of new specialized highresolution<br />
échelle spectrometers to offset the current demand for these instruments. Investments in<br />
new equipment for radial velocity surveys, directed also at under-used 2–3-m class telescopes, would<br />
represent an excellent strategy in the development of workhorse instruments for exoplanet detection.<br />
• The space-based missions CoRoT (CNES/ESA, launched in 2006) and Kepler (<strong>NASA</strong>, launch in<br />
2009) hold great promise for identifying transiting planets down to an Earth radius around stars<br />
located 100–1000 pc away. With these missions we will determine the statistical incidence of<br />
terrestrial planets and, with suitable follow-up, new insights into the physical state of these distant<br />
planets. Ground-based transit surveys should also be encouraged. Of special interest is the<br />
development of a worldwide network of dedicated wide-field transit or microlensing search<br />
telescopes that would allow follow-up studies of bright targets.<br />
7.1.3 Priority 3: Target Stars<br />
The quality of science that will be derived from <strong>TPF</strong>-I will be partly determined by the stars included in<br />
the final target list. A preliminary list of stars will greatly assist in judging the technical feasibility of the<br />
mission concepts. This preliminary target list may include a larger number of stars than are retained in<br />
the final list.<br />
• The <strong>TPF</strong>-I project needs to determine which stellar parameters are most relevant to the search for life.<br />
These parameters, once known, will need to be monitored over time for the stars included in the target<br />
list. Spectroscopic observations over a broad range of wavelengths will be needed with coordinated<br />
access to appropriate space observatories run by <strong>NASA</strong> and ESA. The <strong>TPF</strong>-I and Darwin projects<br />
should work with <strong>NASA</strong> and ESA to ensure a coordinated observing program to observe target stars.<br />
160
F UTURE D EVELOPMENTS<br />
• To complement the studies of nearby stars and potential targets, adequate support is needed for the<br />
development and maintenance of comprehensive databases and archives relevant to planet searches.<br />
A database, or central clearing-house, with active solicitations to provide missing information (colors,<br />
radial velocities, photometric variability, metallicities, binarity, interferometric measurements of<br />
diameters, etc.) should be established in Pre-Phase A.<br />
7.1.4 Priority 4: Signs of Life<br />
The technical requirements for the architectures of both coronagraphs and interferometers are dependent<br />
upon the wavelength range, or spectral bandpass, that is necessary to detect evidence of life. In particular,<br />
the shortest operating wavelength determines the required surface smoothness of optics and the<br />
mechanical stability of the observatory. The need for better starlight suppression would push the designs<br />
to use longer wavelengths, but amongst mid-IR biomarkers the relatively short-wavelength water-vapor<br />
band at 6.3 μm may prove the most sensitive and easiest to interpret—forcing a tightening of<br />
requirements of a mid-IR interferometer design. The necessary spectral bands of visible and mid-IR<br />
biomarkers must be known if the design team is to provide instruments tailored to <strong>TPF</strong>-I’s needs.<br />
To explore the plausible range of terrestrial planets that we may find, it is important to create selfconsistent<br />
theoretical models of planetary characteristics and evolution. These models will help to refine<br />
Figure 7-1. Summary schedule identifying the mission phases and science gates for the Terrestrial<br />
Planet Finder Missions.<br />
161
C HAPTER 7<br />
the instrumentation requirements and search strategies for <strong>TPF</strong>-I, and they will ultimately provide a<br />
theoretical framework for analysis of the mission data.<br />
7.2 Phase A<br />
In Phase A the emphasis will be on specifying the detailed design of the optics of <strong>TPF</strong>-I, leading to the<br />
Preliminary Mission and System Review. The mission and system definition studies will refine the<br />
architecture so that it is ready for preliminary designs in Phase B. The overriding question to be resolved<br />
by the end of Phase A will be to define the capability of the mission and determine to what scale the<br />
observatory must be built. What volume of space should be searched for planets How large of a<br />
collecting area will be needed What angular resolution will be required Scaling the architecture and<br />
defining the scope of the mission will be necessary before <strong>TPF</strong>-I continues to Phase B, C, and D.<br />
7.2.1 Priority 1: Frequency of Terrestrial Planets<br />
The scale of the <strong>TPF</strong>-I—the distance between the furthest collecting apertures of the interferometer—will<br />
determine the number of stars that are attainable. Defining the capability of a mission will involve a trade<br />
between the desire to explore a larger number of extrasolar planetary systems and the technological<br />
difficulty of building a larger observatory.<br />
To better understand this trade, preparatory science activities prior to Phase A will include detections of<br />
planets by a variety of techniques. Coupled with advances in astrophysical theory, these data (including<br />
transit detections of several-Earth mass planets from CoRoT for nearby stars) will provide improved<br />
estimates of the frequency of Earth-like planets. The programmatic implications will be wide-ranging.<br />
More certain knowledge of the frequency of Earths will not only help set the scale of the observatories but<br />
will later assist in setting priorities in the initial phases of the missions.<br />
7.2.2 Priority 2: Target Stars<br />
The refined target list, to be developed for the mission during its Phase A, will assist in optimizing the<br />
trades (taking into account the expected performance limits) that will ultimately define the capability of<br />
<strong>TPF</strong>-I. The number of attainable target stars of different spectral types, their distances, and their detailed<br />
characteristics will largely determine the scientific return of each mission. This target list is more than<br />
just an output from a catalog search. There are many characteristics of stars that must be measured, and<br />
then carefully weighed in importance, before such a refined list can be constructed.<br />
All nearby stars should be well characterized before the target lists for <strong>TPF</strong>-I can be chosen. A refined<br />
target list, with the farthest target identified, will be needed in Phase A to set the scale of the observatory.<br />
The distance to the farthest planet in the survey will be determined by the size of the observatory (its<br />
angular resolution) and the area of its collecting apertures (its sensitivity).<br />
162
F UTURE D EVELOPMENTS<br />
Table 7-1. Priorities of <strong>TPF</strong>-I Science Themes During Pre-Phase A and Phase A<br />
Priority Pre Phase A Phase A<br />
1 Exozodiacal Dust Frequency of Terrestrial Planets<br />
2 Frequency of Terrestrial Planets Target Stars<br />
3 Target Stars Signs of Life<br />
4 Signs of Life Exozodiacal Dust<br />
7.2.3 Priority 3: Signs of Life<br />
In Phase A the details will need to be defined of the spectrometers, filters, dichroics, and operating<br />
wavelengths of various instruments within <strong>TPF</strong>-I. The instruments will be optimized for the detection of<br />
known biomarkers. Our understanding of biomarkers must have advanced sufficiently during Phase A to<br />
set requirements for the detailed instrument designs.<br />
The spectroscopic resolution is another key parameter that defines the scientific scope. Because the<br />
planet signals are very faint, the spectroscopic resolution translates very directly into a sensitivity<br />
requirement. How long does it take to perform spectroscopic follow-up of a significant number of<br />
detected planets The resolution needed is, of course, a question that must be answered using our best<br />
understanding of the geophysical, atmospheric, and astrobiological processes that may be present on<br />
planets that <strong>TPF</strong>-I detects.<br />
7.2.4 Priority 4: Exozodiacal Dust<br />
Observations to characterize exozodiacal dust will continue to be important during Phase A and also in<br />
the phases through launch. Activities in this science theme will contribute to characterizing the stars in<br />
the list of target stars.<br />
7.3 Phases B and C/D<br />
In Phase B, C, and D, preparatory science will emphasize the preparation of a mission whose capability is<br />
already well defined. Studies will emphasize further development of the target list, understanding the<br />
environment of the target stars, and determining the best strategy to maximize the scientific return of the<br />
mission.<br />
A coordinated program will continue to observe and characterize all potential target stars and to establish<br />
a standardized database and archive of measurements. The target lists will be refined and prioritized to<br />
identify target stars most likely to harbor Earth-like planets. Observations with SIM PlanetQuest will be a<br />
particularly important component of this final step of characterization.<br />
163
C HAPTER 7<br />
Up until launch, preparatory science activities will aid in preparations for each mission: undertaking<br />
complementary observations of the target stars, establishing databases of standardized measurements, and<br />
refining techniques for the detection of biomarkers. There will be a wide variety of activities focused on<br />
improving the scientific productivity of the missions.<br />
164
D ISCUSSION AND C ONCLUSION<br />
8 Discussion and Conclusions<br />
The goal of <strong>NASA</strong>’s Navigator program is to find terrestrial planets and to search for life. We must find<br />
potentially habitable planets, (e.g., 0.5 to 10 Earth mass) located in or near the habitable zone of their<br />
parent stars, characterize their physical properties in terms of our growing knowledge of conditions that<br />
might be hospitable for the formation and stable evolution of life, and determine their atmospheric<br />
constituents or surface composition by looking for specific biomarkers (O 2 , O 3 , chlorophyll) or, more<br />
generally, the disequilibrium processes that might be attributable to the presence of life. As outlined in<br />
Chapters 1 and 2, this program is an ambitious one requiring the determination of masses via astrometry<br />
(with SIM PlanetQuest) and the detection of optical photons (with <strong>TPF</strong>-C) and mid-IR photons (with<br />
<strong>TPF</strong>-I/Darwin). In addition, <strong>TPF</strong>-I will address the cradle-to-grave evolution of stellar systems,<br />
specifically; the early evolution of star and planet formation, stellar and planetary death and cosmic<br />
recycling, the formation and evolution of Black holes, and galaxy formation and evolution.<br />
The main areas of focus for <strong>TPF</strong>-I in the past 3 years have been on architecture selection with emphasis<br />
on reducing sources of systematic noise and on technology development in the areas of starlight nulling<br />
and formation flying. In a 5-year mission, the X-array architecture using four 3.5-m telescopes has the<br />
capability to:<br />
a) Survey at least 150 F, G, K, and nearby M stars with at least three visits each;<br />
b) Make spectroscopic observations of the planets detected around at least 10 stars looking for O 3 ,<br />
CO 2 , H 2 O, and possibly other species that are trace constituents in the Earth’s atmosphere but<br />
which might be abundant in alien atmospheres such as CH 4 and N 2 O;<br />
c) Carry out a program for general astrophysics probing the 3-μm to 20-μm wavelength region with<br />
unprecedented μJy sensitivity and milli-arcsecond angular resolution.<br />
We have also examined in a cursory way the scientific capabilities of a reduced <strong>TPF</strong>-I mission consisting<br />
of four 3.2-m telescopes on a 36-m boom. While this configuration would be severely limited compared<br />
to the full <strong>TPF</strong>-I/Darwin mission, because of its limited angular resolution, it would be able to measure<br />
the mid-IR emission of nearby terrestrial planets found with other missions (SIM and/or <strong>TPF</strong>-C) in a<br />
number of broad-band colors and to look for the broadest spectral lines in a few of the brightest planets. If<br />
terrestrial planets prove to be common, nearby, and bright, a reduced version of <strong>TPF</strong>-I might be worth<br />
considering as a first probe of the infrared properties of planets.<br />
As outlined in this report a cadre of capable scientists and engineers around the country (and in Europe)<br />
are making steady progress on the precursor science and enabling technologies. Stable nulls deeper<br />
than10 -4 have been achieved with a spectral bandwidth of 32%. Deeper nulls of 10 -6 have been achieved<br />
in narrow laser bandpasses. Simulated planetary signals two million times fainter than a simulated star<br />
have been extracted using the Planetary Detection Testbed. The formation-flying testbeds are developing<br />
165
C HAPTER 8<br />
the flight-like hardware and software components that will be needed to safely operate a multi-spacecraft<br />
interferometer with the necessary precision.<br />
The scale of the <strong>TPF</strong>-I mission will be necessarily large, encompassing large cooled telescopes, multiple<br />
spacecraft operated in precision formation, and complex optomechanical systems. But the recent years of<br />
detailed study and technology development have revealed no fundamental impediments to carrying out<br />
<strong>TPF</strong>-I. The biggest risk this program faces is a highly uncertain funding environment over the next few<br />
years that threatens the steady technological progress that has been made.<br />
Finally, it is important to note that the science and technology teams of the <strong>TPF</strong> Interferometer (<strong>NASA</strong>)<br />
and the Darwin mission (European Space Agency) continue to maintain an excellent working<br />
relationship. Both groups believe that it is in their mutual interest that the projects eventually be combined<br />
in a single mission under a Memorandum of Understanding signed between <strong>NASA</strong> and ESA. Such a<br />
formal working relationship is some years away, and in the meantime, each group is working separately<br />
to build support for their efforts within their own community, with <strong>TPF</strong>-I progressing towards the next<br />
Decadal Survey report and Darwin developing strong support within ESA's Cosmic Vision <strong>Program</strong>.<br />
Through efforts in the near term the technical teams of <strong>TPF</strong>-I and Darwin are collaborating to arrive at a<br />
common architecture for the interferometer.<br />
With the strong public interest in the question of life beyond the Solar System, with the multi-disciplinary<br />
scientific interest in understanding the formation and evolution of life in environments different from our<br />
own, with the steady progress in key technologies, and with the promise of powerful capabilities for a<br />
broad range of astrophysical investigations, it seems inevitable that missions like <strong>TPF</strong>-I will, someday, be<br />
carried out.<br />
166
Appendices<br />
167
168
T E C H N O L O G Y A DVISORY C O M M I T T E E<br />
Appendix A<br />
Technology Advisory Committee<br />
Table A-1. <strong>TPF</strong> Technology Advisory Committee<br />
Name<br />
Institution<br />
Ron Allen<br />
Chris Burrows<br />
Rich Capps<br />
Dick Dyer<br />
Mike Krim<br />
Bruce MacIntosh<br />
Pete Mason<br />
Dave Mozurkewich<br />
Jason Speyer<br />
Space Telescope Science Institute<br />
Metajiva<br />
Jet Propulsion Laboratory<br />
Schafer Corporation<br />
Perkin-Elmer, retired<br />
Lawrence Livermore National Laboratory<br />
California Institute of Technology<br />
Seabrook Engineering<br />
UCLA<br />
169
A PPENDIX B<br />
170
F L I G H T S YSTEM C ONFIGURATION<br />
Appendix B<br />
Flight System Configuration<br />
Tables B-1 to B-5 describe the flight-system studied by the <strong>TPF</strong>-I design team in 2004. The interferometer<br />
under consideration was a four-telescope dual-Bracewell interferometer, depicted in Fig. 5-15.<br />
Table B-1. Mission Summary<br />
Parameter<br />
Preliminary Requirements<br />
Number of collector spacecraft 4<br />
Number of combiner spacecraft 1<br />
Design life<br />
5 years<br />
Mission orbit<br />
L2 Halo<br />
ΔV (TCMs and L2 injection)<br />
105 m/s<br />
Launch vehicle<br />
Delta 4050H<br />
Lift mass<br />
9408 kg<br />
Margin 30%<br />
Table B-2. Design Team Power Allocations<br />
DC Power Collector Combiner<br />
Payload 75 W 475 W<br />
Downlink 58 W 78 W<br />
Housekeeping 537 W 557 W<br />
Reserve 192 W 335 W<br />
Total 862 W 1445 W<br />
171
A PPENDIX B<br />
Table B-3. Design Team Mass Allocations<br />
Mass Collector Combiner<br />
Payload (each) 550 kg* 461 kg<br />
Spacecraft (each) 605 kg 684 kg<br />
Reserve (each) 276 kg 268 kg<br />
Total (each) 1431 kg 1413 kg<br />
Launch mass 5724 kg 1413 kg<br />
*Collector payload includes a 391-kg primary mirror with an aerial density of 30 kg/m 2<br />
Table B-4. <strong>TPF</strong>-I Combiner Spacecraft Design Summary<br />
Parameter<br />
Design Team Allocation<br />
Architecture<br />
Modular, process-driven, fully redundant<br />
Attitude control<br />
3-axis, zero-net-momentum<br />
Attitude determination<br />
Star trackers, inertial reference unit<br />
Attitude control actuators<br />
4 reaction wheels, 16 RCS thrusters<br />
Formation acquisition sensors S-band and sensors<br />
Propulsion / RCS<br />
Ion thrusters, Isp = 2500–3500 s<br />
Delta-V capability<br />
750 m/s<br />
Solar array type / size Rigid panel, 9.0 m 2<br />
Solar cell type<br />
Array power at end of life (EOL)<br />
Battery type / Capacity<br />
Thermal shield<br />
Telecommunications<br />
Data rates up/down<br />
Inter-spacecraft telecommunications<br />
Cascade multi-junction, 28% efficiency at<br />
beginning of life(BOL)<br />
1455 W (45° off-point)<br />
Li-ion, 72.7 A-h<br />
5-layer, deployable sunshade<br />
X-band up / Ka and X-band down<br />
2 kpbs / 1 Mbps (Ka-band) 16 kbps (X-band)<br />
UHF full-duplex, 2.0 Mbps<br />
172
F L I G H T S YSTEM C ONFIGURATION<br />
Table B-5. <strong>TPF</strong>-I Collector Spacecraft Design Summary<br />
Parameter<br />
Design Team Allocation<br />
Architecture<br />
Modular, process-driven, fully redundant<br />
Attitude control<br />
3-axis, zero-net-momentum<br />
Attitude determination<br />
Star trackers, inertial reference unit<br />
Attitude control actuators<br />
4 reaction wheels, 16 RCS thrusters<br />
Formation acquisition sensors S-band and sensors<br />
Propulsion / RCS<br />
Ion thrusters, Isp = 2500–3500 s<br />
Delta-V capability<br />
750 m/s<br />
Solar array type / size Rigid panel, 5.4 m 2<br />
Solar cell type<br />
Cascade multi-junction, 28% efficiency (BOL)<br />
Array power (EOL)<br />
862 W (45° off-point)<br />
Battery type / Capacity<br />
Li-ion, 19.8 A-h<br />
Thermal shield<br />
5-layer, deployable sunshade<br />
Telecommunications<br />
X-band up/down (contingency mode)<br />
Data rates up/down<br />
2 kbps / 16 kbps<br />
Inter-spacecraft telecommunications UHF full-duplex, 2.0 Mbps<br />
173
F ORMATION F LYING A L G O R I T H M D E V E L O P M E N T<br />
Appendix C<br />
Formation-Flying Algorithm<br />
Development<br />
Formation Flying Control Architecture<br />
Key requirement for the formation flying control architecture is to be scalable to more telescopes, yet<br />
robust while encompassing the traditional single spacecraft control functions and capabilities. This<br />
appendix describes details of the Formation and Attitude Control System (FACS) and the Formation<br />
Algorithms and Simulation Testbed (FAST).<br />
The overall formation-flying control architecture, regardless of the specific implementation, retains the<br />
traditional single-spacecraft attitude estimation, attitude guidance, and attitude control functions within<br />
each spacecraft to allow for “standalone” mode, while providing a centralized “formation” guidance<br />
function on any of the selected spacecraft in formation, designated the formation “leader”.<br />
The leader/follower control architecture was selected for <strong>TPF</strong>-I since it is effective for smaller formations<br />
(~2–10 s/c) and its stability properties are well-understood. In the leader/follower architecture, the<br />
centralized “formation” guidance functions ensure resource-efficient, collision-free, and coordinated<br />
formation maneuvering across all spacecraft within the formation via leader (combiner) generated<br />
commands, which are communicated over the inter-spacecraft communication (ISC) links to all the<br />
follower spacecraft (collectors). During formation experiments, the centralized formation-guidance<br />
commands, once received over the inter-s/c communication links, are implemented locally on each<br />
spacecraft through a local six-DOF control function. In the event of ISC dropouts or failure, each<br />
spacecraft within the formation reverts back to local “standalone” on-board attitude control mode to<br />
maintain power-positive Sun-pointing, while still being capable of performance ground-commanded linear<br />
delta-V maneuvers. The overview of the formation-flying control architecture is shown in Fig. C-1 within<br />
context of the s/c uplink/downlink and the ISC. Key features of the FACS architecture are summarized<br />
below:<br />
1. Hybrid Control Architecture<br />
a. Centralized translation guidance<br />
b. Decentralized attitude guidance<br />
c. Decentralized translation control<br />
d. Decentralized attitude control<br />
175
A PPENDIX C<br />
2. Identical FACS flight software load on all S/C<br />
a. Each S/C FACS S/W is capable of taking on the formation leader/follower role.<br />
Formation and Attitude Control System (FACS)<br />
Algorithms<br />
Formation Estimator<br />
The formation estimator optimally combines measurements from multiple sensors and produces estimates<br />
of different accuracy and bandwidth using an extended Kalman filter – to produce inter-s/c range and<br />
bearing estimates. In the case of the <strong>TPF</strong>-I mission, each of the spacecraft will have a variety of sensors for<br />
different phases of the mission. The formation-estimator algorithm will optimally combine the available<br />
sensor signals to provide the best inertial attitude estimate of each spacecraft and also the s/c-to-s/c relative<br />
position estimate. A high-level architecture and representative simulation is shown in Fig. C-2.<br />
Formation estimation consists of estimating both local spacecraft attitude and the relative position of all the<br />
other spacecraft in the formation. The latter we refer to as translation estimation.<br />
Attitude Estimation<br />
The attitude estimator determines the attitude of a spacecraft body frame with respect to an inertial frame,<br />
given star tracker and gyroscope measurements. Each spacecraft estimates its own attitude, and only local<br />
information is required.<br />
Estimation in general consists of a propagation step based on the physics-based dynamic model and an<br />
update step in which sensor measurements are combined with the propagated estimate. The spacecraft<br />
attitude depends on applied torques (e.g., from thruster and reaction wheels), which are governed by<br />
Euler’s equations. Although Euler’s equations are an accurate representation of the spacecraft dynamics,<br />
the input torques due to thruster firings are difficult to model. Hence, Euler’s equations do not provide an<br />
accurate means of propagating the attitude states of the spacecraft. Instead a kinematic model is used (i.e.,<br />
relating angular velocity to attitude) where the angular velocity is measured by the gyroscopes. The sensor<br />
measurement for the update step comes from the star tracker(s).<br />
Another important aspect of the attitude estimation problem is that gyroscopes have biases. The bias of<br />
each gyroscope must be added to the attitude estimation problem to obtain accurate estimates. Combining a<br />
gyroscope model with the kinematic attitude equation, one can obtain an equation for the errors in the<br />
attitude and bias estimates. Based on the above model, an optimal Kalman estimator has been designed.<br />
Translation Estimation<br />
On each spacecraft the translation estimator estimates the position of every other spacecraft in the<br />
formation with respect to itself. One complication in relative translation estimation is that it is coupled one<br />
way to attitude estimation. Relative sensors provide measurements between sensor frames on respective<br />
spacecraft. However, since a center-of-mass to center-of-mass (CM) relative position vector is desired for<br />
control, the estimator must transfer from the two sensor frames (one on each spacecraft involved in the<br />
measurement) to an inertial frame. This transfer requires the attitudes of both spacecraft.<br />
176
F ORMATION F LYING A L G O R I T H M D E V E L O P M E N T<br />
Figure C-1. Formation & Attitude Control System Architecture.<br />
The measurement update for the translation estimator is much more complex than for the attitude estimator<br />
because there are three levels of inter-spacecraft sensing (acquisition, medium, and fine) and these<br />
measurements are in terms of range and bearings; whereas, the state is in terms of Cartesian relative<br />
position. Each sensor measurement must also be transformed.<br />
The relative translation estimator has two components: 1) a Kalman filter; and 2) an acceleration data<br />
processing (ADP) algorithm, which produces bias-corrected CM acceleration estimates.<br />
1. Including all the necessary transformations and incorporating communicated data, an optimal Kalman<br />
estimator has been designed for the translation degrees of freedom. As each more precise level of<br />
sensing is acquired, the error in the estimate decreases. With the precision sensors locked, the resulting<br />
error that has been simulated is on the order of a few tens of millimeters, which meets the requirements<br />
for <strong>TPF</strong>-I.<br />
177
A PPENDIX C<br />
2. Recall that the coefficients needed for estimator propagation are the outputs of the ADP algorithm. The<br />
ADP takes the raw accelerometer measurements, corrects for accelerometer bias and the location of the<br />
accelerometer (when not at the spacecraft CM, accelerometers also sense centripetal acceleration), and<br />
rotates the acceleration into the inertial frame. The ADP serves two additional functions. First, when no<br />
thrusters are firing, it estimates the accelerometer bias. Second, when the thrust levels are very low and<br />
the accelerometer signal-to-noise ratio (SNR) is poor, the ADP estimates the acceleration based on<br />
thruster on-times.<br />
Formation Guidance<br />
For <strong>TPF</strong>-I there are three mission phases: formation acquisition, formation reconfiguration, and<br />
observation. Formation acquisition, also known as formation initialization, is the process of obtaining<br />
relative dynamic state information and establishing communication. It occurs after deployment or a fault<br />
condition. Formation reconfiguration moves the formation from one configuration to a new configuration.<br />
Reconfigurations occur after acquisition to move the formation to its initial science configuration, and after<br />
a science observation to retarget. Finally, the observation phase consists of rotating the formation as a rigid<br />
body and changing its baseline to synthesize a synthetic aperture. The observation phase is unique in that<br />
spacecraft attitudes must be synchronized with relative positions for the interferometer to operate. In each<br />
of these three phases, formation guidance must command the formation, that is, provide attitude and<br />
relative translation paths for all the spacecraft.<br />
There are three main constraints that the attitude and relative translation paths must satisfy: the collisionavoidance<br />
constraint (CAC), the Sun-avoidance constraint (SAC), and the relative thermal constraint<br />
(RTC). For the CAC, exclusion spheres are placed around each spacecraft, and relative translation paths<br />
must not cause the spheres to intersect. The SAC protects the infrared optics. It requires the payload<br />
“boresights” to remain within a cone about the anti-Sun line.<br />
Additionally, recall that <strong>TPF</strong>-I is an infrared interferometer. The optics are cooled to 40 K. The hot side of<br />
each spacecraft’s sunshield is approximately 300 K. If the hot side of one spacecraft’s sunshield were to<br />
illuminate the cold optics of another it would heat the optics. Then the formation would have to sit idle<br />
while the optics re-cooled. For each spacecraft, the RTC requires that relative position vector to the other<br />
spacecraft remain approximately 85° or more away from the sunshield normal. The RTC is a time-varying<br />
attitude constraint that depends on the relative positions of the formation.<br />
Spacecraft (Attitude) Guidance<br />
The attitude-guidance algorithms on each spacecraft are extensions of the attitude-guidance algorithm<br />
designed for the Cassini mission. On each spacecraft a base frame is defined by aligning (1) a body-fixed<br />
direction with an inertial direction, and (2) a second body fixed direction as much as possible with a second<br />
inertial direction. Attitude turns are then commanded by specifying a new attitude relative to either the<br />
current or base frame.<br />
When a new attitude is commanded, the guidance first checks if the new attitude violates the SAC. If it<br />
does, the command is rejected. If not, then an attitude path is first planned based on an Euler turn. If during<br />
this turn the SAC is violated, then the turn is broken into three Euler turns that do not violate the SAC. This<br />
algorithm does not address the RTC. However, the RTC is only active after the spacecraft are in science<br />
178
F ORMATION F LYING A L G O R I T H M D E V E L O P M E N T<br />
Figure C-2. Formation Estimator Architecture and representative results.<br />
configuration. In science configuration attitude maneuvers are synchronized with relative positions so that<br />
the RTC is satisfied.<br />
Translation Guidance<br />
We consider each of the three mission phases. For formation acquisition, the baseline acquisition sensor has<br />
an unlimited FOV. Further, the baseline <strong>TPF</strong>-I design includes omni-directional communication. As a<br />
result, formation acquisition consists of turning these systems on. If there is an acquisition sensor antenna<br />
failure or a spacecraft occultation, then communication and relative sensing will not be immediately<br />
established. Deployment of spacecraft from the cruise stage can be planned to avoid occultations. In the<br />
event of an acquisition sensor antenna failure, the limited-FOV acquisition algorithm of Ploen et al. (2004)<br />
can be used. Another possibility may be that the spacecraft are out of range of their acquisition sensors. In<br />
this case, ground intervention is needed.<br />
For formation reconfiguration, a general deep space, energy-optimal formation reconfiguration algorithm<br />
with collision avoidance has been developed (Singh et al. 2001). This algorithm does not address the RTC.<br />
However, the RTC is not active initially. Therefore, the algorithm of Singh et al. (2001) is used to plan<br />
trajectories to move the formation from its post-acquisition configuration to its initial science configuration.<br />
179
A PPENDIX C<br />
Once the formation has assumed the science configuration and optics have cooled, the RTC is active.<br />
Reconfigurations are then needed to retarget the formation between observations. Planning coupled relative<br />
translation/attitude reconfigurations with an RTC is an open area of research. Therefore, for retargeting<br />
reconfigurations we rotate the formation as a virtual rigid body. This approach satisfies the CAC and RTC,<br />
and avoids communication and sensor occultations. Finally, since the initial baseline direction for a new<br />
science target is unconstrained, an Euler rotation of the formation, in which the individual spacecraft<br />
behave as if embedded in a virtual rigid body, can always be found that satisfies the SAC for the spacecraft.<br />
In science configuration, each spacecraft aligns its payload boresight (body z-axis) with the formation<br />
boresight s. The collectors must also be aligned along the current baseline vector b with their body x-axes<br />
aligned with the baseline. When an initial baseline for Target 2 is specified, an Euler retargeting rotation<br />
can cause the aperture boresights to leave their SAC cones. However, when the initial baseline for Target 2<br />
is free, an Euler rotation can always be found that satisfies the SAC during the entire retargeting. If a future<br />
mission operational design constrains the initial baseline for a new target, then a sequence of three Euler<br />
rotations can be found to satisfy the SAC. The algorithm for formation rotations is discussed in more detail<br />
as part of the observation phase.<br />
For observations the formation must be rotated about the formation boresight vector, and attitudes must be<br />
synchronized with relative positions. For retargeting the formation can be rotated about an arbitrary axis,<br />
and there is no attitude/relative position synchronization requirement. As a result, the same relative<br />
translation guidance algorithm is used for both observation and retargeting rotations. Synchronized<br />
attitudes are achieved by commanding each spacecraft to align its body z-axis with the formation boresight<br />
and either (i) its body x-axis with the baseline vector or (ii) an assigned body vector with the direction to a<br />
neighboring spacecraft.<br />
A formation rotation algorithm has been developed that rotates the formation about the energy-optimal<br />
point. The spacecraft travel on a polygonal approximation to arcs, where the number of polygonal<br />
segments is commandable.<br />
Formation Controller<br />
The Formation Controller controls the s/c and formation to follow the desired inertial attitude and<br />
formation range/bearing profiles as prescribed by formation guidance. The formation controller implements<br />
the desired path by computing and commanding the needed forces/torques to bus for mapping to available<br />
actuators. See the papers by Scharf et al. (2004) and Lurie (2003).<br />
Attitude control (as opposed to guidance) is decoupled from relative translation control. Therefore,<br />
independent attitude controllers can be designed. Attitude control is completely decentralized.<br />
In operation, each collector estimates its relative position with respect to the combiner and its inertial<br />
attitude. Based on relative translation guidance from the combiner and local attitude guidance, each<br />
follower’s controllers drive performance errors to within the requirements. The combiner controls its<br />
attitude and applies feed-forward accelerations as dictated by formation guidance.<br />
There is an important, non-standard constraint on relative position and attitude control. Observations are<br />
performed entirely using thrusters. Since the thrusters are not throttle-able, their firing can cause spacecraft<br />
180
F ORMATION F LYING A L G O R I T H M D E V E L O P M E N T<br />
vibrations that interrupt the interferometer. To allow for both actuation and science, all thrusters on all<br />
spacecraft for both attitude and relative position control may only fire in a 6 s window every 54 s. Data<br />
gathering occurs during the 54 s between thruster firing windows. This requirement is referred to as the<br />
thruster synchronization constraint (TSC).<br />
For control design, both relative translation and attitude dynamics are well approximated by independent<br />
double integrator models. Relative translation control design is simplified since <strong>TPF</strong>-I will be in orbit about<br />
a Sun-Earth Lagrange point. In these orbits, the relative translation dynamics are well approximated by<br />
decoupled double integrator models (Scharf et al. 2002). Similarly, since the <strong>TPF</strong>-I spacecraft are three-axis<br />
stabilized, have small off-diagonal inertias, and rotate slowly, the small angle approximation is valid. In<br />
this approximation, the attitude quaternion is decomposed into independent body axis angle errors, and the<br />
dynamics of each angle error are approximated by a double integrator model. Since each relative translation<br />
and rotational degree of freedom is modeled by a double integrator, one SISO controller can be designed<br />
for all degrees of freedom and then scaled to the correct double integrator model (e.g., by multiplying by<br />
the inertia about a principal axis).<br />
Since the attitude and translation dynamics have the same control design model and constraints, we used<br />
the same design process for each as described next.<br />
Control design is done via a classical approach augmented with nonlinear dynamic compensation (Lurie<br />
2003). A controller is divided into two parts: a fast controller that runs at the 1 Hz FACS rate, and a slow<br />
controller that runs at 1/60th of a Hertz. The slow controller output is scaled and applied over 4 s of the 6 s<br />
window with 2 s reserved for margin. Both controllers are stable individually and in parallel. Switching<br />
between the fast and slow controllers is done using non-linearities in the controller, and so no additional<br />
mode commander is necessary. The fast controller turns off when the position tracking error is small. Then<br />
actuation only occurs every 60 seconds per the RTC. There may be regions of the phase space where no<br />
control is active. The current design is such that the maximum drift time is 17 s. These regions could be<br />
removed at the cost of increased controller complexity, but the regions do not affect steady-state tracking<br />
performance.<br />
The fast controller is a PD with nonlinear dynamic compensation and includes rate limits in the event of<br />
large tracking errors. The slow controller is a PID and also has nonlinear dynamic compensation. The<br />
nonlinear compensation in both the fast and slow controllers allows a conditionally stable loop to be<br />
designed that is stable in the event of saturations. In effect, high gain controllers have been designed based<br />
on the Bode integral constraints that reduce their gain as tracking errors become large.<br />
The control design was simulated to demonstrate its performance. The scenario considered was the control<br />
of a collector during an observation with a formation rotation period of 48 hours and the formation plane<br />
perpendicular to the Sun-line. Recall that during an observation the spacecraft are traveling on a circle and<br />
rotating about their body z-axes to keep their body x-axes aligned with the formation baseline. Therefore,<br />
the attitude commands, which are in the body frame, are zero in the body x- and y-axes and a ramp in the<br />
body z-axis. Relative translation commands, which are in the inertial frame, are sinusoids in the inertial x-<br />
and y-axes, and zero in the inertial z-axis. For convenience, the inertial x-y plane has been chosen to<br />
coincide with the formation plane. The full simulation model includes: (i) actuator misalignments of 10<br />
arcsec, (ii) estimation noise based on the estimator performance, (iii) an extra delay of one RTI, (iv) a<br />
sunshield mode at 0.48 Hz, (v) a solar torque of 0.15 mN m about the body x-axis and a differential solar<br />
181
A PPENDIX C<br />
Figure C-3. Example of controller tracking error for both attitude and translation control, the <strong>TPF</strong>-I<br />
requirements can be met with the TSC.<br />
pressure of 0.5 mN in the inertial z-axis, (vi) mass and inertia uncertainties of 3%, and (vii) kinematic<br />
decoupling errors, which result from realizing inertial force commands with body-fixed thrusters and<br />
imperfect attitude knowledge. To ensure performance with margin, the solar-induced disturbances are<br />
larger than will be expected in practice.<br />
The steady-state simulation results are given in Fig. C-3, which show, respectively, the body x-axis angular<br />
tracking error and the inertial x-axis relative translation tracking error. There is a considerable transient (not<br />
shown) due to the low bandwidth of the controllers required by the TSC. However, the transient will be<br />
reduced when the controllers are integrated with the formation guidance, which provides feed-forward<br />
accelerations.<br />
Mode Commander (Formation/S/C)<br />
The Mode Commander (MDC) coordinates the algorithms with the current mission phase and hardware<br />
capabilities. For example, it lets the FACS algorithms know when the star tracker can provide<br />
measurements or when all spacecraft are ready for a synchronized rotation for covering the u-v plane. All<br />
FACS modes are contained within the two main modes (namely “standalone” and “formation”) and these<br />
two nodes enable the end-to-end operations of the FACS across all mission phases, including the various<br />
anticipated system hardware configurations.<br />
In standalone mode, each of the spacecraft in <strong>TPF</strong>-I formation can perform basic system checkout at a safe<br />
separation. Upon successful spacecraft system checkout, the spacecraft will be ground commanded to a<br />
closer range, within the formation sensor acquisition range (nominally at 10 km), while still in standalone<br />
operational mode. At this closer range, the ISC and formation sensors signals are to be acquired. Once<br />
formation knowledge and inter-s/c communication is established, the flight system can be commanded to<br />
enter the formation operational mode.<br />
While in the formation mode, the spacecraft within the <strong>TPF</strong>-I formation can be ground commanded to reconfigure<br />
to any desired safe formation separation. While in formation mode, a loss of ISC or range and<br />
bearing (spacecraft-to-spacecraft position) knowledge will result in automatic transition back to the<br />
182
F ORMATION F LYING A L G O R I T H M D E V E L O P M E N T<br />
standalone operational mode to allow for safe operations. Similarly, attitude knowledge loss of partner’s<br />
attitude, while still having range/bearing knowledge, will result in precautionary safing of self while still<br />
maintaining the formation operational mode.<br />
At any time, while in either cluster or separated configuration, loss of spacecraft attitude knowledge will<br />
result in an attempt to regain inertial knowledge by nulling any residual attitude rates and acquisition of<br />
celestial and inertial attitude sensors.<br />
Control Mapper<br />
The control allocator takes the requested force and torque from the controller and generates low-level<br />
commands to the thrusters and/or reaction wheels. Forces can only be implemented by the thrusters.<br />
Torques can be implemented by thrusters, reaction wheels, or a combination of both. The current FACS<br />
control allocator allows torques to be implemented by only thrusters or only reaction wheels. This<br />
limitation is more operational, and if blended thruster/reaction wheel torques are desired (e.g., in the event<br />
of multiple reaction wheel or thruster failures), the FACS control allocator could be extended. If torques are<br />
generated by reaction wheels, the commanded torques are simply passed to the reaction wheels. As such,<br />
the principal FACS control allocator algorithm takes forces and torques to thruster on-times.<br />
The thruster allocation problem is formulated as a convex optimization problem by minimizing a cost<br />
function consisting of force and torque errors and a weighted sum of thruster on-times. The latter creates<br />
the convexity of the cost function and is a measure of the fuel consumed. The constraints are that the ontime<br />
for each thruster must be between a high and low value. This constraint is also convex as desired.<br />
Using the problem structure, a gradient descent algorithm is used to solve the constrained optimization<br />
problem. Hence, if the thrust allocation algorithm is interrupted in real-time while it is optimizing, the<br />
current value of thruster on-times in the optimization will be better than the previous value. The gradient<br />
descent starts at the unconstrained solution, which can be determined analytically.<br />
FAST – Distributed Real-Time Simulation<br />
The Formation and Algorithms and Simulation Testbed (FAST) is a hard real-time, distributed simulation<br />
environment for precision formation algorithm design and validation. FAST is built upon several PowerPC<br />
750 flight-like processors running a flight-qualified, real-time OS. (The Mars Reconnaissance Orbiter is<br />
currently flying the radiation-hardened version of the PPC 750.) A ground console is used for commanding<br />
a formation and for processing the telemetry. The dynamics of spacecraft, sensors, actuators, up-links,<br />
down-links, and inter-spacecraft communication are also simulated on distributed processors using the<br />
Hierarchical Distributed Re-configurable Architecture (HYDRA) simulation environment (Martin et al.<br />
2003). In particular, the dynamics of each spacecraft are integrated on separate processors, thereby enabling<br />
a fully scalable, distributed simulation architecture. With the open-architecture HYDRA, FAST can be used<br />
to simulate a five-spacecraft formation in low-Earth orbit or, with the addition of processors, a thirtyspacecraft<br />
formation in deep space. Furthermore, the distributed architecture enforces truly distributed<br />
algorithms and prevents inadvertent data sharing.<br />
183
A PPENDIX C<br />
Figure C-4. FAST Flight and simulation clusters (left) and schematic (right).<br />
The FAST configuration is representative of one that would be used in a flight project to test and debug the<br />
real-time flight code before proceeding to full flight-system testing. Essentially an extension of a singlespacecraft<br />
flight software testbed to formations, FAST can evaluate end-to-end performance, functionality,<br />
and long-term robustness of precision formations.<br />
The next section presents the FAST hardware in detail. Then, the functional architecture of FAST is<br />
discussed, including HYDRA and its distributed timing architecture. Next, the software executive and the<br />
FACS currently used in FAST are reviewed. Finally, two-spacecraft distributed interferometer and tworobot<br />
FCT simulation results are given.<br />
FAST Functional Architecture<br />
The functional architecture of FAST is shown in Fig. C-4. The five spacecraft computers are shown, each<br />
hosting a software executive and formation software. The formation software on each spacecraft computer<br />
is referred to as a Formation and Attitude Control System (FACS), described previously. The simulation<br />
computers have models for sensors, actuators, spacecraft dynamics, environmental forces, and<br />
communication. Standard single-spacecraft actuators, sensors, and uplink/downlink models are included.<br />
For formations, additional models for inter-spacecraft communication (ISC) and relative sensing are<br />
184
F ORMATION F LYING A L G O R I T H M D E V E L O P M E N T<br />
required. Relative sensing and ISC are the unique hardware models that couple individual spacecraft<br />
simulations. This coupling differentiates a formation simulator from a constellation simulator.<br />
As the number of spacecraft in a formation increases, the overhead required to manage communication and<br />
synchronization between distributed simulation components grows rapidly. A scalable, flexible, and easily<br />
extensible architecture is needed to automate communication and manage connections between distributed<br />
applications. HYDRA automates the connection of distributed simulation elements using a publish–<br />
subscribe, client-server paradigm. As each client application is started, it provides the HYDRA server with<br />
a list of offered and desired services. The HYDRA server commands two clients to form a connection when<br />
they have advertised compatible services. Adding a simulated spacecraft to the formation only requires<br />
starting up another spacecraft client. HYDRA allows the user to override default behaviors at several<br />
layers. While HYDRA is similar to other distributed architectures (such as CORBA and HLA), it was<br />
specifically designed for the needs of high-speed, distributed simulation.<br />
In HYDRA, client applications communicate through connectors that abstract message passing over a<br />
variety of protocols and infrastructure, including Scalable Coherent Interface (SCI) and transmission<br />
control protocol/internet protocol (TCP/IP). Each spacecraft simulation in FAST is a HYDRA client. A<br />
sixth simulation computer functions as the HYDRA server. All clients register with the server over the<br />
Ethernet local-area network (LAN). The majority of inter-process communication in is handled by<br />
HYDRA, including:<br />
1. ISC traffic over the SCI connection,<br />
ii) 2. Uplink, downlink, time coordination, and relative sensor traffic over Ethernet, and<br />
3. Inter-process traffic within a computer. Simulation computer-to-spacecraft computer traffic over the<br />
fiber-optic reflective memory cards is controlled via an interface specification.<br />
Each simulation computer simulates the dynamics for only its associated spacecraft. The spacecraft<br />
dynamics are integrated using the Dynamics Algorithms for Real-Time Simulation (DARTS) software<br />
package (Jain and Rodriguez 1992). DARTS is a multi-platform software library written in C and is based<br />
on spatial operator algebra. It provides efficient numerical algorithms for both rigid-body and flexible-body<br />
dynamics. Spacecraft mass and inertia properties are input to DARTS using a Tool Command Language<br />
(TCL) script. A lightweight interface to DARTS provides external actuator and sensor models access to<br />
force and torque inputs and state outputs. A numerical integrator is used to propagate the system state based<br />
on accelerations computed by DARTS. FAST currently provides either a fixed-step, fourth-order Runge-<br />
Kutta integrator or the variable-step CVODE integrator (Cohen and Hindmarch 1996). The fixed step<br />
integrator provides real-time, deterministic performance while the variable step integrator provides higher<br />
accuracy.<br />
A critical function of HYDRA is the synchronization of the separate spacecraft simulations for relative<br />
sensing (Sohl et al. 2005). Specifically, relative sensing requires synchronization of the dynamics<br />
integrators running on separate computers to provide consistent state information at a given time. A second<br />
crucial function coupled to state synchronization is the simulation of local spacecraft clocks (SCLKs).<br />
Spacecraft clocks are used to time-tag measurements and initiate digital control cycles. As spacecraft<br />
clocks will have different offsets and drifts, control cycles on spacecraft will start at different true times and<br />
will move with respect to one another. In addition, ISC will have jitter and dropouts. These characteristics<br />
must be accurately simulated to evaluate formation robustness.<br />
185
A PPENDIX C<br />
The “true” time of the simulation environment is based on the processor clock of the HYDRA server. This<br />
clock is synchronized to the JPL GPS-based Network Time Protocol (NTP) server to within 1 ms.<br />
Each spacecraft also has its own local concept of time. The processor clock of the associated simulation<br />
computer serves as the basis of local time. These processor clocks are synchronized to the HYDRA server<br />
clock’s true time via NTP. The processor clock of a simulation computer drives the local SCLK model,<br />
which adds an offset and a drift. All interrupts required by the software executive and formation software<br />
are based on the SCLK time and are provided by the simulation computer as interrupts across the reflective<br />
memory interface. This timing architecture emulates an actual formation of disparate spacecraft. A control<br />
cycle with a desired duration of 1 s can be 0.995 s on one spacecraft and 1.005 s on another.<br />
The SCLK time is also used to control the local numerical integrator. This design allows all local sensor<br />
and actuator rates to be based on the local SCLK as they would be in practice. However, as a formation<br />
simulation progresses through M seconds, some spacecraft would have integrated 0.995M of true time and<br />
others 1.005M. To eliminate this problem, the Timing Coordinator on the HYDRA server sends a pulse<br />
every second of true time. When the coordination pulse arrives, the drift of the local SCLK with respect to<br />
true time is determined. Subsequent integration intervals are updated to reflect this drift. For example,<br />
assume a SCLK runs 5% faster than true time. If the local integrator needs to advance 0.1 s, then the<br />
integration actually propagates only 0.095 s of SCLK time forward.<br />
Since the simulation computers provide timers and interrupts to the spacecraft computers, simulation can be<br />
accelerated while maintaining real-time accuracy. Real-time execution of the entire formation is scaled by<br />
appropriately scaling the pulse per second (PPS) in the Time Coordinator. Note that all real-time deadlines<br />
are still enforced; only the entire schedule has been compressed. Formation-flying maneuvers will often<br />
require hours to execute; we have been able to compress the nominal 1-Hz control cycle rate of FACS by<br />
up to a factor of 32. This capability has significantly increased the usability of FAST.<br />
Formation Software<br />
The FAST was developed using a process similar to what might be found on a flight project. The top-level<br />
software architecture has four components.<br />
186<br />
1) Ground console for commanding the formation and receiving telemetry;<br />
2) Simulation.<br />
3) Flight-like software component of FAST consists of the Formation and Attitude Control System<br />
(FACS); and<br />
4) Software Executive (SE).<br />
The use of the shared memory interface between the SE and the simulation environment is controlled by an<br />
interface specification, allowing different formation control systems to be designed, coded, and tested.<br />
The FACS includes (i) a mode commander block with supervisory logic for coordinating high-level<br />
functions such as detumbling and formation acquisition, (ii) a guidance block providing constrained<br />
attitude and formation path-planning and collision avoidance, (iii) a formation and attitude estimator block,<br />
(iv) an attitude and formation controller block using a leader/follower architecture and providing a<br />
synchronized actuation capability for disturbance reduction, and (v) a thruster allocator to map force and
F ORMATION F LYING A L G O R I T H M D E V E L O P M E N T<br />
torque commands into thruster and reaction wheel commands. The FACS software is the same for all<br />
spacecraft, and so any spacecraft can assume the role of leader in the formation-control architecture.<br />
The FAST will be validated by simulating FCT formation scenarios. The FACS residing on the FCT robots<br />
has two additional subsystems, an absolute translation system (ATS) for positioning the robots<br />
independently on the experiment floor, and a formation drift controller (FDC) that keeps the formation<br />
approximately centered on the experiment floor without affecting formation performance. A secondary<br />
mode commander, called the FCT-FACS MDC, coordinates these additional subsystems. The ATS uses<br />
raw sensor data, and so it does not require an estimator.<br />
The Software Executive (SE) provides a flight-like environment for execution of the FACS and is designed<br />
to support a wide variety of formation-control architectures and algorithms. The SE provides commanding,<br />
telemetry handling, device-level communication, inter-spacecraft communication, and scheduling within<br />
the real-time VxWorks operating system. A TCL command interpreter functions as the command<br />
executive. The formation-control algorithms are also commanded via TCL commands. These commands<br />
are simple to implement, and we have found that adding new commands can be done in less than an hour.<br />
Telemetry is available in ASCII or binary format, and the process for generating telemetry has been<br />
automated in Matlab. In addition, telemetry identifiers, telemetry generation, telemetry decoding, and<br />
telemetry display code are all automatically coded from a telemetry specification written in a standard<br />
spreadsheet tool. We are able to automatically code the memory map describing the interface between the<br />
simulation and the VxWorks hardware boards, again based on a spreadsheet specification. The auto-coding<br />
tools were written in Java.<br />
Two crucial services provided by the SE are spacecraft-to-spacecraft clock offset estimation and controlcycle<br />
synchronization. Clock offsets are necessary for formation estimation. Control-cycle synchronization,<br />
which is the process of making control cycles on separate spacecraft start at the same true time, is required<br />
for the highest precision formation control. By using time echo packets similar to NTP, the SE Time<br />
Manager determines the clock offsets between spacecraft. Then, each spacecraft communicates the time at<br />
which its most recent control cycle started. With this data the SEs determine the amount to lengthen their<br />
control cycles. No shortening is allowed. The SEs then command their SCLKs to appropriately delay the<br />
next control-cycle interrupt to bring all the control cycles into synchronization. For example, if control<br />
cycles are 1 s in duration and SC1’s control cycle starts 100 ms before SC2, then the SE on SC1 would<br />
command the SCLK to send the next control cycle interrupt in 1.1 s. A refined version of this basic scheme<br />
has been implemented wherein the control cycles are resynchronized periodically. In steady state with no<br />
additional SCLK drift added to the inherent processor clock drift, cycle shifts are on the order of a few<br />
milliseconds.<br />
The SE also hosts the ISC manager. Currently, a time division multiple access (TDMA) architecture is<br />
implemented for sharing the wireless link between the ISC, the console uplink and downlink, the time-echo<br />
packets, and the control cycle synchronization messages. Existing communication protocols (such as TCP<br />
and user datagram protocol (UDP)) are not satisfactory since TCP can disrupt real-time performance<br />
through continual packet resends, and UDP is not robust to packet drops. A new protocol was developed<br />
called real-time UDP that adds timeouts and a limit to packet resends.<br />
187
A PPENDIX C<br />
References<br />
Cohen, S., and Hindmarsh, A., “CVODE, a Stiff/Nonstiff ODE Solver in C,” Computers in Physics 10 (2),<br />
138–143 (1996).<br />
Jain, A., and Rodriguez, G., “Recursive Flexible Multibody System Dynamics Using Spatial Operators,”<br />
Journal of Guidance, Control and Dynamics 15, 1453–1466 (1992).<br />
Lay, O. P., and Blackwood, G. H., “Formation-Flying Interferometry,” Interferometry in Space, edited by<br />
M. Shao, Proc. SPIE 4852, 481–491 (2003).<br />
Lurie, B., “Multi-Mode Synchronized Control for Formation Flying Interferometer ,” AIAA Guidance,<br />
Navigation, and Control Conference, Austin, TX, 11–14 August 2003, paper 5365 (2003).<br />
Martin, B. J., and Sohl, G. A., “HYDRA: High-Speed Simulation Architecture for Precision Spacecraft<br />
Formation Simulation,” AIAA Modeling and Simulation Technologies Conf., Austin, TX, 11–14<br />
August, paper 5380 (2003).<br />
Ploen, S. R., Scharf, D. P., Hadaegh, F. Y., and Bikdash, M., “Guaranteed Initialization of Distributed<br />
Spacecraft Formations,” Journal of the Astronautical Sciences 52 (4), 495–515 (2004).<br />
Scharf, D. P., Acikmese, A. B., Ploen, S. R., and Hadaegh, F. Y., “A Direct Solution for Fuel-Optimal<br />
Reactive Collision Avoidance of Collaborating Spacecraft,” American Control Conference,<br />
Minneapolis, MN, 14–16 June (2006).<br />
Scharf, D. P., Hadaegh. F. Y. and Kang, B. H., “On the Validity of the Double Integrator Approximation in<br />
Deep Space Formation Flying,” First International Symposium on Formation Flying Missions and<br />
Technologies, Centre National d’Etudes Spatiales, Toulouse, France, (Oct. 29–30, 2002).<br />
Scharf, D. P., Hadaegh, F. Y., Rahman, Z. R., Shields, J. H., Singh, G., and Wette, M. R., “An Overview of<br />
the Formation and Attitude Control System for the Terrestrial Planet Finder Formation Flying<br />
Interferometer,” 2nd International Symposium on Formation Flying Missions and Technologies,<br />
Washington, D.C. (September 2004).<br />
Scharf, D. P., Ploen, S. R., Hadaegh, F. Y., and Sohl, G. A., “Guaranteed Spatial Initialization of<br />
Distributed Spacecraft Formations,” AIAA Guidance, Navigation and Control Conference,<br />
Providence, RI, 16–19 August 2004, paper 4893 (2004).<br />
Singh, G., and Hadaegh, F. Y., “Collision Avoidance Guidance for Formation-Flying Applications,” AIAA<br />
Guidance, Navigation, and Control Conference, Montreal, PQ, 6–9 August, paper 4088 (2001).<br />
Sohl, G. A., Udomkesmalee, S., and Kellogg, J. L., “Distributed Simulation for Formation Flying<br />
Applications,” AIAA Modeling and Simulation Technologies Conference, San Francisco, CA,<br />
15–18 August 2005, paper 6494 (2005).<br />
188
A C R O N Y M S<br />
Appendix D<br />
Acronyms<br />
ACS<br />
AdN<br />
ADP<br />
AFF<br />
AGB<br />
AgCl<br />
AGN<br />
ALMA<br />
ANT<br />
AO<br />
Ar<br />
ARR<br />
ASO<br />
ATLO<br />
ATS<br />
AU<br />
BC<br />
BL<br />
BOL<br />
Attitude Control System<br />
Adaptive Nuller Testbed<br />
acceleration data processing (algorithm)<br />
autonomous formation flying<br />
asymptotic giant branch<br />
silver chloride<br />
Active Galactic Nucleus (or Nuclei)<br />
Atacama Large Millimeter Array<br />
Achromatic Nulling Testbed<br />
adaptive optics<br />
argon<br />
Assembly Readiness Review<br />
Astronomical Search for Origins<br />
Assembly, Test, and Launch Operations<br />
absolute translation system<br />
astronomical unit; approximately the mean distance between the Earth and the Sun<br />
beam combiner<br />
baseline<br />
beginning of life<br />
CAC collision-avoidance constraint<br />
CCD charged couple device<br />
CCl 2 F 2 freon 13<br />
CCL 3 F freon 12<br />
CDR Critical Design Review<br />
CG<br />
center-of-gravity<br />
CH 3 Cl methyl chloride<br />
CH 4 methane<br />
CIRS Composite Infrared Spectrometer (on the Cassini mission)<br />
CM<br />
center of mass<br />
CMC center-of-mass to center-of-mass (relative position)<br />
CNES Centre National d’Etudes Spatiales<br />
CO 2 carbon dioxide<br />
CoRoT Convection Rotation and Planetary Transits (CNES, France)<br />
CTE coefficient of thermal expansion<br />
DAC<br />
DARTS<br />
degenerate Angel cross<br />
Dynamics Algorithms for Real-Time Simulation<br />
189
A PPENDIX D<br />
DC<br />
DCB<br />
DM<br />
DM<br />
DOCS<br />
DOD<br />
DOF<br />
DST<br />
EIRB<br />
ELT<br />
EM<br />
EMFF<br />
EOL<br />
ESA<br />
ESTEC<br />
ExNPS<br />
EZ<br />
FACS<br />
FAST<br />
FCT<br />
FDC<br />
FDDS<br />
FF<br />
FFI<br />
FGS<br />
FFTL<br />
FIRES<br />
FIT<br />
FOR<br />
FOV<br />
FST<br />
FTS<br />
FWHM<br />
FY<br />
GAC<br />
G&C<br />
GPS<br />
GSFC<br />
H 2<br />
H II<br />
HST<br />
H 2 O<br />
HQ<br />
H 2 S<br />
HYDRA<br />
HZ<br />
Hz<br />
190<br />
direct current<br />
dual chopped Bracewell<br />
development model<br />
deformable mirror<br />
Dynamics Optics Controls Structures<br />
Department of Defense<br />
degrees of freedom<br />
Distributed Spacecraft Technologies<br />
External Independent Readiness Board<br />
Extremely Large Telescope (approximately 30-m diameter or larger aperture)<br />
engineering model<br />
electromagnetic formation flying<br />
end of life<br />
European Space Agency<br />
European Space Research and Technology Centre<br />
<strong>Exploration</strong> of Neighboring Planetary Systems<br />
Exozodiacal (dust emission)<br />
Formation & Attitude Control System software<br />
Formation Algorithms and Simulation Testbed<br />
Formation Control Testbed<br />
formation drift controller<br />
Formation Dynamics and Devices Simulation software<br />
formation flying<br />
formation-flying interferometer<br />
Fine Guidance Sensor<br />
Formation Flying Technology Laboratory<br />
Faint Infra Red Extra-galactic Survey<br />
Formation Interferometer Testbed<br />
field of regard<br />
field of view<br />
Formation Sensor Testbed<br />
Fourier-transform spectrometer<br />
full width at half maximum<br />
fiscal year<br />
generalized Angel cross<br />
guidance and control<br />
Global Positioning System<br />
Goddard Space Flight Center<br />
hydrogen<br />
ionized hydrogen (regions)<br />
Hubble Space Telescope<br />
water<br />
Headquarters<br />
hydrogen sulfide<br />
Hierarchical Distributed Re-configurable Architecture<br />
Habitable Zone<br />
hertz
A C R O N Y M S<br />
IHZ<br />
IMF<br />
IMOS<br />
IMU<br />
IO<br />
IPM<br />
IR<br />
IRAC<br />
IRAS<br />
IRS<br />
ISAMS<br />
ISAAC<br />
ISC<br />
ISM<br />
ISO<br />
I&T<br />
IWA<br />
JCMT<br />
JPL<br />
J-T<br />
JWST<br />
kHz<br />
KI<br />
L2<br />
LAMP<br />
LADAR<br />
LAN<br />
LBT<br />
LBTI<br />
LBV<br />
LISA<br />
LMC<br />
LRR<br />
mas<br />
MACHO<br />
MDC<br />
MATLAB<br />
MIPS<br />
MIR<br />
MIRI<br />
MIT<br />
MiXI<br />
M Ju<br />
MMZ<br />
MS<br />
M ⊕<br />
Inner Habitable Zone<br />
initial mass function<br />
Integrated Modeling of Optical Systems<br />
inertial measurement unit<br />
integrated optics<br />
Interferometer Performance Model<br />
infrared<br />
Infrared Array Camera (on Spitzer Telescope)<br />
Infrared Astronomical Satellite<br />
infrared spectrograph (on Spitzer Space Telescope<br />
Improved Stratospheric and Mesospheric Sounder<br />
Infrared Spectrometer and Array Camera<br />
inter-spacecraft communication<br />
interstellar medium<br />
Infrared Space Observatory<br />
integration and test<br />
inner working angle<br />
James Clerk Maxwell Telescope<br />
Jet Propulsion Laboratory<br />
Joule-Thomson<br />
James Webb Space Telescope<br />
kilohertz (1000 Hz)<br />
Keck Interferometer<br />
Sun-Earth Lagrange-2 point<br />
Laser-Augmented Mobility Power<br />
laser detection and ranging<br />
local-area network<br />
Large Binocular Telescope<br />
Large Binocular Telescope Interferometer<br />
Luminous Blue Variable<br />
Laser Interferometer Space Antenna<br />
Large Magellanic Cloud<br />
Launch Readiness Review<br />
milli-arcsecond<br />
massive astronomical compact halo object<br />
mode commander<br />
Matrix Laboratory<br />
Multiband Imaging Photometer for SIRTF<br />
mid-infrared<br />
Mid-Infrared Instrument (for JWST)<br />
Massachusetts Institute of Technology<br />
Miniature Xenon Ion thruster<br />
Jupiter mass<br />
Modified Mach-Zehnder (design)<br />
main sequence (stars)<br />
Earth mass<br />
191
A PPENDIX D<br />
NaCl<br />
NAR<br />
<strong>NASA</strong><br />
NASTRAN<br />
Ne<br />
NGST<br />
NICMOS<br />
nm<br />
N 2 O<br />
NRA<br />
NRL<br />
NTP<br />
sodium chloride<br />
Non-Advocate Review<br />
National Aeronautics and Space Administration<br />
<strong>NASA</strong> Structural Analysis <strong>Program</strong><br />
neon<br />
Northrop Grumman Space Technology<br />
Near Infrared Camera and Multi-Object Spectrometer<br />
nanometer (10 -9 meters)<br />
nitrous oxide<br />
<strong>NASA</strong> Research Announcement<br />
Naval Research Laboratory<br />
Network Time Protocol<br />
O 2<br />
O 3<br />
oxygen<br />
ozone<br />
OB association association of spectral class O and B stars<br />
ObSim Observatory Simulation model<br />
OPD optical path difference<br />
OASES Outpost for the Analysis and Spectroscopy of <strong>Exoplanet</strong>ary Systems<br />
OPD optical path difference<br />
OWA outer working angle<br />
PAH<br />
PAL<br />
pc<br />
PCI<br />
PDR<br />
PDT<br />
PI<br />
PMSR<br />
POP<br />
ppb<br />
PPS<br />
PRIMA<br />
PSD<br />
PSE<br />
PSF<br />
PSR<br />
P-V<br />
QE<br />
R&A<br />
RCS<br />
RF<br />
RFI<br />
RFP<br />
RMS, rms<br />
R/T<br />
RTC<br />
192<br />
polycyclic aromatic hydrocarbons<br />
present atmospheric level<br />
parsec (3.259 light-years, or 30.83 × 10 12 km)<br />
peripheral communications interconnect local bus<br />
Preliminary Design Review<br />
Planet Detection Testbed<br />
principal investigator<br />
Preliminary Mission Systems Review<br />
<strong>Program</strong> Operating Plan<br />
parts per billion<br />
pulse per second<br />
Phase-Referenced Imaging and Micro-arcsecond Astrometry<br />
power spectral density<br />
planetary signal extraction<br />
point spread function<br />
Pre-Ship Review<br />
peak to valley<br />
quantum efficiency<br />
research and analysis<br />
Reaction Control System<br />
radio frequency<br />
Request For Information<br />
Request for Proposal<br />
root mean-square<br />
near reflection/transmission (ratio)<br />
relative thermal constraint
A C R O N Y M S<br />
RWA<br />
S<br />
SAC<br />
SBIR<br />
SCI<br />
SCI<br />
SCLKs<br />
SCUBA<br />
SE<br />
Si:As<br />
SiC<br />
SIRTF<br />
SIM<br />
S/N<br />
SNR<br />
SPIE<br />
<strong>SWG</strong><br />
TAU<br />
TCL<br />
TCP/IP<br />
TDMA<br />
TMA<br />
TOM<br />
TOO<br />
<strong>TPF</strong><br />
<strong>TPF</strong>-C<br />
<strong>TPF</strong>-I<br />
TRL<br />
TRP<br />
TSC<br />
UA<br />
UDP<br />
u-v<br />
VLA<br />
VLT<br />
V&V<br />
WFE<br />
WFS<br />
WFS&C<br />
WIIT<br />
YSO<br />
reaction wheel assembly<br />
sulfur<br />
Sun-avoidance constraint<br />
Small Business Innovative Research<br />
structurally connected interferometer<br />
Scalable Coherent Interface (protocol)<br />
simulation of local spacecraft clocks<br />
Submillimetre Common-User Bolometer Array (on the JCMT in Hawaii)<br />
Software Executive<br />
silicon:arsenic<br />
silicon carbide<br />
Space Infrared Telescope Facility (now Spitzer Space Telescope)<br />
Space Interferometry Mission<br />
signal-to-noise ratio<br />
signal-to-noise ratio<br />
International Society for Optical Engineering<br />
Science Working Group<br />
Tel Aviv University<br />
Tool Command Language<br />
transmission control protocol/internet protocol<br />
time division multiple access<br />
tertiary mirror assembly<br />
thermo-optical mechanical<br />
target of opportunity<br />
Terrestrial Planet Finder<br />
Terrestrial Planet Finder Coronagraph<br />
Terrestrial Planet Finder Interferometer<br />
technology readiness level<br />
Technology Review Panel<br />
thruster synchronization constraint<br />
University of Arizona<br />
user datagram protocol<br />
spatial frequency coordinates, in wavelengths<br />
Very Large Array, National Radio Astronomy Observatory<br />
Very Large Telescope, European Southern Observatory<br />
verification and validation<br />
wavefront error<br />
wavefront sensor<br />
wavefront sensing and control<br />
Wide-field Imaging Interferometry Testbed<br />
young stellar objects<br />
193
A PPENDIX E<br />
Appendix E<br />
<strong>TPF</strong>-I Review Papers<br />
The following publications provide a broad overview of progress with technology development for <strong>TPF</strong>-I<br />
since 2002. The papers are listed in reverse chronological order.<br />
Lawson, P. R., Ahmed, A., Gappinger, R. O., Ksendzov, A., Lay, O. P., Martin, S. R., Peters, R. D., Scharf,<br />
D. P., Wallace, J. K., and Ware, B., “Terrestrial Planet Finder Interferometer: Technology status<br />
and plans,” Advances in Stellar Interferometry, Proc. SPIE 6268, edited by J. D. Monnier, M.<br />
Schöller, and W. C. Danchi, 626828 (2006).<br />
Beichman, C., Lawson, P., Lay, O., Ahmed, A., Unwin, S., Johnston, K., “Status of the Terrestrial Planet<br />
Finder Interferometer,” Advances in Stellar Interferometry, Proc. SPIE 6268, edited by J. D.<br />
Monnier, M. Schöller, and W. C. Danchi, 62680S (2006).<br />
Henry, C., “Terrestrial Planet Finder Interferometer 2005: Overview of system design studies and<br />
technology development,” in Techniques and Instrumentation for Detection of <strong>Exoplanet</strong>s II, edited<br />
by D. R. Coulter, Proc. SPIE 5905, 1–7 (2005).<br />
Henry, C., Lay, O. P., Aung, M., Gunter, S. M., Dubovitsky, S., and Blackwood, G. H., “Terrestrial Planet<br />
Finder interferometer: Architecture, mission design, and technology development,” New Frontiers<br />
in Stellar Interferometry, Proc. SPIE 5491, edited by W. A. Traub, 265–274 (2004).<br />
Blackwood, G. H., Serabyn, E., Dubovitsky, S., Aung, M., Gunter, S. M., Henry, C., “System design and<br />
technology development for the Terrestrial Planet Finder infrared interferometer,” Techniques and<br />
Instrumentation for Detection of <strong>Exoplanet</strong>s, Proc. SPIE 5170, edited by D. R. Coulter, 129-143<br />
(2003).<br />
Beichman, C. A., Coulter, D. R., Lindensmith, C., Lawson, P. R., “Selected mission architectures for the<br />
Terrestrial Planet Finder (<strong>TPF</strong>): Large, Medium, and Small,” Future Research Direction and<br />
Visions for Astronomy, Proc. SPIE 4835, edited by A. M. Dressler, 115–121 (2002).<br />
194
C ONTRIBUTORS AND C REDITS<br />
Appendix F<br />
Contributors and Credits<br />
The editors are grateful to the individuals who were responsible for specific chapters, as listed below.<br />
Introduction<br />
Charles Beichman, California Institute of Technology<br />
Kenneth J. Johnston, U.S. Naval Observatory<br />
Peter R. Lawson, Jet Propulsion Laboratory<br />
Oliver P. Lay, Jet Propulsion Laboratory<br />
<strong>Exoplanet</strong> Science<br />
Charles A. Beichman, California Institute of Technology<br />
Kenneth J. Johnston, U.S. Naval Observatory<br />
John Bally, University of Colorado<br />
David Crisp, Jet Propulsion Laboratory<br />
Lisa Kaltenegger, Smithsonian Astrophysical Observatory<br />
Peter R. Lawson, Jet Propulsion Laboratory<br />
Oliver P. Lay, Jet Propulsion Laboratory<br />
Huub Röttgering, University of Leiden<br />
Eugene Serabyn, Jet Propulsion Laboratory<br />
Transforming Astrophysics with <strong>TPF</strong>-I<br />
John Bally, University of Colorado<br />
Huub Röttgering, University of Leiden<br />
Charles Beichman, California Institute of Technology<br />
Maria-Rosa Cioni, University of Edinburgh, UK<br />
Malcolm Fridlund, European Space Agency<br />
Roland den Hartogg, European Space Agency<br />
Jan-Willem den Herder, Space Research Organization Netherlands<br />
M. Hoogerheijde, University of Leiden<br />
Ivo Labbé, Carnegie Observatories, Pasadena<br />
Oliver Lay, Jet Propulsion Laboratory<br />
Réne Liseau, Stockholm University<br />
195
A PPENDIX F<br />
Alice Quillen, University of Rochester<br />
Stephen Serjeant, The Open University, Milton Keynes, UK<br />
C. P. de Vries, Space Research Organization Netherlands<br />
Rachel Webster, Michelson Science Center<br />
Design and Architecture Trade Studies<br />
Oliver P. Lay, Jet Propulsion Laboratory<br />
Stefan Martin, Jet Propulsion Laboratory<br />
Benjamin Lane, Massachusetts Institute of Technology<br />
Kenneth Marsh, Jet Propulsion Laboratory<br />
Charley Noecker, Ball Aerospace<br />
Eugene Serabyn, Jet Propulsion Laboratory<br />
Velu Velusamy, Jet Propulsion Laboratory<br />
Brent Ware, Jet Propulsion Laboratory<br />
<strong>TPF</strong>-I Flight Baseline Design<br />
Stefan Martin, Jet Propulsion Laboratory<br />
Oliver P. Lay, Jet Propulsion Laboratory<br />
Sarah Hunyadi, Jet Propulsion Laboratory<br />
Technology Roadmap for <strong>TPF</strong>-I (Nulling Interferometry)<br />
Peter R. Lawson, Jet Propulsion Laboratory<br />
Robert Gappinger, Jet Propulsion Laboratory<br />
Alexander Ksendzov, Jet Propulsion Laboratory<br />
Oliver P. Lay, Jet Propulsion Laboratory<br />
Stefan Martin, Jet Propulsion Laboratory<br />
Robert Peters, Jet Propulsion Laboratory<br />
Technology Roadmap for <strong>TPF</strong>-I (Formation Flying)<br />
Asif Ahmed, Jet Propulsion Laboratory<br />
Matt Wette, Jet Propulsion Laboratory<br />
Dan Scharf, Jet Propulsion Laboratory<br />
Behcet Acikmese, Jet Propulsion Laboratory<br />
Eddie Benowitz , Jet Propulsion Laboratory<br />
Chuck Bergh, Jet Propulsion Laboratory<br />
Allan Eisenman, Jet Propulsion Laboratory<br />
Jason Keim, Jet Propulsion Laboratory<br />
Arin Morfopolous, Jet Propulsion Laboratory<br />
Joel Shields, Jet Propulsion Laboratory<br />
Guru Singh, Jet Propulsion Laboratory<br />
196
C ONTRIBUTORS AND C REDITS<br />
Technology Roadmap for <strong>TPF</strong>-I (Future Developments)<br />
William C. Danchi, Goddard Space Flight Center<br />
Peter R. Lawson, Jet Propulsion Laboratory<br />
David Leisowitz, Goddard Space Flight Center<br />
John Monnier, University of Michigan<br />
Stephen C. Unwin, Jet Propulsion Laboratory<br />
Discussion and Conclusion<br />
Charles Beichman, California Institute of Technology<br />
Kenneth J. Johnston, U.S. Naval Observatory<br />
Copyright Permissions<br />
Figure 2-1 – Figure by W. A. Traub and K. W. Jucks. Reprinted, by permission of the American<br />
Geophysical Union, from Atmospheres in the Solar System: Comparative Aeronomy (2002).<br />
Figure 2-2 – Figure by L. Kaltenegger et al. Reprinted, by permission of the American Astronomical<br />
Society, from Astrophysical Journal (2007), in press.<br />
Figure 2-3 – Figure by Giovanna Tinetti (Institut d’Astrophysique de Paris) for this publication.<br />
Figure 2-4 – Figure by L. Kaltenegger et al. Reprinted, by permission of the American Astronomical<br />
Society, from Astrophysical Journal (2007), in press.<br />
Figure 2-5 – Figure by A. Segura et al. Reprinted, by permission of the publisher, from Astrobiology<br />
3, 689–708 (2003).<br />
Figure 2-6 – Figure by L. Kaltenegger et al. Reprinted, by permission of the American Astronomical<br />
Society, from Astrophysical Journal (2007), in press.<br />
Figure 2-8 – Figure by C. A. Beichman et al. Reprinted, by permission of the American Astronomical<br />
Society, from Astrophysical Journal 652, 1674–1693 (2006).<br />
Figure 2-10 – Figure by C. A. Beichman et al. Reprinted, by permission of the American<br />
Astronomical Society, from Astrophysical Journal 639, 1166–1176 (2006).<br />
Figure 2-11 – Figure by G. Bryden et al. Reprinted, by permission of the American Astronomical<br />
Society, from Astrophysical Journal 636, 1098–1113 (2006).<br />
Figure 2-12. – Figure by M. C. Wyatt et al. Reprinted, by permission of the American Astronomical<br />
Society, from Astrophysical Journal (2007), in press.<br />
197
A PPENDIX F<br />
Figure 3-1 – Original figure from the article “Protostars,” by Thomas Greene American Scientist 89<br />
(4) 316 (2001), used by permission of the publisher.<br />
Figure 3-3 – Original by Dejan Vinkovic (Institute for Advanced Study), used with permission.<br />
Figure 3-3 – Original by Lucio Mayer (ETH Zürich), used by permission.<br />
Figure 3-5 – Figure by M. J. Reid and K. M. Menten. Reprinted, by permission of the American<br />
Astronomical Society, from Astrophysical Journal 476, 327–346 (1997).<br />
Figure 3-6 – Figure by A. M. Ghez et al. Reprinted, by permission of the American Astronomical<br />
Society, from Astrophysical Journal 620, 744–757 (2005).<br />
Figure 3-7 – Original by Huub Röttgering (Leiden Observatory), for this publication.<br />
Figure 3-8 – Figure by H. Röttgering et al. Reprinted by permission of the European Space Agency,<br />
from ESA SP-539, Towards Other Earths: Darwin/<strong>TPF</strong> and the Search for Extrasolar Planets,<br />
pp. 299–308 (2003).<br />
Figure 3-9 – Original by Huub Röttgering (Leiden Observatory), for this publication.<br />
Figure 3-10 – Original by Eugene Serabyn (JPL), for this publication.<br />
Figure 4-14 – Figure by P. Haguenauer and E. Serabyn. Reprinted, by permission of the Optical<br />
Society of America, from Applied Optics 45, 2749–2754 (2006).<br />
Figure 4-16 – Figure by B. Mennesson et al. (2006), Jet Propulsion Laboratory<br />
Figure 4-20 – Figure by B. F. Lane, M. W. Muterspaugh, and M. Shao. Reprinted, by permission of<br />
the American Astronomical Society, from Astrophysical Journal 648, 1276–1284 (2006).<br />
Figure 4-21 – Figure by B. F. Lane, M. W. Muterspaugh, and M. Shao. Reprinted, by permission of<br />
the American Astronomical Society, from Astrophysical Journal 648, 1276–1284 (2006).<br />
Figure 5-26 – Original by R. L. Akeson (Caltech), for this publication.<br />
198