Theory of General Competitive Equilibrium and Optimization Models ...
Theory of General Competitive Equilibrium and Optimization Models ...
Theory of General Competitive Equilibrium and Optimization Models ...

Create successful ePaper yourself
Turn your PDF publications into a flip-book with our unique Google optimized e-Paper software.
<strong>Theory</strong> <strong>of</strong> <strong>General</strong> <strong>Competitive</strong> <strong>Equilibrium</strong> <strong>and</strong><br />
<strong>Optimization</strong> <strong>Models</strong> <strong>of</strong> the Consumption <strong>and</strong><br />
Production<br />
Andras Sagi, Ph.D. * <strong>and</strong> Eva Pataki, Ph.D. **<br />
*<br />
Full Pr<strong>of</strong>essor, The Faculty <strong>of</strong> Economics, Subotica, Novi Sad University, Serbia<br />
**<br />
Assistant Pr<strong>of</strong>essor at the Polytechnic Engineering College, Subotica, Serbia<br />
peva@vts.su.ac.rs<br />
Abstract— the work deals with the comparative <strong>and</strong> critical<br />
analysis <strong>of</strong> macroeconomic aspects <strong>of</strong> general equilibrium<br />
theory. It is about the problem <strong>of</strong> general equilibrium in<br />
production, general equilibrium in exchange <strong>and</strong> the<br />
problems <strong>of</strong> simultaneous equilibrium in production <strong>and</strong><br />
exchange. The research <strong>of</strong> cited problems contributes to a<br />
better underst<strong>and</strong>ing the complete economic mechanisms.<br />
Besides, general equilibrium model represents the basis for<br />
considering welfare economics <strong>and</strong> the optimization theory<br />
<strong>of</strong> contemporary market economies.<br />
Key words: partial equilibrium, general equilibrium, contract<br />
curves, Pareto optimum, transformation curve in production<br />
I. INTRODUCTION<br />
Most microeconomic models analyze equilibrium states<br />
<strong>of</strong> individual partial markets. Such market in these<br />
analyses is considered as an independent system, isolated<br />
<strong>and</strong> independent <strong>of</strong> the whole economy. This partial<br />
analysis enables perception <strong>of</strong> optimization in firm<br />
behavior <strong>and</strong> creating partial equilibria. A partial analysis,<br />
however, has necessarily its limits. It does not give<br />
satisfying answers to numerous fundamental questions.<br />
The basic shortage <strong>of</strong> partial analysis models is the same;<br />
it does not explain functions <strong>of</strong> the connected system <strong>of</strong><br />
partial markets, i.e. the whole economy. Therefore,<br />
connecting models <strong>of</strong> analyzing partial markets <strong>and</strong><br />
models <strong>of</strong> general economic equilibrium represent<br />
completing <strong>and</strong> connecting contemporary microeconomic<br />
analyses into a unit system.<br />
The theory <strong>of</strong> general economic analysis, except its<br />
complexity <strong>and</strong> difficulties in practical implementation,<br />
gives invaluable benefits in the domain <strong>of</strong> analyzing<br />
efficiency <strong>and</strong> welfare in microeconomic researches <strong>and</strong><br />
<strong>of</strong>fering great support in macroeconomic modeling. The<br />
subject <strong>of</strong> this work is just the comparative <strong>and</strong> critical<br />
analysis <strong>of</strong> microeconomic aspects <strong>of</strong> fundamental<br />
questions <strong>of</strong> the general competitive equilibrium.<br />
Introducing problems <strong>of</strong> general equilibrium into<br />
economy is connected with physiocrats. We find it in the<br />
F. Quesnay's Tableau Economique in 1758, <strong>and</strong> partly in<br />
Turgot’s work. The role <strong>of</strong> market mechanisms in creating<br />
equilibrium by means <strong>of</strong> competition, i.e. the “invisible<br />
h<strong>and</strong>” <strong>of</strong> market we find in A. Smith’s teachings. K. Marx<br />
brilliantly explained the effects <strong>of</strong> mechanisms <strong>of</strong> the law<br />
<strong>of</strong> value. In his works, we find the laws <strong>of</strong> stable rate <strong>of</strong><br />
reproduction <strong>and</strong> exp<strong>and</strong>ed social reproduction, which, in<br />
principle, explain the possibilities <strong>of</strong> dynamic <strong>and</strong><br />
balanced economic growth.<br />
Nevertheless, the first developed general equilibrium<br />
theory we find with the representatives <strong>of</strong> the Lausanne<br />
School <strong>of</strong> the Marginalist theory in the works by L.<br />
Walras <strong>and</strong> V. Pareto in the second part <strong>of</strong> the 19th<br />
century. Further contributions to development <strong>of</strong> this<br />
theory were the input-output analysis by Wassily Leontief,<br />
whose theory, according to many authors, is based on<br />
Marx’s schemes <strong>of</strong> social reproduction. Kenneth Arrow,<br />
F. Hahn [8] <strong>and</strong> G. Debreu [6] founded contemporary<br />
neoclassical theory <strong>of</strong> general equilibrium on their works.<br />
To underst<strong>and</strong> better general equilibrium theory,<br />
Schumpeter’s teaching are important, who, beside partial<br />
<strong>and</strong> general equilibrium, differentiates the so-called<br />
aggregate equilibrium. To his opinion, partial equilibrium<br />
is the equilibrium <strong>of</strong> economic spheres. Aggregate<br />
equilibrium is the equilibrium between selected aggregate<br />
quantities (selected in relation to the analysis, which<br />
should be done), while general equilibrium represents the<br />
equilibrium <strong>of</strong> national economy. On the other side, with<br />
A. Pigou, we find differentiated stable, neutral <strong>and</strong><br />
unstable equilibriums.<br />
We should get down to the analysis <strong>of</strong> general<br />
equilibrium as any other analysis in economic theory,<br />
from the row <strong>of</strong> simplified suppositions. We take the<br />
supposition <strong>of</strong> competitive market, pure exchange model,<br />
production equilibrium, <strong>and</strong> then simultaneous<br />
equilibrium is considered.<br />
II. GENERAL EXCHANGE EQUILIBRIUM<br />
In the analysis <strong>of</strong> general equilibrium, theoreticians<br />
Pareto, Edgeworth, Walras <strong>and</strong> others start from<br />
researching the so-called general exchange equilibrium,<br />
i.e. in the this analysis, they firstly abstract money, i.e.<br />
commodity prices. <strong>Equilibrium</strong> conditions are explained<br />
starting from the so-called “Edgeworth box” or Edgeworth<br />
diagram. At the beginning, they usually take two people<br />
who exchange two goods. Take A <strong>and</strong> B, <strong>and</strong> goods to be<br />
exchanged are X <strong>and</strong> Y.
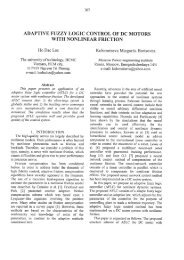
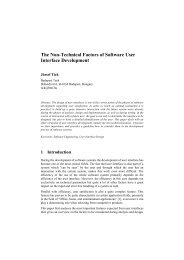
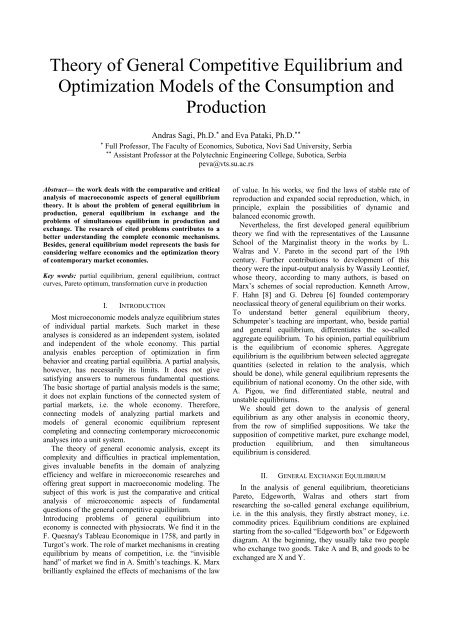
In Figure 1, in relation to the ordinate OA several<br />
curves <strong>of</strong> indifference (line <strong>of</strong> equal utility) <strong>of</strong> participants<br />
in exchange are taken. All the points <strong>of</strong> the curve <strong>of</strong><br />
indifference represents such alternative combinations <strong>of</strong><br />
goods X <strong>and</strong> Y for an individual A giving him the same<br />
level <strong>of</strong> utility. The slope <strong>of</strong> determined indifference curve<br />
expresses the so-called MRS (Marginal Rate <strong>of</strong><br />
Substitution), i.e. marginal rate <strong>of</strong> goods exchange in a<br />
determined point <strong>of</strong> indifference curve, where the utility<br />
level <strong>of</strong> actor A remains unchanged. If some curve <strong>of</strong><br />
indifference is further from the origo, the utility level<br />
representing mutual indifferent combinations, presented<br />
on it, is bigger. For that, the relation can express utility<br />
values represented by indifference curves <strong>of</strong> the individual<br />
A: A3 > A2 > A1.<br />
Y<br />
O A<br />
X<br />
t 1<br />
t 2<br />
t 3<br />
A<br />
E<br />
3<br />
B<br />
G<br />
A 1<br />
2<br />
A 1<br />
B 2<br />
B 3<br />
Figure 1.<br />
The origo B is in the opposite northeast angle <strong>of</strong> the<br />
Edgeworth closed diagram, <strong>and</strong> in relation to it, the<br />
indifference curve <strong>of</strong> Participant B in exchange, i. e. the<br />
curves B3 > B2 > B1. Every <strong>of</strong> them represent numerous<br />
mutually equivalent or indifferent combinations <strong>of</strong> goods<br />
X <strong>and</strong> Y for the individual B. The slope <strong>of</strong> indifference<br />
curve is now MRS but for the trader B.<br />
The exchange <strong>of</strong> goods for individuals is useful, until<br />
they are not on indifference curves, which have not points<br />
<strong>of</strong> contact. The marginal rates <strong>of</strong> goods substitution X <strong>and</strong><br />
Y for exchangers become equal in points <strong>of</strong> contact <strong>of</strong><br />
their indifference curves. As MRS <strong>of</strong> consumption goods<br />
are appropriate to the relations <strong>of</strong> their indifference<br />
curves, it results that exchange is done until marginal<br />
utilities <strong>of</strong> these goods X <strong>and</strong> Y become equal for A <strong>and</strong><br />
B. The row <strong>of</strong> these points represents the general<br />
equilibrium <strong>of</strong> exchange for A <strong>and</strong> B in the observed<br />
model. The geometric set <strong>of</strong> equilibrium points gives the<br />
so-called Edgeworth contract curve, which connects OA<br />
with OB. When participants <strong>of</strong> exchange are in this curve,<br />
they reach the so-called Pareto-optimality in exchange. It<br />
is said that the “distribution is optimal in the Pareto sense<br />
if it is such that every improvement <strong>of</strong> the situation causes<br />
the aggravation <strong>of</strong> other situations.” In other words, some<br />
distribution is Pareto optimal only if there is no possibility<br />
<strong>of</strong> such change, which could improve the situation <strong>of</strong> one<br />
not damaging others. Therefore, every point in the<br />
contract curve represents the Pareto optimality, <strong>and</strong> this<br />
curve is the geometric place in Pareto optimality. The<br />
Pareto optimality was dome in 1896 in the work Cours<br />
d’economie politique. When the ordinary underst<strong>and</strong>ing <strong>of</strong><br />
utility was defined (i.e. not the absolute but the relative<br />
H<br />
X<br />
O B<br />
Y<br />
value or the level <strong>of</strong> utility providing comparative<br />
combinations <strong>of</strong> properties) his work Manuale<br />
d’economica, the policy in 1906, reached its real<br />
importance. In this work, namely, for the first time, the<br />
attitude was defined that maximization <strong>of</strong> aggregate social<br />
utility can be reached with the relations <strong>of</strong> exchange,<br />
when no individual utility can be increased without<br />
decreasing the <strong>of</strong> somebody else’s utility.<br />
In Figure 1, along the Edgeworth contract curve, there are<br />
numerous alternative equilibrium combinations <strong>of</strong><br />
exchange. To make the choice between them, it is<br />
necessary to define the so-called Social Welfare Function<br />
(SWF). To define this function is a very complex task. We<br />
should start from the evaluation <strong>of</strong> values <strong>of</strong> some<br />
situations, evaluation <strong>of</strong> preferences <strong>of</strong> social subjects,<br />
especially those who create economic policy, <strong>and</strong> so on.<br />
However, this task can be solved with some exactness.<br />
Knowing social welfare functions, the Pareto criterion<br />
enables eliminating non-optimal combination in exchange.<br />
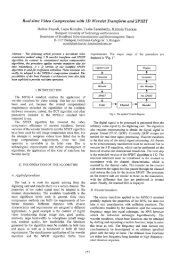
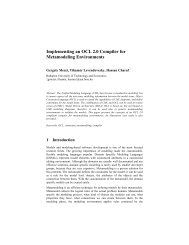
Now, look at Figure 2. Suppose that the initial<br />
distribution X <strong>and</strong> Y between A <strong>and</strong> B is at point N, where<br />
the curves <strong>of</strong> utility <strong>and</strong> indifference A2 <strong>and</strong> B cut, it is<br />
easy to underst<strong>and</strong> that all points for participants in<br />
exchange in the shaded surface represent better<br />
combinations than the ratio <strong>of</strong> exchange expressed by<br />
point N. The shaded area in Diagram is called the “region<br />
<strong>of</strong> mutual advantages”, <strong>and</strong> the interval <strong>of</strong> Edgwort<br />
contract curve between points G <strong>and</strong> H is called the “core<br />
or pith <strong>of</strong> economy” [Stojanovic, 1944].<br />
B 1<br />
B 2<br />
B 3 N B 4<br />
A 4<br />
E<br />
G<br />
O A<br />
X<br />
A 3<br />
A 2<br />
Y<br />
A 1<br />
Figure 2.<br />
Correct definition <strong>of</strong> the position <strong>of</strong> SWF enables the<br />
choice between optimal exchange combinations in the line<br />
between points G <strong>and</strong> H.<br />
Completing general equilibrium in exchange requires the<br />
introduction <strong>of</strong> relative prices <strong>of</strong> properties <strong>and</strong> incomes <strong>of</strong><br />
consumers. Namely, it is generally accepted that<br />
consumers or households as traders try to optimize their<br />
economic position, or, in other words, to maximize their<br />
consumption utility, starting from the following factors:<br />
1. Preference consumers’ system expressed by<br />
indifference functions;<br />
2. Amount <strong>of</strong> money income <strong>of</strong> consumers;<br />
3. Prices <strong>of</strong> individual goods <strong>and</strong> services, P (price),<br />
as the indicator <strong>of</strong> the level <strong>of</strong> social utility <strong>of</strong><br />
goods <strong>and</strong> services.<br />
H<br />
X<br />
OB<br />
Y
In the two-dimensional model <strong>of</strong> consumers’ choice limits<br />
or the so-called budget consumption limitation are<br />
expressed by the so-called line or consumption limit. In<br />
case that the variables <strong>of</strong> money income <strong>of</strong> traders A <strong>and</strong><br />
B are equal in exchange, i.e. IA = IB, <strong>and</strong> prices <strong>of</strong><br />
properties X <strong>and</strong> Y which come in exchange between<br />
them Px <strong>and</strong> Py, the budget limitation <strong>of</strong> consumption for<br />
both exchangers can be expressed by the relation:<br />
IA, B<br />
= X⋅P<br />
+ Y⋅P X Y<br />
whence<br />
(1)<br />
X =<br />
Y =<br />
I<br />
P<br />
X<br />
I<br />
P<br />
Y<br />
P<br />
−<br />
P<br />
X<br />
X<br />
P<br />
−<br />
P<br />
X<br />
Y<br />
⋅ Y<br />
⋅ X<br />
Under the above supposition, the identical budget line<br />
can present the limits <strong>of</strong> consumers’ choice for traders A<br />
<strong>and</strong> B. With unchanged prices <strong>of</strong> goods <strong>and</strong> amount <strong>of</strong><br />
money income, the position <strong>of</strong> budget line remains<br />
unchanged, <strong>and</strong> its slope expresses the relation <strong>of</strong> property<br />
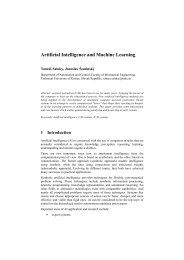
prices, i.e. Px <strong>and</strong> Py. Look now at Figure 3, the<br />
possibilities <strong>of</strong> general equilibrium in exchange, taking<br />
into consideration the amount <strong>of</strong> money income <strong>and</strong> prices<br />
<strong>of</strong> exchanged goods<br />
Figure 3.<br />
In Figure 3, general exchange equilibrium between A<br />
<strong>and</strong> B is at point E on the Egdeworth contract curve. At<br />
this point, namely, we have matching up the slopes <strong>of</strong><br />
indifference curves <strong>of</strong> trader A, on the curve Ae <strong>and</strong> the<br />
slope <strong>of</strong> indifference curve B, the other trader in<br />
exchange. In this point (as in all other points <strong>of</strong> the<br />
contract curve), we have matching up <strong>of</strong> marginal<br />
substitution rates <strong>of</strong> X <strong>and</strong> Y for traders A <strong>and</strong> B.<br />
However, contrary to other points on the contract curve, in<br />
E, the slope <strong>of</strong> their marginal substitution slope, i. e. MRS<br />
(it is in fact the slope <strong>of</strong> tangent in some point) is<br />
matching up with the slope <strong>of</strong> their budget line. The slope<br />
<strong>of</strong> budget line expresses relative prices, in other words, the<br />
relation <strong>of</strong> prices <strong>of</strong> goods in exchange, i.e. X <strong>and</strong> Y. At<br />
the equilibrium point E, the following equalities are valid:<br />
PX<br />
MUX<br />
MRS A(X,Y) = MRSB(X,Y)<br />
= =<br />
PY<br />
MUY<br />
(4)<br />
(MU – Marginal Utility)<br />
At point E, equilibrium goods prices have the same<br />
mutual relations in marginal rate <strong>of</strong> goods substitution, i.e.<br />
MRS is equal for both traders in exchange, <strong>and</strong> at the<br />
(2)<br />
(3)<br />
same time, it is appropriate to relations <strong>of</strong> marginal utility<br />
<strong>of</strong> exchanged goods. It means that the equilibrium point E<br />
is suitable for relation <strong>of</strong> the proportion where supply <strong>and</strong><br />
dem<strong>and</strong> <strong>of</strong> exchanged goods become equal.<br />
Y<br />
I/P x<br />
A 1<br />
I/P y A 2 A3 B<br />
E 1<br />
b2<br />
I/P y1<br />
E b3<br />
B 2<br />
E a3<br />
PCC A<br />
I/P y2<br />
B 3<br />
O A<br />
E<br />
a1<br />
E a2<br />
X<br />
E b1<br />
I/P x1<br />
I/P x2<br />
I/P x3 X<br />
Figure 4.<br />
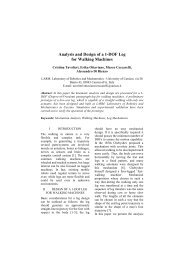
By the combination <strong>of</strong> indifference curves <strong>and</strong> budget<br />
lines we obtain the so-called PCC (Price Consumption<br />
Curve), which show the structure <strong>of</strong> optimal consumer<br />
baskets in case <strong>of</strong> price changes <strong>of</strong> some goods (supposing<br />
that prices <strong>of</strong> other goods, the level <strong>of</strong> money incomes <strong>of</strong><br />
consumers <strong>and</strong> their preference system are steady). In<br />
Figure 4, we presented the curves <strong>of</strong> relations <strong>of</strong> prices<br />
<strong>and</strong> consumption for individuals A <strong>and</strong> B, supposing that<br />
the product price X changes for trader A; for trader B, the<br />
product price Y is changeable. All other relations <strong>and</strong><br />
conditions remain unchangeable.<br />
The curve <strong>of</strong> relations <strong>of</strong> price <strong>and</strong> consumption <strong>of</strong><br />
trader A, i.e. curve PCCA shows that, starting from the<br />
combination <strong>of</strong> goods in point Ea1, which is located along<br />
with the starting position <strong>of</strong> budget line, the trader A is<br />
ready to <strong>of</strong>fer increasing quantity <strong>of</strong> product X for<br />
increasing less quantity <strong>of</strong> product Y. It is done by<br />
gradually price reduction <strong>of</strong> product X presented by<br />
budget lines I/Px2 <strong>and</strong> I/Px3. This trader tries to optimize<br />
his consumer utility in the conditions <strong>of</strong> changed prices.<br />
Contrary to trader A, in northeast angle <strong>of</strong> Diagram,<br />
considering PCCB, i.e. the curve <strong>of</strong> relations <strong>of</strong> price <strong>and</strong><br />
consumptions <strong>of</strong> trader B, we see that the latter trader is<br />
ready to exchange more product Y whose price reduces<br />
for increasingly less quantity <strong>of</strong> product X, in view <strong>of</strong><br />
maximization <strong>of</strong> his consumer utility.<br />
In fact, the curve <strong>of</strong> relations <strong>of</strong> prices <strong>and</strong> consumption <strong>of</strong><br />
the trader A, i. e. PCCA, represents the curve <strong>of</strong> <strong>of</strong>fer A,<br />
i.e. its readiness to change goods X for Y in exchange. On<br />
the other side PCCB, i.e. the curve <strong>of</strong> relations <strong>of</strong> prices<br />
<strong>and</strong> consumption <strong>of</strong> trader B, presents the curve <strong>of</strong> <strong>of</strong>fer<br />
B, i.e. acceptable relation <strong>of</strong> goods exchange X <strong>and</strong> Y for<br />
Individual B, depending on price change <strong>of</strong> product Y.<br />
Traders <strong>of</strong> exchange A <strong>and</strong> B along their <strong>of</strong>fer curves,<br />
starting from points Ea1 <strong>and</strong> Eb1 to points Ea3 <strong>and</strong> Eb3<br />
get to indifference curves which become more distant<br />
from the origos, i.e. which express an increasing level <strong>of</strong><br />
utility for them.<br />
Present, finally, in Figure 5, the curve <strong>of</strong> relations <strong>of</strong><br />
prices <strong>and</strong> consumption <strong>of</strong> both traders, i.e. PCCA <strong>and</strong><br />
PCCB, inside <strong>of</strong> the so-called “region <strong>of</strong> mutual<br />
advantages”, limited by their starting indifference curves<br />
Ae <strong>and</strong> Be.<br />
PCC B<br />
Y<br />
O B<br />
I/P y3
N<br />
PCC B<br />
H<br />
X<br />
OB<br />
Y<br />
N<br />
I x1<br />
I x2<br />
I x3<br />
I x4<br />
L<br />
O Y<br />
K<br />
Y<br />
O A<br />
X<br />
G<br />
Figure 5.<br />
E<br />
PCC A<br />
B e<br />
A e<br />
K<br />
O X<br />
L<br />
F<br />
E<br />
G<br />
I y1<br />
I y4 Iy3<br />
I y2<br />
Figure 6.<br />
We can see the point <strong>of</strong> section <strong>of</strong> supply curves <strong>of</strong><br />
observed traders <strong>of</strong> exchange is on Edgeworth contract<br />
curve <strong>and</strong> inside <strong>of</strong> the core <strong>of</strong> exchange in the interval <strong>of</strong><br />
points G <strong>and</strong> H in point E. It expresses the relations <strong>of</strong><br />
exchange where the product <strong>of</strong>fer <strong>of</strong> the individual A (i.e.<br />
his dem<strong>and</strong> for product Y) <strong>and</strong> product <strong>of</strong>fer by trader B<br />
(i.e. his dem<strong>and</strong> for product X). The general exchange<br />
equilibrium is established in point E – <strong>of</strong> course, in the<br />
simplified model with two traders <strong>and</strong> two products.<br />
However, this model enables to define the general law on<br />
equilibrium <strong>of</strong> exchange in the following sense: general<br />
exchange equilibrium is established with equality <strong>of</strong><br />
marginal substitution rates <strong>of</strong> traders along with equality<br />
<strong>of</strong> supply <strong>and</strong> dem<strong>and</strong> that they present.<br />
The analysis <strong>of</strong> general equilibrium mechanism is<br />
needed to continue by researching the mechanism <strong>of</strong><br />
general production equilibrium.<br />
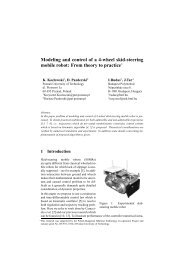
III. GENERAL PRODUCTION EQUILIBRIUM<br />
In analyzing <strong>of</strong> general production equilibrium, we can<br />
take the simplified production model analog to the model<br />
used in the analysis <strong>of</strong> general exchange equilibrium. In<br />
the model, we suppose that a producer makes two<br />
products X <strong>and</strong> Y, with combination <strong>of</strong> only two inputs,<br />
labor <strong>and</strong> capital, i.e. by means <strong>of</strong> L (Labor) <strong>and</strong> C<br />
(Capital). The general production equilibrium is<br />
established when marginal technical rate <strong>of</strong> factor<br />
substitution equalize, i.e. MRTS (Marginal Rate <strong>of</strong><br />
Technical Substitution) for both products. <strong>Equilibrium</strong><br />
can be established on the so-called Edgeworth closed<br />
production box [Kopanyi, 2003], i.e. in Figure 6. The<br />
curves IX1, IX2, IX3 <strong>and</strong> IX4 represent isoquants or the<br />
so-called curves <strong>of</strong> equal product <strong>of</strong> production <strong>of</strong> product<br />
X. Therefore, isoquants IY1, IY2, IY3 <strong>and</strong> IY4 show the<br />
curves <strong>of</strong> equal products for product Y. If the starting<br />
point is point N in the section <strong>of</strong> isoquants IX1 <strong>and</strong> IY3, it<br />
is visible that production maximization X <strong>and</strong> Y is not<br />
realized here, therefore, nor general production<br />
equilibrium. The producer can increase both production X<br />
<strong>and</strong> production Y, i.e. reaches isoquants at the higher<br />
position (i.e. further than the origo) reducing capital<br />
consumption for production X on behalf <strong>of</strong> production Y<br />
<strong>and</strong> conversely, increasing labor consumption in<br />
production X, on behalf <strong>of</strong> consumed labor in production<br />
Y.<br />
With these relations <strong>and</strong> limitations, production<br />
maximization <strong>of</strong> both products is reached in the tangential<br />
point <strong>of</strong> production isoquants X <strong>and</strong> Y, i.e. at point E. In<br />
point E, the curve slopes <strong>of</strong> equal products X <strong>and</strong> Y, i.e.<br />
Ix2 <strong>and</strong> Iy3 are equal, i.e. the marginal technical rates <strong>of</strong><br />
substitution in their production are equalized. Thence,<br />
these relations are valid:<br />
MRTS = MRTS Then (5)<br />
L, K(X)<br />
MP<br />
MRTS L,K =<br />
MP<br />
L<br />
K<br />
L, K(Y)<br />
(MP=Marginal Product) (6)<br />
;<br />
It means that production equilibrium criterion is realized<br />
with the condition<br />
⎛ MPL<br />
⎞ ⎛ MPL<br />
⎞<br />
⎜<br />
MP<br />
⎟ =<br />
⎜<br />
K MP<br />
⎟<br />
⎝ ⎠X<br />
⎝ K ⎠Y<br />
(7)<br />
The point <strong>of</strong> equilibrium is on the so-called Edgewort<br />
contract production curve, which connects origo Ox <strong>and</strong><br />
origo Oy. When production <strong>of</strong> goods is on this curve, it is<br />
not possible any more to increase production <strong>of</strong> one<br />
material product without decreasing production <strong>of</strong> the<br />
other product. On the contract production curve, there are<br />
such combinations <strong>of</strong> production <strong>of</strong> goods, which realize<br />
the so-called Pareto production equilibrium [Pareto,<br />
1971]. In the above analysis <strong>of</strong> production equilibrium,<br />
two marginal rates <strong>of</strong> technical substitution <strong>and</strong> marginal<br />
products <strong>of</strong> observed are taken into consideration, but not<br />
using the price factor.<br />
In further analysis, suppose that the sum <strong>of</strong> engaged<br />
resources (or TC – total costs) is the constant for<br />
production <strong>of</strong> goods X <strong>and</strong> Y. Then, suppose that, with<br />
ceteris paribus, labor price, i.e. PL1 < PL2 < PL3 in<br />
production <strong>of</strong> product X decreases gradually. So, we<br />
obtain isocost lines (lines <strong>of</strong> equal costs) in different<br />
positions for production <strong>of</strong> product X. Connecting<br />
tangential points <strong>of</strong> appropriate isoquants <strong>and</strong> isocost lines<br />
with different labor prices, we obtain the production curve<br />
<strong>of</strong> product X, which expresses the optimal combination <strong>of</strong><br />
input under cited conditions, i.e. the curve Tx.
K<br />
TC/P K<br />
O x<br />
L TC/P O L<br />
y<br />
I y1<br />
I x1 I y2<br />
I C x2 y3<br />
Ix3<br />
TC/P K3<br />
I y3<br />
C y2<br />
T x<br />
TC/P K2<br />
Cx3<br />
C x 2<br />
C x1<br />
C y1<br />
T y<br />
TC/P<br />
L<br />
K1<br />
TC/P K<br />
L3 TC/P L2 TC/P L1<br />
Figure 7.<br />
Hence, it gives the following equality on the contract<br />
production curve:<br />
⎛ MPL<br />
⎞ ⎛ MPL<br />
⎞ PL<br />
⎜<br />
MP<br />
⎟ =<br />
⎜ =<br />
K MP<br />
⎟<br />
⎝ ⎠X<br />
⎝ K ⎠ P<br />
Y K<br />
(9)<br />
These equalities “must exist even when more goods are<br />
made <strong>and</strong> more production factors are used – more than<br />
two” [Stojanovic, 1994].<br />
After all these considerations, we can start to define<br />
general production equilibrium in the sense <strong>of</strong> the Pareto<br />
optimum. In Figure 9, we again draw the amounts <strong>of</strong><br />
products X <strong>and</strong> Y.<br />
Y<br />
T p<br />
L<br />
O Y<br />
K<br />
Y 3<br />
Y 2<br />
F<br />
E<br />
I y<br />
F<br />
G<br />
Y 1<br />
0<br />
K<br />
O X<br />
L<br />
G<br />
I x<br />
Figure 8.<br />
In production <strong>of</strong> product Y, we gradually reduce the<br />
price <strong>of</strong> capital use (PK1 < PK2 < PK3) <strong>and</strong> analog to<br />
logic in production optimization X, we obtain the curve <strong>of</strong><br />
production T whose points show the optimal combination<br />
<strong>of</strong> input with different capital prices, i.e. the function Ty.<br />
production function Tx <strong>and</strong> Ty are presented in Figure 7.<br />
Curves Tx <strong>and</strong> Ty cut inside the so-called “region <strong>of</strong><br />
mutual production advantages” limited by isoquants Ix<br />
<strong>and</strong> Iy. the curve Tx , on the one side, represents the factor<br />
dem<strong>and</strong> curve (L, K) used for production <strong>of</strong> product X,<br />
<strong>and</strong> at the same time, it is the product supply curve X, on<br />
the other side. Therefore, the curve Ty represents the<br />
factor dem<strong>and</strong> curve for production <strong>of</strong> goods Y, but also<br />
the supply curve Y.<br />
The slopes <strong>of</strong> isoquants, i.e. the curve <strong>of</strong> equal product<br />
MRTS, express the technical substitution possibilities <strong>of</strong><br />
input factors in the given isoquant point (in fact, the slope<br />
<strong>of</strong> tangent along with this point) <strong>and</strong> with the condition<br />
that the volume <strong>of</strong> production remains the same. The<br />
slopes <strong>of</strong> isocost lines (line <strong>of</strong> equal costs) express the<br />
relations <strong>of</strong> prices used <strong>and</strong> combined factors in<br />
production, i.e. the relation Pk/Pl. That means that<br />
isoquants <strong>and</strong> isocost lines <strong>of</strong> marginal substitution rates<br />
<strong>of</strong> production factors in the points <strong>of</strong> tangents are<br />
appropriate to the relations <strong>of</strong> current prices <strong>of</strong> these<br />
factors. It is, together, the criterion <strong>of</strong> optimal factor<br />
combination. Thus, this relation is valid:<br />
MPL<br />
PL<br />
MRTS L,K = =<br />
MPK<br />
PK<br />
(8)<br />
E<br />
T y<br />
T x<br />
X 1<br />
X 2<br />
X 3<br />
X<br />
Figure 9.<br />
The contract curves <strong>of</strong> production transferred from<br />
previous diagrams (Figure 6 <strong>and</strong> 8), change into the<br />
function <strong>of</strong> production possibilities or the curve <strong>of</strong><br />
production transformation. The slope <strong>of</strong> transformation<br />
curve expresses the marginal rates <strong>of</strong> product<br />
transformation X <strong>and</strong> Y, i.e. MRT (Marginal Rate <strong>of</strong><br />
Transformation). Marginal transformation curves with<br />
coordinate axes express extreme cases, i.e. when only one<br />
or only other kind <strong>of</strong> product is produced. Individual<br />
points <strong>of</strong> production transformation curves express<br />
different alternatives combinations <strong>of</strong> final products X <strong>and</strong><br />
Y, which can be maximally produced by full employment<br />
<strong>of</strong> available inputs R <strong>and</strong> K with available technology. It<br />
means that all the combinations along the transformation<br />
production curve satisfy the criteria <strong>of</strong> Pareto optimum,<br />
i.e. general production equilibrium. In the area under the<br />
curve <strong>of</strong> alternative production possibilities there are<br />
differently realizable possibilities X <strong>and</strong> Y with<br />
suboptimal use <strong>of</strong> resource use, <strong>and</strong> combinations in the<br />
area <strong>of</strong> alternative production possibilities out or above the<br />
curve <strong>of</strong> production transformation are unrealizable based<br />
on available possibilities.<br />
After the differentiated analysis <strong>of</strong> conditions <strong>and</strong><br />
suppositions <strong>of</strong> general equilibrium <strong>of</strong> production <strong>and</strong><br />
exchange, we can analyze the general economic<br />
equilibrium in the economy, i.e. the equilibrium <strong>of</strong><br />
production <strong>and</strong> exchange.<br />
IV.<br />
GENERAL EQUILIBRIUM OF PRODUCTION AND<br />
EXCHANGE<br />
The cited conditions <strong>of</strong> general exchange equilibrium <strong>and</strong><br />
general production equilibrium must unite in order to<br />
make the simultaneous equilibrium <strong>of</strong> production <strong>and</strong>
exchange, as in reality, economies where only production<br />
or exchange <strong>of</strong> goods do not exist [ Stojanovic, 1994].<br />
In Figure 10, the curve <strong>of</strong> transformation TP(X,Y)<br />
represents the combinations <strong>of</strong> goods X <strong>and</strong> Y. The curve<br />
OAOB represents the so-called contract consumption<br />
curve – exchange. The simultaneous or general<br />
equilibrium <strong>of</strong> production <strong>and</strong> exchange, or the so-called<br />
Pareto optimal equilibrium is realized with the condition:<br />
MRT = (MRS ) = (MRS<br />
X/Y<br />
Y 3<br />
Y 2<br />
Y 1<br />
0<br />
X, Y<br />
Y<br />
A<br />
F<br />
T p<br />
E<br />
G<br />
X 1<br />
X 2<br />
X 3<br />
X<br />
Figure 10.<br />
X, Y<br />
(10)<br />
where exchangers <strong>of</strong> goods X <strong>and</strong> Y are participants A<br />
<strong>and</strong> B.<br />
The general production equilibrium is realized at point<br />
M (or OB) which provides production per 10 units X <strong>and</strong><br />
Y. The curve tangent <strong>of</strong> production possibilities Tp(x,y) at<br />
point M expresses the marginal transformation rate X in<br />
Y, i.e. MRTX,Y.The tangent along the curve Tr(X,Y)<br />
expresses the marginal rate <strong>of</strong> substitution <strong>of</strong> cited goods<br />
in production, i.e. MRSX,Y. At points M <strong>and</strong> E there is<br />
pararellism <strong>of</strong> the cited tangents. They provide general<br />
production equilibrium at point M <strong>and</strong> general exchange<br />
production at point E. Point E shows also the distribution<br />
<strong>of</strong> made equilibrium amount <strong>of</strong> goods X <strong>and</strong> Y between A<br />
<strong>and</strong> B in the sense: A gets six pieces <strong>of</strong> X <strong>and</strong> five units <strong>of</strong><br />
Y, while B will obtain four pieces X <strong>and</strong> five pieces Y.<br />
The criterion <strong>of</strong> simultaneous equilibrium <strong>of</strong><br />
production <strong>and</strong> exchange in the sense <strong>of</strong> equalizing<br />
marginal transformation rates <strong>and</strong> marginal substitution<br />
rates can be generalized , <strong>of</strong> course, in case <strong>of</strong> the<br />
existence <strong>of</strong> more kinds <strong>of</strong> goods, i.e. more producers <strong>and</strong><br />
consumers. It makes the economic analysis more complete<br />
<strong>and</strong> near its reality.<br />
)<br />
B<br />
MRT, i.e. marginal rate <strong>of</strong> transformation <strong>of</strong> goods in<br />
equilibrium reflect the relations <strong>of</strong> their marginal<br />
production costs, <strong>and</strong> MRS, i.e. the marginal rate <strong>of</strong><br />
substitution <strong>of</strong> goods at the equilibrium level equalize<br />
marginal utility goods (<strong>and</strong> these reflect the relations <strong>of</strong><br />
their equilibrium prices). Thus, the criterion <strong>of</strong><br />
simultaneous general equilibrium in production <strong>and</strong><br />
exchange can be expressed in the following way:<br />
MCX<br />
⎛ MUX<br />
⎞ ⎛ MUX<br />
⎞<br />
=<br />
MC<br />
⎜<br />
Y MU<br />
⎟ =<br />
⎜<br />
Y MU<br />
⎟<br />
⎝ ⎠A<br />
⎝ Y ⎠B<br />
(11)<br />
The above relation is valid, <strong>of</strong> course, also in the model<br />
with a large number <strong>of</strong> goods <strong>and</strong> services in case <strong>of</strong> many<br />
producers <strong>and</strong> consumers.<br />
The presented (<strong>and</strong> simplified) analysis <strong>of</strong> general<br />
equilibrium <strong>of</strong> exchange <strong>and</strong> production, besides<br />
completing the knowledge <strong>of</strong> functioning connected <strong>and</strong><br />
complex system <strong>of</strong> market mechanisms has a broader<br />
importance. The conditions <strong>and</strong> criteria <strong>of</strong> general<br />
competitive equilibrium are applied in the analysis <strong>of</strong> a<br />
very important <strong>and</strong> current subject matter <strong>of</strong> economic<br />
theory to the so-called welfare economics <strong>and</strong> the theory<br />
<strong>of</strong> optimum (efficiency) <strong>of</strong> contemporary market<br />
economy. However, this will be the subject <strong>of</strong> researching<br />
in the next work.<br />
REFERENCES<br />
[1] Schuman J., “Grundzuge der mikrookonomischen Therie”,<br />
JATEPress Szeged 1988<br />
[2] Suvakov T., Sagi A., “Mikroekonomija”, Ekonomski fakultet,<br />
Subotica 2011<br />
[3] Trivic N., Sagi A., “Savremeni mikroekonomski modeli”,<br />
Ekonomski fakultet, Subotica 2008<br />
[4] Kopány M. et. all, ”Mikroökonómia”, Közgazdasági és Jogi<br />
Könyvkiadó, Budapest 2008<br />
[5] Samuelson P., Nordhaus, “Economics”, Mc-Graw Hill, 2006<br />
[6] Debreu G., “Theorie <strong>of</strong> Value”, John Wiley & Sons, New York<br />
1959<br />
[7] Pareto V., ” Manual <strong>of</strong> Political Economie”, August M. Kelley,<br />
New York 1971<br />
[8] Arrov K. J., “The organization <strong>of</strong> economic activity: Issues<br />
pertinent to the choice market versus nonmarket allocation. In:US<br />
Joint Economic Committee, The analysis <strong>and</strong> evaluation <strong>of</strong> public<br />
expenditure: The PBB system, vol. I., pp. 59-73 Washington.