Global Economic Outlook and Strategy - Kadin Indonesia
Global Economic Outlook and Strategy - Kadin Indonesia
Global Economic Outlook and Strategy - Kadin Indonesia

Create successful ePaper yourself
Turn your PDF publications into a flip-book with our unique Google optimized e-Paper software.
See the Disclosure Appendix for the Analyst<br />
Certification <strong>and</strong> Other Disclosures.<br />
ECONOMIC & February 28, 2008<br />
MARKET<br />
ANALYSIS<br />
<strong>Economic</strong>s/<strong>Strategy</strong><br />
<strong>Global</strong><br />
Lewis Alex<strong>and</strong>er<br />
1-212-816-9882<br />
lewis.alex<strong>and</strong>er@citi.com<br />
Europe<br />
Michael Saunders<br />
44-20-7986-3299<br />
Japan<br />
Kiichi Murashima<br />
81-3-5574-4730<br />
United States<br />
Robert V. DiClemente<br />
1-212-816-9893<br />
Australia/New Zeal<strong>and</strong><br />
Paul Brennan<br />
Stephen Halmarick<br />
61-2-8225-6043<br />
Canada<br />
Dana Peterson<br />
1-212-816-3549<br />
Emerging Markets<br />
Donald Hanna<br />
1-212-816-9891<br />
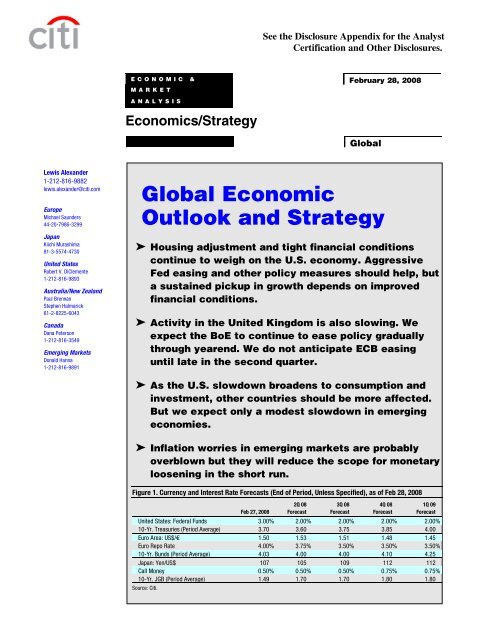
<strong>Global</strong> <strong>Economic</strong><br />
<strong>Outlook</strong> <strong>and</strong> <strong>Strategy</strong><br />
➤ Housing adjustment <strong>and</strong> tight financial conditions<br />
continue to weigh on the U.S. economy. Aggressive<br />
Fed easing <strong>and</strong> other policy measures should help, but<br />
a sustained pickup in growth depends on improved<br />
financial conditions.<br />
➤ Activity in the United Kingdom is also slowing. We<br />
expect the BoE to continue to ease policy gradually<br />
through yearend. We do not anticipate ECB easing<br />
until late in the second quarter.<br />
➤ As the U.S. slowdown broadens to consumption <strong>and</strong><br />
investment, other countries should be more affected.<br />
But we expect only a modest slowdown in emerging<br />
economies.<br />
➤ Inflation worries in emerging markets are probably<br />
overblown but they will reduce the scope for monetary<br />
loosening in the short run.<br />
Figure 1. Currency <strong>and</strong> Interest Rate Forecasts (End of Period, Unless Specified), as of Feb 28, 2008<br />
2Q 08 3Q 08 4Q 08 1Q 09<br />
Feb 27, 2008 Forecast Forecast Forecast Forecast<br />
United States: Federal Funds 3.00% 2.00% 2.00% 2.00% 2.00%<br />
10-Yr. Treasuries (Period Average) 3.70 3.60 3.75 3.85 4.00<br />
Euro Area: US$/€ 1.50 1.53 1.51 1.48 1.45<br />
Euro Repo Rate 4.00% 3.75% 3.50% 3.50% 3.50%<br />
10-Yr. Bunds (Period Average) 4.03 4.00 4.00 4.10 4.25<br />
Japan: Yen/US$ 107 105 109 112 112<br />
Call Money 0.50% 0.50% 0.50% 0.75% 0.75%<br />
10-Yr. JGB (Period Average) 1.49 1.70 1.70 1.80 1.80<br />
Source: Citi.
February 28, 2008<br />
<strong>Global</strong> <strong>Economic</strong> <strong>Outlook</strong> <strong>and</strong> <strong>Strategy</strong><br />
Table of Contents<br />
Page<br />
Key Events Calendar 2<br />
Summary of Main Views 3<br />
Overview 4-9<br />
Short-Term <strong>Economic</strong> Forecasts 10<br />
Key <strong>Global</strong> <strong>Economic</strong> Indicators 11<br />
Short-Term Currency, Interest Rate <strong>and</strong> Bond Forecasts 12-13<br />
Foreign Exchange <strong>Strategy</strong> 14-15<br />
<strong>Global</strong> Equity <strong>Strategy</strong> 16-17<br />
Long-Term <strong>Economic</strong> <strong>and</strong> Market Forecasts 18-19<br />
Country Commentary<br />
United States 20<br />
Japan 21<br />
Euro Area 22-24<br />
United Kingdom 25<br />
Switzerl<strong>and</strong>, Sweden, Denmark, <strong>and</strong> Norway 26<br />
Canada 27<br />
Australia <strong>and</strong> New Zeal<strong>and</strong> 28<br />
China 29<br />
Emerging Markets 30-38<br />
EMA Contact List 39<br />
Recent Publications 40<br />
Figure 2. Key Policy Events, 28 Feb – 31 Mar 08<br />
Date Country Event<br />
Mar 2 Russia Presidential Election, First Round<br />
Mar 3-4 European Union Eurogroup Finance Ministers’ Meetings (Mar 3) <strong>and</strong> ECOFIN Meetings (Mar4)<br />
Mar 4 Australia Reserve Bank of Australia Board Meeting<br />
Mar 4 Canada Bank of Canada Interest Rate Announcement<br />
Mar 4-5 Brazil Central Bank of Brazil Monetary Policy Meeting<br />
Mar 5-6 United Kingdom Bank of Engl<strong>and</strong> Monetary Policy Committee Meeting<br />
Mar 5-19 China 11 th National People’s Congress Approves the Formation of the New Government<br />
Mar 6 New Zeal<strong>and</strong> Reserve Bank of New Zeal<strong>and</strong> Monetary Policy Statement <strong>and</strong> Official Cash Rate Announcement<br />
Mar 6-7 Japan Bank of Japan Monetary Policy Meeting<br />
Mar 6 Euro Area ECB Monetary Policy Meeting <strong>and</strong> Press Conference<br />
Mar 7 Korea Bank of Korea Monetary Policy Meeting<br />
Mar 9 Spain General Election<br />
Mar 9 France Municipal Elections, First Round (Second Round Mar 16)<br />
Mar 9 United States & Canada Clocks Moved Forward One Hour<br />
Mar 12 United Kingdom 2008 Budget<br />
Mar 13 Philippines Central Bank of the Philippines Monetary Board Meeting<br />
Mar 13 Switzerl<strong>and</strong> Swiss National Bank Monetary Policy Assessment<br />
Mar 13 Norway Norges Bank Monetary Policy Report <strong>and</strong> Interest Rate Announcement<br />
Mar 13 Chile Central Bank of Chile Monetary Policy Meeting<br />
Mar 13 Peru Central Reserve Bank of Peru Monetary Policy Announcement<br />
Mar 13-14 European Union European Council of Heads of State <strong>and</strong> Government (Brussels)<br />
Mar 14 Mexico Bank of Mexico Monetary Policy Announcement<br />
Mar 14-16 G-8 G-8 Dialogue on Climate Change (Chiba, Japan)<br />
Mar 18 United States FOMC Meeting<br />
Mar 19 Turkey Central Bank of the Republic of Turkey Monetary Policy Meeting<br />
Mar 25 Israel Bank of Israel Interest Rate Announcement<br />
Mar 25 Slovakia National Bank of Slovakia Monetary Policy Report<br />
Mar 25-26 Pol<strong>and</strong> National Bank of Pol<strong>and</strong> Monetary Policy Council Meeting<br />
Mar 26 Romania National Bank of Romania Board Meeting<br />
Mar 26 Czech Republic Czech National Bank Monetary Policy Board Meeting<br />
Mar 28-29 European Union Informal Meeting of EU Foreign Ministers<br />
Mar 31 Europe Clocks Moved Forward One Hour<br />
Mar 31 Hungary Central Bank of Hungary Monetary Policy Meeting<br />
2
February 28, 2008<br />
<strong>Global</strong> <strong>Economic</strong> <strong>Outlook</strong> <strong>and</strong> <strong>Strategy</strong><br />
Figure 3. Forecast Highlights <strong>and</strong> Changes from Last Month<br />
G3<br />
• United States • With tight financial conditions reinforcing economic weakness, the<br />
Fed has taken a more aggressive tack, with only limited impact<br />
thus far. We look for cuts in the funds rate to 2% by midyear,<br />
barring a sharp recovery in risk appetite <strong>and</strong> housing leads.<br />
• Euro Area • Growth has slowed to a subtrend pace, where it probably will stay<br />
until late this year. Inflation remains high but should moderate<br />
quickly. We expect the ECB to ease policy modestly later this year.<br />
• Japan • <strong>Economic</strong> growth likely will remain near trend in 2008. The next<br />
BoJ rate hike probably will be delayed until around yearend, as<br />
uncertainties surrounding the global outlook have increased.<br />
Others<br />
• United Kingdom • The MPC will likely cut rates a lot more, but any easing will be<br />
gradual in order to grind down inflation expectations.<br />
• Canada • Moderating inflation <strong>and</strong> lingering downside risks likely will prompt<br />
an additional 100 basis points of BoC easing before summer.<br />
• Australia • The RBA is set to tighten policy again in March <strong>and</strong> May, with the<br />
risk of further tightening beyond that, as the Bank attempts to drive<br />
inflation back down toward the 2%-3% target range.<br />
• China • Rising inflation <strong>and</strong> weakening exports could lead to a period of<br />
tight monetary policy <strong>and</strong> loose fiscal policy.<br />
• Other Emerging Markets • Inflation worries are probably overblown, but they will reduce<br />
the scope for monetary loosening in the short run <strong>and</strong> dampen<br />
growth.<br />
3
February 28, 2008<br />
<strong>Global</strong> <strong>Economic</strong> <strong>Outlook</strong> <strong>and</strong> <strong>Strategy</strong><br />
Lewis Alex<strong>and</strong>er<br />
(212) 816-9882<br />
lewis.alex<strong>and</strong>er<br />
@citi.com<br />
Financial conditions are<br />
weighing on the U.S.<br />
economy.<br />
Most countries show few<br />
signs of distress...<br />
...but that may change.<br />
Emerging economies are<br />
well positioned for the<br />
slowdown.<br />
Overview: The United States <strong>and</strong> World <strong>Economic</strong> <strong>Outlook</strong><br />
The recent deterioration in financial conditions is having its biggest impact on the U.S.<br />
economy. Europe is also slowing, but the spillover to most emerging economies<br />
remains modest so far. Looking ahead, we expect a variety of factors — including the<br />
waning of the drag from residential construction, fiscal stimulus, <strong>and</strong> improving<br />
financial conditions driven by a more assertive Fed — to contribute to a modest<br />
recovery in U.S. growth starting in the second half of the year.<br />
The forces restraining the pace of U.S. economic activity have shown few signs of<br />
easing in recent weeks. Incoming data from the housing sector point to ongoing<br />
contraction. The prevailing mix of credit, equity, <strong>and</strong> other asset prices continues to be<br />
a significant headwind for aggregate dem<strong>and</strong> (see Figure 4). Consumption indicators<br />
suggest that household spending has slowed markedly.<br />
The U.S. slowdown is a drag on the Canadian <strong>and</strong> Mexican economies, <strong>and</strong> economic<br />
activity in the United Kingdom <strong>and</strong> the euro area is also slowing, but less sharply than<br />
in the United States.<br />
However, most other countries still show few signs of being adversely affected by the<br />
U.S.-led slowdown. Recent data for China point to a strong start to 2008, while resilient<br />
dem<strong>and</strong> for commodities is supporting many emerging economies <strong>and</strong> smaller highincome<br />
countries with a comparative advantage in commodity production. The<br />
underperformance of the U.S. economy relative to most other major economies is<br />
contributing to downward pressure on the U.S. dollar (see Figure 5).<br />
This pattern may change in coming quarters. The U.S. slowdown is spreading beyond<br />
residential construction. A broader <strong>and</strong> deeper slowdown in U.S. consumption <strong>and</strong><br />
investment should generate a more significant slowdown in imports that will serve to<br />
moderate growth in the rest of the world (see Figure 6).<br />
Policy flexibility around the world is likely to play an important role in containing the<br />
global slowdown. Unlike the past, many emerging economies (such as Brazil, Mexico,<br />
<strong>and</strong> Korea) have strong public <strong>and</strong> private balance sheets, <strong>and</strong> they have established<br />
Figure 4. United States — Citi Financial Conditions Index (St<strong>and</strong>ard<br />
Deviations) <strong>and</strong> the Output Gap (Percent of GDP), 1988-Jan 08<br />
3σ 3<br />
6% 6<br />
Figure 5. United States <strong>and</strong> Other Major Industrial Countries —<br />
<strong>Economic</strong> Surprises (100=1 St<strong>and</strong>ard Deviation), Jan 07-27 Feb 08<br />
100<br />
100<br />
2<br />
4<br />
75<br />
75<br />
1<br />
2<br />
50<br />
50<br />
0<br />
-1<br />
-2<br />
-3<br />
1988 1990 1992 1994 1996 1998 2000 2002 2004 2006 2008<br />
FCI (Left)<br />
GDP Gap (Right)<br />
0<br />
-2<br />
-4<br />
-6<br />
25<br />
0<br />
-25<br />
-50<br />
United States<br />
Other Major Economies<br />
-75<br />
-75<br />
Jan-07 Apr-07 Jul-07 Oct-07 Jan-08 Apr-08<br />
25<br />
0<br />
-25<br />
-50<br />
Note: Shaded regions denote recession. Sources: Bureau of <strong>Economic</strong> Analysis, Congressional<br />
Budget Office <strong>and</strong> Citi.<br />
Note: Citi <strong>Economic</strong> Surprise Indexes are weighted averages of the difference between<br />
individual data releases <strong>and</strong> the consensus forecast. “Other Industrial Countries” includes the<br />
euro area, Japan, Great Britain, Australia, <strong>and</strong> Canada. Source: Citi.<br />
4
February 28, 2008<br />
<strong>Global</strong> <strong>Economic</strong> <strong>Outlook</strong> <strong>and</strong> <strong>Strategy</strong><br />
Slow growth should<br />
contain inflation.<br />
The course of global<br />
growth depends on<br />
financial conditions.<br />
The Citi FCI has tightened<br />
despite Fed easing.<br />
The fiscal package will<br />
provide a temporary<br />
boost.<br />
Inflation likely will cool in<br />
the second half.<br />
strong records of pursuing stable macroeconomic policies. This should make it possible<br />
for these countries to ease policy, if needed, even in the midst of substantial turmoil in<br />
global financial markets.<br />
Strong commodity prices <strong>and</strong> declining output gaps in some countries are putting<br />
upward pressure on inflation. Nonetheless, we expect the slowdown in the United<br />
States <strong>and</strong> Western Europe to contain inflation in those countries (see Figure 7), <strong>and</strong><br />
slowing export growth should help to contain inflationary pressures in other key<br />
countries such as China.<br />
The evolution of financial conditions remains a key source of uncertainty. In recent<br />
days, credit, equity, <strong>and</strong> other financial markets seem to have found a footing in<br />
response to the significant shift in Federal Reserve policy in late January, the U.S. fiscal<br />
stimulus package, <strong>and</strong> other policy measures intended to address some of the stress<br />
points in the financial system. However, even if financial markets stabilize <strong>and</strong> improve<br />
from here, the cumulative impact of the financial turmoil of the last six months is likely<br />
to be a drag on the U.S. <strong>and</strong> global economy for many months. Moreover, given the<br />
still considerable uncertainty about the magnitude <strong>and</strong> distribution of losses in the<br />
financial system, we cannot be confident that we have seen the worst in financial<br />
markets.<br />
U.S. Financial Conditions Critical to the <strong>Outlook</strong><br />
Our composite measure of U.S. financial conditions has tightened since our last forecast<br />
round (see Figure 4). Currently, the Citi financial conditions index (FCI) is about two<br />
st<strong>and</strong>ard deviations tighter than normal, a reading consistent with anemic economic<br />
growth. Recent data, particularly the deceleration of consumption since November,<br />
appear consistent with the deterioration in financial conditions since last summer. The<br />
Federal Reserve seems likely to lower policy rates further in an attempt to offset the<br />
adverse dynamic starting to take hold. Importantly, forecasts of a sustained<br />
improvement in the pace of activity later this year depend on a recovery in financial<br />
conditions.<br />
The recently enacted fiscal stimulus package will boost economic growth later this year<br />
— most likely in the third quarter — but its impact on activity will be temporary. The<br />
lift in household disposable income from the rebate checks could underpin consumer<br />
spending growth that is about 2½ percentage points faster than otherwise would be the<br />
case. But because this is a one-time boost to household income, the step up in spending<br />
will be largely reversed out in ensuing quarters.<br />
An additional 100-basis-point decline in the funds rate is likely despite the continued<br />
stickiness in inflation. Consumer <strong>and</strong> wholesale inflation readings in January were<br />
disappointing, <strong>and</strong> our latest forecast anticipates slightly higher core inflation this year.<br />
As long as inflation expectations remain anchored near current levels, however, the<br />
combination of soft dem<strong>and</strong>, tight financial conditions, <strong>and</strong> falling home prices should<br />
produce a cooling in price pressures. The timetable for such a cooling probably will be<br />
deeper into the year than we previously envisioned. As key Fed officials continue to<br />
remind market participants, an unmooring of pricing attitudes could upend expectations<br />
of an easing in inflation. So, we will continue to monitor developments on this front<br />
closely.<br />
5
February 28, 2008<br />
<strong>Global</strong> <strong>Economic</strong> <strong>Outlook</strong> <strong>and</strong> <strong>Strategy</strong><br />
Improved financial<br />
conditions will be<br />
necessary to avoid the<br />
worst outcomes.<br />
Risks to euro area growth<br />
are to the downside...<br />
...while Japan may show<br />
little impact from slower<br />
global growth.<br />
In recent days, however, financial markets have improved marginally in response to the<br />
likelihood that Fed officials will continue to pursue a risk-management approach to<br />
policy <strong>and</strong> hints that some regulators’ efforts may be reducing the probability of select<br />
risk outcomes (see Figures 8 <strong>and</strong> 9). Considerable additional improvement remains<br />
necessary.<br />
The Euro Area Has Started to Slow<br />
GDP growth in the euro area slowed markedly in late 2007, <strong>and</strong> confidence indicators<br />
suggest that the expansion remains somewhat below trend early this year, although not<br />
dramatically so. Still, the risks to the growth outlook remain on the downside, reflecting<br />
not only the global slowdown, but also, <strong>and</strong> more importantly, disappointing domestic<br />
consumption. Against a backdrop of less favorable labor market conditions, tighter<br />
lending st<strong>and</strong>ards suggest that a significant rebound of consumer outlays is less likely<br />
than before. The near-term inflation outlook is uncertain, as food <strong>and</strong> energy prices may<br />
rise further. However, medium-term price prospects remain favorable because the<br />
economic slowdown limits the risk of a rise in inflation expectations <strong>and</strong> wage growth.<br />
The European Central Bank (ECB) probably will keep official rates unchanged until<br />
near-term inflation <strong>and</strong> wage risks diminish. If inflation moderates rapidly starting in<br />
the second quarter <strong>and</strong> wages are contained, the ECB probably will lower rates this<br />
year, although not aggressively. The rise in the latest German ifo business survey will<br />
no doubt encourage ECB officials to consider that growth will not be far below<br />
potential.<br />
Muted Impact on Japanese Economy<br />
Japan’s economic outlook remains relatively favorable <strong>and</strong> stable among the major<br />
industrialized countries. Real GDP grew a stronger-than-expected 3.7% annualized in<br />
the fourth quarter of 2007, driven by strong gains in exports <strong>and</strong> business investment.<br />
While exports will inevitably decelerate in 2008 in the context of the slower global<br />
economy, we still expect near or slightly above-trend growth this year. Trade statistics<br />
for January indicate that Japan’s exports remain on a solid upward track, driven by<br />
exports not bound for the United States. Moreover, negative effects from the<br />
Figure 6. United States — Year-to-Year Percent Change in Imports<br />
<strong>and</strong> the Average of ISM New Orders <strong>and</strong> Imports (Six-Month Lag),<br />
1996–Jan 08<br />
25%<br />
20<br />
15<br />
10<br />
70<br />
65<br />
60<br />
Figure 7. United States — Nominal Final Domestic Dem<strong>and</strong> (Yearto-Year<br />
Percent Change, Four-Quarter Lag) <strong>and</strong> Change in Two-Year<br />
Annualized Core CPI (Percent), 1990–Jan 08<br />
9% 9<br />
1.2%<br />
Final Dem<strong>and</strong> (Left)<br />
8<br />
Core CPI (Right)<br />
0.8<br />
7<br />
6<br />
0.4<br />
5<br />
55<br />
5<br />
0.0<br />
0<br />
-5<br />
-10<br />
Growth of Imports (Left)<br />
Imports&Orders (Right)<br />
50<br />
45<br />
4<br />
3<br />
2<br />
-0.4<br />
-0.8<br />
-15<br />
1996 1998 2000 2002 2004 2006<br />
40<br />
1<br />
1990 1993 1996 1999 2002 2005 2008<br />
-1.2<br />
Sources: Institute for Supply Management <strong>and</strong> Bureau of <strong>Economic</strong> Analysis.<br />
Sources: Bureau of <strong>Economic</strong> Analysis <strong>and</strong> Bureau of Labor Statistics.<br />
6
February 28, 2008<br />
<strong>Global</strong> <strong>Economic</strong> <strong>Outlook</strong> <strong>and</strong> <strong>Strategy</strong><br />
The change in BoJ<br />
leadership will not alter<br />
policy.<br />
Rising commodity prices<br />
have helped some<br />
industrial economies.<br />
Strong fundamentals have<br />
insulated some emerging<br />
economies...<br />
...from deteriorating global<br />
growth.<br />
government’s economic policies — namely, the enforcement of the revised Building<br />
St<strong>and</strong>ard Law <strong>and</strong> tax <strong>and</strong> social security burden hikes for the household sector — will<br />
diminish meaningfully or even reverse in 2008. Finally, financial conditions remain<br />
much more favorable than in other industrialized countries as damages to banks’ capital<br />
from subprime mortgage-related structured products have been limited.<br />
Bank of Japan (BoJ) Governor Fukui will leave office on March 19. The government is<br />
scheduled to announce its proposal for the next governor <strong>and</strong> two deputy governors<br />
next week. Press reports suggest that Mr. Toshiro Muto, a current deputy governor, is<br />
likely to be nominated to replace Mr. Fukui. The basic thrust of monetary policy (that<br />
is, gradual rate hikes to more normal levels) will likely remain largely intact. While<br />
uncertainties surrounding the U.S. economy <strong>and</strong> global financial markets will likely<br />
continue to dissuade the BoJ from hiking rates until around the turn of this year, the<br />
next policy action will probably be a rate hike unless the domestic economy slows<br />
much more sharply than we now expect.<br />
Strong Commodities Dem<strong>and</strong> Is Boosting Some Industrial Countries<br />
In contrast to developments in the major industrial economies, economic growth has<br />
remained resilient in a number of smaller industrialized economies that principally are<br />
leveraged to the boom in commodity prices, such as Australia. Indeed, many<br />
commodity prices have continued to rise this year, especially energy-related<br />
commodities, iron ore, food, <strong>and</strong> some base metals, despite the marking down of<br />
prospects for global economic growth. The strength of commodity prices reflects<br />
ongoing supply bottlenecks <strong>and</strong> still rampant dem<strong>and</strong> in China <strong>and</strong> emerging<br />
economies generally. Against this backdrop, a deteriorating outlook for inflation forced<br />
both the Reserve Bank of Australia <strong>and</strong> the Riksbank to raise official interest rates in<br />
February, <strong>and</strong> we expect more monetary policy tightening in Australia <strong>and</strong> Norway,<br />
while the Reserve Bank of New Zeal<strong>and</strong> is likely to maintain a tightening bias this year.<br />
Strong Fundamentals Are Bolstering Many Emerging Economies...<br />
Strong economic growth is likely to continue in emerging Asia, despite the weakening<br />
of the U.S. economy. However, Asia’s resilient growth is not because it has decoupled<br />
from the United States, but because it enjoys greater policy flexibility from improved<br />
macroeconomic fundamentals. China is likely to step up public-sector dominated<br />
spending on infrastructure <strong>and</strong> the resource sectors in the face of slowing exports. This<br />
could also happen in many other economies, including Korea, Hong Kong, Singapore,<br />
Thail<strong>and</strong>, the Philippines, <strong>and</strong> even <strong>Indonesia</strong>. This implies that, in the short term,<br />
while headline growth could moderate, Asian economies could become more dependent<br />
on investment. As a result, commodity dem<strong>and</strong> intensity could increase.<br />
Deteriorating global prospects, especially in the major economies, have so far had only<br />
a modest impact on Latin American economies. Growth remains generally strong,<br />
although somewhat slower than in 2007, <strong>and</strong> should remain above trend with a regional<br />
average of 4.4% for 2008. After a temporary selloff, currencies have strengthened, with<br />
the Brazilian real, Peruvian sol, <strong>and</strong> Colombian <strong>and</strong> Chilean pesos making new highs<br />
against the U.S. dollar in recent weeks.<br />
China will appoint its new government for the next five years at the National People’s<br />
Congress meetings starting March 5. A new president just took office in Korea. In<br />
general, we do not expect these political changes to have a significant impact on<br />
7
February 28, 2008<br />
<strong>Global</strong> <strong>Economic</strong> <strong>Outlook</strong> <strong>and</strong> <strong>Strategy</strong><br />
economic policies. However, economic policies in Taiwan <strong>and</strong> Thail<strong>and</strong> could show<br />
significant improvement following the elections, generating an important<br />
macroeconomic turnaround in these two sluggish economies.<br />
Slowing exports may<br />
harm some emerging<br />
economies.<br />
Reduced capital flows are<br />
hurting countries that rely<br />
on external financing.<br />
However, financial stability remains a concern in a number of emerging European<br />
economies thanks to a sustained decline in risk appetite, together with concerns about<br />
the risks to net exports in the context of a slowdown in the Eurozone. The export shock<br />
will be felt most acutely in central Europe, particularly in Hungary, Czech Republic,<br />
<strong>and</strong> Slovakia, whose economies are highly dependent on exports, <strong>and</strong> whose recent<br />
growth rates have benefited considerably from Eurozone dem<strong>and</strong>. Pol<strong>and</strong>, by contrast,<br />
should be relatively insulated because it is a more closed economy reliant on domestic<br />
spending growth.<br />
The decline in capital flows is naturally proving most painful to those economies<br />
heavily dependent on external financing: Romania, South Africa, <strong>and</strong> the Baltics are<br />
key examples. The clearest expression of risk aversion in these countries has been the<br />
continued rise in sovereign credit (particularly CDS) spreads. The rise in spreads has<br />
been noticeably large even in countries with very low public debt burdens like<br />
Kazakhstan (6% of GDP) or Romania (16% of GDP). In addition, currency volatility<br />
has increased in a number of countries, particularly in South Africa <strong>and</strong> Romania.<br />
...But Inflation Remains a Concern<br />
Rates have risen in<br />
countries at risk to higher<br />
inflation.<br />
Oil exports also are<br />
experiencing rising<br />
inflation.<br />
The decline in capital flows <strong>and</strong> the rise in exchange rate volatility complicate the<br />
inflation outlook in many countries, particularly in the context of higher global food<br />
prices. Interest rates are under upward pressure in South Africa, Romania, Hungary, the<br />
Czech Republic, Pol<strong>and</strong>, <strong>and</strong> Egypt, among other countries. Our interest rate forecasts<br />
are subject to the risk that we have underestimated food price shocks in the region.<br />
Inflation is also a key issue for many of the “surplus” economies, notably the Gulf<br />
Cooperation Council <strong>and</strong> Russia. For these economies it remains the case that currency<br />
appreciation will be the most reliable disinflationary tool. Policymakers remain fearful<br />
in many cases that stronger nominal exchange rates will hurt competitiveness. In time<br />
we expect this dilemma to be resolved mostly in favor of local currency revaluation<br />
against the dollar.<br />
Figure 8. United States — Spreads for Indexes of Credit Defaults<br />
Swaps <strong>and</strong> Leveraged Loans (Basis Points), Jan 07-26 Feb 08<br />
Figure 9. United States — S&P 500 <strong>and</strong> S&P Financials Equity Price<br />
Indexes (May 2007=100), Jan 07-26 Feb 08<br />
180bp<br />
800bp<br />
110<br />
110<br />
160<br />
140<br />
CDX-IG5 (left)<br />
CDX-HY5 (right)<br />
LCDX (right)<br />
700<br />
600<br />
100<br />
FOMC Inter-Meeting<br />
Interest Rate Cut<br />
100<br />
120<br />
500<br />
90<br />
90<br />
100<br />
400<br />
80<br />
300<br />
80<br />
80<br />
60<br />
40<br />
FOMC Inter-Meeting<br />
Interest Rate Cut<br />
200<br />
100<br />
70<br />
S&P 500<br />
S&P Financial Index<br />
70<br />
20<br />
0<br />
60<br />
60<br />
Jan-07 Apr-07 Jul-07 Oct-07 Jan-08<br />
Jan-07 Apr-07 Jul-07 Oct-07 Jan-08<br />
Source: Citi.<br />
Source: Haver.<br />
8
February 28, 2008<br />
<strong>Global</strong> <strong>Economic</strong> <strong>Outlook</strong> <strong>and</strong> <strong>Strategy</strong><br />
Rising global food<br />
prices...<br />
...complicate monetary<br />
policy.<br />
Food inflation has become a key challenge in a number of economies, including China,<br />
Hong Kong, Singapore, Taiwan, <strong>and</strong> Vietnam. This has led to tightening monetary<br />
policies, including faster appreciation of Asian currencies, especially the Taiwanese<br />
dollar <strong>and</strong> Vietnamese dong. In other economies where inflation is less of a challenge,<br />
monetary policy easing is likely to continue following the Fed actions, especially in<br />
Thail<strong>and</strong>, the Philippines, <strong>and</strong> Korea. While inflation complicates macroeconomic<br />
policymaking, we think the chances of stagflation remain remote, as slowing activities<br />
should help ease inflation rates, especially core rates. But food prices could stay high in<br />
coming months, suggesting that tightening biases may continue in a number of<br />
economies.<br />
Given the high share of food in the typical CPI basket in Latin America, inflation<br />
pressures should remain a concern for most regional central bankers in the coming<br />
month. Interest rate markets reflect a lower risk of rate hikes in Brazil, <strong>and</strong> they are now<br />
pricing in cuts in Mexico. But the central banks of Chile, Colombia, <strong>and</strong> Peru remain<br />
under pressure to tighten further, as inflation rates continue to print well above their<br />
targets. Our current forecasts show the region shifting into a current account deficit of<br />
0.2% of GDP in 2008 on the back of rapidly growing imports. However, we believe<br />
that sky-high commodity prices place our forecast at risk, <strong>and</strong> may lead to higher-thanexpected<br />
reserves accumulation again this year.<br />
9
February 28, 2008<br />
<strong>Global</strong> <strong>Economic</strong> <strong>Outlook</strong> <strong>and</strong> <strong>Strategy</strong><br />
Figure 10. Forecast Overview, 2007-09F<br />
GDP Growth CPI Inflation Current Balance (% of GDP) Fiscal Balance (% of GDP)<br />
2007 2008F 2009F 2007 2008F 2009F 2007 2008F 2009F 2007 2008F 2009F<br />
<strong>Global</strong> 3.9% 3.2% 3.3% 3.0% 3.7% 2.8% 0.2% 0.1% 0.1% -0.6% -1.3% -1.4%<br />
Based on PPP weights 4.8 4.1 4.2 3.6 4.2 3.3 1.0 0.7 0.4 -0.7 -1.4 -1.5<br />
Industrial Countries 2.5% 1.7% 2.0% 2.1% 2.6% 1.8% -1.5% -1.2% -0.7% -1.0% -1.9% -1.9%<br />
United States 2.2 1.6 2.1 2.9 3.6 2.0 -5.4 -4.9 -4.1 -1.1 -3.0 -3.0<br />
Japan 2.1 1.9 1.7 0.0 0.7 0.3 4.8 4.8 5.2 -2.8 -3.0 -3.1<br />
Euro Area 2.6 1.7 1.8 2.1 2.3 1.8 0.2 0.2 0.3 -1.0 -1.3 -1.2<br />
Canada 2.5 1.0 1.5 2.1 1.4 2.0 0.9 -0.2 -0.8 0.2 0.1 0.1<br />
Australia 3.8 2.7 3.4 2.3 3.3 2.8 -5.9 -5.2 -5.2 1.6 1.3 1.5<br />
Germany 2.6 1.6 1.9 2.1 1.8 1.6 6.6 6.8 6.8 0.0 -0.5 -0.7<br />
France 1.9 1.6 1.6 1.5 2.2 1.4 -1.5 -1.7 -1.6 -2.6 -2.9 -2.8<br />
Italy 1.6 0.8 1.4 2.2 2.5 1.8 -2.0 -1.5 -1.5 -2.3 -2.7 -2.9<br />
Spain 3.8 2.1 2.2 2.7 3.4 2.3 -9.6 -8.9 -7.5 2.2 1.2 0.0<br />
United Kingdom 3.1 1.7 1.9 2.3 2.5 2.0 -5.2 -4.5 -3.3 -3.0 -3.3 -3.5<br />
Emerging Markets 7.2% 6.5% 6.4% 5.2% 6.1% 5.4% 4.6% 3.5% 2.3% 0.4% -0.1% -0.4%<br />
China 11.4 10.5 10.0 4.8 5.0 4.0 10.8 8.8 7.0 -1.8 -2.0 -1.5<br />
India 8.7 8.3 8.5 4.5 4.3 4.0 -1.2 -1.9 -1.8 -6.0 -5.8 -5.2<br />
Korea 4.9 4.6 4.8 2.5 3.3 2.5 0.6 -1.3 -0.6 2.0 2.0 1.5<br />
Pol<strong>and</strong> 6.5 5.0 4.7 2.5 4.2 3.0 -3.7 -4.7 -4.6 -1.5 -2.1 -2.5<br />
Russia 8.1 6.6 6.5 9.0 12.9 8.9 5.9 6.2 3.3 5.4 5.6 5.0<br />
South Africa 5.1 3.5 4.3 7.1 6.1 5.4 -7.1 -7.7 -7.7 0.8 0.3 0.2<br />
Turkey 3.8 4.2 5.2 8.8 7.8 6.5 -7.7 -8.3 -6.8 -2.2 -2.4 -3.2<br />
Brazil 5.3 4.4 4.0 3.6 4.7 4.5 0.3 -0.6 -1.0 -1.4 -0.7 -0.4<br />
Mexico 3.3 2.9 3.7 4.0 3.9 3.5 -0.9 -1.8 -2.3 0.0 0.0 0.0<br />
Note: Aggregation based on nominal GDP except where noted. F Citi forecast. For India, inflation forecast is for WPI.<br />
Source: Citi.<br />
10
February 28, 2008<br />
<strong>Global</strong> <strong>Economic</strong> <strong>Outlook</strong> <strong>and</strong> <strong>Strategy</strong><br />
Key <strong>Economic</strong> Indicators<br />
Figure 11. Euro Area, Japan, <strong>and</strong> the United States — Business Activity Survey Measures, 1987-Feb 2008<br />
3.0<br />
St<strong>and</strong>ard Deviations from Mean d<br />
2.0<br />
1.0<br />
0.0<br />
-1.0<br />
-2.0<br />
-3.0<br />
-4.0<br />
-5.0<br />
87 88 89 90 91 92 93 94 95 96 97 98 99 00 01 02 03 04 05 06 07 08<br />
3.0<br />
2.0<br />
1.0<br />
0.0<br />
-1.0<br />
-2.0<br />
-3.0<br />
-4.0<br />
-5.0<br />
St<strong>and</strong>ard Deviations from Mean<br />
U.S. ISM Euro Area Japan Tankan<br />
Note: The figure shows business activity survey indexes in the euro area, Japan <strong>and</strong> the United States, measured in units of st<strong>and</strong>ard deviations from the ten-year mean.<br />
Sources: Bank of Japan, EU Commission <strong>and</strong> the U.S. Institute for Supply Management.<br />
Figure 12. Commodity Prices, 1987-Feb 2008<br />
$ per Barrel<br />
240<br />
220<br />
200<br />
180<br />
160<br />
140<br />
120<br />
100<br />
80<br />
87 88 89 90 91 92 93 94 95 96 97 98 99 00 01 02 03 04 05 06 07 08<br />
Economist Index (Left)<br />
Oil Prices (Right)<br />
100<br />
90<br />
80<br />
70<br />
60<br />
50<br />
40<br />
30<br />
20<br />
10<br />
0<br />
Figure 13. Selected Countries — <strong>Global</strong> Industrial Production<br />
(Year-to-Year Percent Change), 2007-09F<br />
2007 2008F 20009F<br />
World 4.2% 3.5% 3.9%<br />
United States 2.1 1.7 2.5<br />
Japan 2.9 2.3 2.5<br />
Euro Area 2.5 1.9 1.6<br />
United Kingdom 0.3 0.8 0.8<br />
Canada -0.1 -3.0 1.0<br />
China 18.5 16.8 16.5<br />
India 9.0 8.5 10.0<br />
Korea 8.2 7.7 8.0<br />
Brazil 3.0 4.8 4.2<br />
Note: “World” includes 22 countries based on industrial production weights.<br />
Sources: National sources <strong>and</strong> Citi.<br />
Note: Brent crude. Sources: The Economist <strong>and</strong> OECD.<br />
Figure 14. Euro Area, Japan, United Kingdom, <strong>and</strong> United States — Forecasts for 2008 GDP (Left) <strong>and</strong> 2008 Inflation (Right), 2006-Feb 2008.<br />
4.0% 4.0%<br />
3.5<br />
3.0<br />
2.5<br />
2.0<br />
1.5<br />
1.0<br />
0.5<br />
0.5<br />
Jan-06 Apr Jul Oct Jan-07 Apr Jul Oct Jan-08<br />
U.S. Euro U.K. Japan<br />
3.5<br />
3.0<br />
2.5<br />
2.0<br />
1.5<br />
1.0<br />
4.0%<br />
3.5<br />
3.0<br />
2.5<br />
2.0<br />
1.5<br />
1.0<br />
0.5<br />
0.0<br />
-0.5<br />
Jan-06 Apr Jul Oct Jan-07 Apr Jul Oct Jan-08<br />
U.S. Euro U.K. Japan<br />
4.0%<br />
3.5<br />
3.0<br />
2.5<br />
2.0<br />
1.5<br />
1.0<br />
0.5<br />
0.0<br />
-0.5<br />
Source: Citi.<br />
11
February 28, 2008<br />
<strong>Global</strong> <strong>Economic</strong> <strong>Outlook</strong> <strong>and</strong> <strong>Strategy</strong><br />
Figure 15. Short Rates (End of Period), as of Feb 28, 2008<br />
Current 1Q 08 2Q 08 3Q 08 4Q 08 1Q 09<br />
United States 3.00 % 2.50 % 2.00 % 2.00 % 2.00 % 2.00 %<br />
Japan 0.50 0.50 0.50 0.50 0.75 0.75<br />
Euro Area 4.00 4.00 3.75 3.50 3.50 3.50<br />
Canada 4.00 % 3.50 % 3.00 % 3.00 % 3.00 % 3.00 %<br />
Australia 7.00 7.25 7.50 7.50 7.50 7.50<br />
New Zeal<strong>and</strong> 8.25 8.25 8.25 8.25 8.25 8.25<br />
Denmark 4.25 % 4.25 % 4.00 % 3.75 % 3.75 % 3.75 %<br />
Norway 5.25 5.25 5.50 5.50 5.75 5.75<br />
Sweden 4.25 4.25 4.25 4.25 4.00 3.75<br />
Switzerl<strong>and</strong> 2.75 2.75 2.75 2.75 2.75 2.75<br />
United Kingdom 5.25 5.25 4.75 4.50 4.25 4.25<br />
China 7.47 % 7.74 % 7.74 % 7.74 % 7.74 % 7.74 %<br />
Source: Citi.<br />
Figure 16. 10-Year Yield Forecasts (Period Average), as of Feb 28, 2008<br />
Current 1Q 08 2Q 08 3Q 08 4Q 08 1Q 09<br />
United States 3.71 % 3.65 % 3.60 % 3.75 % 3.85 % 4.00 %<br />
Japan 1.43 1.50 1.70 1.70 1.80 1.80<br />
Euro Area 4.00 4.00 4.00 4.00 4.10 4.25<br />
Canada 3.73 % 3.90 % 3.90 % 4.00 % 4.05 % 4.15 %<br />
Australia 6.44 6.50 6.50 6.35 6.35 6.25<br />
New Zeal<strong>and</strong> 6.40 6.50 6.50 6.25 6.25 6.05<br />
Denmark 4.11 % 4.10 % 4.05 % 4.05 % 4.15 % 4.30 %<br />
Norway 4.40 4.63 4.76 4.90 5.08 5.23<br />
Sweden 4.09 4.10 4.14 4.25 4.50 4.59<br />
Switzerl<strong>and</strong> 3.00 2.80 2.90 2.95 3.15 3.35<br />
United Kingdom 4.60 4.55 4.55 4.55 4.65 4.79<br />
Notes: Bond yields measured on local market basis (semi-annual for the United States, United Kingdom, Canada, Australia, <strong>and</strong> New Zeal<strong>and</strong>; annual for the<br />
rest). The 10-year yield for the euro area is the Bund yield. Source: Citi.<br />
Figure 17. 10-Year Yield Spreads (Period Average), as of Feb 28, 2008<br />
Spread vs. US$<br />
Spread vs. Germany<br />
Current 1Q 08 2Q 08 3Q 08 4Q 08 1Q 09 Current 1Q 08 2Q 08 3Q 08 4Q 08 1Q 09<br />
United States NA NA NA NA NA NA -20 bp -21 bp -21 bp -11 bp -21 bp -21 bp<br />
Japan -241 bp -229 bp -209 bp -219 bp -209 bp -224 bp -261 -250 -230 -230 -230 -245<br />
Euro Area 20 21 21 11 21 21 NA NA NA NA NA NA<br />
Canada -13bp 15bp 15bp 15bp 20bp 15bp -23bp -6bp -6bp 4bp -1bp -6bp<br />
Australia 259 275 275 250 250 225 245 261 261 245 235 210<br />
New Zeal<strong>and</strong> 263 275 275 240 240 205 249 261 261 235 225 189<br />
France 32 bp 33 bp 31 bp 20 bp 29 bp 29 bp 12 bp 12 bp 10 bp 9 bp 8 bp 8 bp<br />
Italy 61 61 59 46 56 54 41 40 38 35 35 33<br />
Spain 34 36 35 25 33 31 14 15 14 14 12 10<br />
Netherl<strong>and</strong>s 29 30 29 18 27 27 9 9 8 7 6 6<br />
Belgium 47 46 39 27 36 34 27 25 18 16 15 13<br />
Denmark 31 bp 31 bp 26 bp 16 bp 26 bp 26 bp 11 bp 10 bp 5 bp 5 bp 5 bp 5 bp<br />
Norway 55 84 97 101 119 119 56 63 76 90 98 98<br />
Sweden 24 31 35 36 61 55 10 10 14 25 40 34<br />
Switzerl<strong>and</strong> -84 -99 -89 -94 -74 -69 -104 -120 -110 -105 -95 -90<br />
United Kingdom 85 80 80 70 80 79 65 60 60 60 60 60<br />
NA Not applicable. Note: Spreads calculated on annual basis (except those of the United Kingdom, Canada, Australia <strong>and</strong> New Zeal<strong>and</strong> over the United States).<br />
Source: Citi.<br />
12
February 28, 2008<br />
<strong>Global</strong> <strong>Economic</strong> <strong>Outlook</strong> <strong>and</strong> <strong>Strategy</strong><br />
Figure 18. Foreign Exchange Forecasts (End of Period), as of Feb 28, 2008<br />
vs USD<br />
vs EUR<br />
Current Mar-08 Jun-08 Sep-08 Dec-08 Mar-09 Current Mar-08 Jun-08 Sep-08 Dec-08 Mar-09<br />
United States NA NA NA NA NA NA 1.51 1.51 1.53 1.51 1.48 1.45<br />
Japan 106 105 105 109 112 112 160 159 161 165 166 162<br />
Euro Area 1.51 1.51 1.53 1.51 1.48 1.45 NA NA NA NA NA NA<br />
Canada 0.98 1.01 1.02 1.03 1.04 1.04 1.48 1.53 1.56 1.56 1.54 1.51<br />
Australia 0.94 0.92 0.95 0.92 0.90 0.88 1.60 1.64 1.61 1.64 1.64 1.65<br />
New Zeal<strong>and</strong> 0.81 0.80 0.78 0.76 0.75 0.73 1.86 1.89 1.96 1.99 1.97 1.99<br />
Norway 5.20 5.07 4.84 4.83 4.90 4.97 7.87 7.65 7.40 7.30 7.25 7.20<br />
Sweden 6.20 6.16 5.95 6.03 6.22 6.41 9.37 9.30 9.10 9.10 9.20 9.30<br />
Switzerl<strong>and</strong> 1.06 1.06 1.04 1.03 1.03 1.03 1.60 1.60 1.59 1.56 1.52 1.50<br />
United Kingdom 1.98 1.97 1.96 1.95 1.92 1.93 0.76 0.77 0.78 0.77 0.77 0.75<br />
China 7.11 7.06 7.00 6.90 6.75 6.55 10.8 10.7 10.7 10.7 10.0 9.5<br />
India 39.9 39.0 38.5 38.0 37.5 37.0 60.3 58.9 58.9 57.4 55.5 53.7<br />
Korea 938 960 960 940 920 870 1418 1450 1469 1419 1362 1262<br />
Pol<strong>and</strong> 2.33 2.34 2.42 2.44 2.42 2.43 3.52 3.53 3.70 3.68 3.58 3.52<br />
Russia 24.1 24.2 23.9 24.1 24.3 24.6 36.4 36.5 36.6 36.3 36.0 35.7<br />
South Africa 7.56 7.70 7.90 8.10 8.00 8.10 11.43 11.63 12.09 12.23 11.84 11.75<br />
Turkey 1.18 1.22 1.24 1.27 1.29 1.32 1.79 1.84 1.90 1.92 1.91 1.91<br />
Brazil 1.67 1.79 1.80 1.80 1.80 1.85 2.52 2.70 2.75 2.72 2.66 2.68<br />
Mexico 10.7 10.8 10.9 11.0 11.0 11.0 16.2 16.3 16.7 16.6 16.2 16.0<br />
Source: Citi.<br />
Figure 19. Foreign Exchange Forecasts (End of Period), as of Feb 28, 2008<br />
vs JPY<br />
Current Mar-08 Jun-08 Sep-08 Dec-08 Mar-09<br />
United States 106 105 105 109 112 112<br />
Japan NA NA NA NA NA NA<br />
Euro Area 160 159 161 165 166 162<br />
Canada 108 104 103 106 108 108<br />
Australia 100 97 100 100 101 99<br />
New Zeal<strong>and</strong> 86.1 84.0 81.9 82.8 84.0 81.8<br />
Norway 20.4 20.7 21.7 22.5 22.9 22.6<br />
Sweden 17.1 17.0 17.7 18.1 18.0 17.5<br />
Switzerl<strong>and</strong> 100 99 101 105 109 108<br />
United Kingdom 211 207 206 213 215 216<br />
China 15 15 15 15 17 17<br />
India 2.66 2.69 2.73 2.87 2.99 3.03<br />
Korea 8.84 9.14 9.14 8.62 8.21 7.77<br />
Pol<strong>and</strong> 45.6 44.9 43.4 44.7 46.3 46.1<br />
Russia 4.4 4.3 4.4 4.5 4.6 4.5<br />
South Africa 14.0 13.6 13.3 13.5 14.0 13.8<br />
Turkey 89.6 86.1 84.7 85.8 86.8 84.8<br />
Brazil 63.6 58.7 58.3 60.6 62.2 60.5<br />
Mexico 9.9 9.7 9.6 9.9 10.2 10.2<br />
Source: Citi.<br />
13
February 28, 2008<br />
<strong>Global</strong> <strong>Economic</strong> <strong>Outlook</strong> <strong>and</strong> <strong>Strategy</strong><br />
Stephen Halmarick<br />
011-612 8225-6043<br />
stephen.halmarick<br />
@citi.com<br />
Currency <strong>Outlook</strong><br />
With the depth of the near-term deceleration of the U.S. economy still in doubt, <strong>and</strong><br />
financial conditions continuing to deteriorate, we expect downward pressure on the<br />
U.S. dollar to persist in coming months. The dollar downtrend should, however,<br />
remain modest. Aggressive action by the Federal Reserve should help to stabilize<br />
financial conditions <strong>and</strong> prospects for growth in coming quarters. In addition, the<br />
outlook for growth in the euro area appears to be deteriorating, <strong>and</strong> this change in<br />
cyclical outlooks should eventually turn the tide on USD/EUR.<br />
The USD will likely depreciate modestly relative to the Japanese yen in the first half of<br />
2008. Japan appears to be the least affected by the money <strong>and</strong> credit market strains<br />
among the major economies <strong>and</strong> should benefit from any further heightened risk<br />
aversion. However, we expect the JPY to start weakening against the USD in the second<br />
half of the year. As global economic <strong>and</strong> financial risks wane, in part thanks to policy<br />
actions in major countries, Japanese households are likely to resume diversifying their<br />
portfolios into foreign currency denominated assets, weighing down the yen.<br />
We continue to expect the British pound to be one of the weakest of the G10 currencies in<br />
2008. While markets currently are discounting an easing cycle, we expect growth is likely<br />
to undershoot MPC forecasts, thus opening up scope for an extended easing cycle, even<br />
with the short-term inflation worries.<br />
Led by the renminbi, emerging Asian currencies continued to gain ground during the<br />
past month. A broad pickup in inflation has generated incentives for central banks<br />
across the region to tolerate greater exchange rate flexibility — especially for the<br />
Taiwanese dollar <strong>and</strong> Vietnamese dong. We continue to expect emerging Asian<br />
currencies to lead the next leg of U.S. dollar weakness. However, we also warn<br />
against excessive optimism regarding the outlook of Asian currencies, given that the<br />
expected slowing in exports will likely add caution to currency policymaking. We<br />
maintain our expectation of 7.5% renminbi appreciation against the USD, which is<br />
less aggressive than market expectations.<br />
We continue to favor the AUD among commodity currencies. Markets could be<br />
surprised by the extent to which the Reserve Bank of Australia (RBA) tightens<br />
monetary policy in coming months. We project a tightening of at least 50 basis points<br />
by May. Indeed, further tightening beyond that could be required to ensure inflation<br />
returns to the 2%-3% target zone. Along with rising interest rates, gains in key<br />
Australian commodity prices, as indicated by the recent 65% price rise in iron ore<br />
exports to Japan for the coming financial year, should continue to provide the AUD<br />
with fundamental support.<br />
In the near term, the NZD should remain in a range, as the Reserve Bank of New<br />
Zeal<strong>and</strong> (RBNZ) holds monetary policy steady, balancing the inflation risks from<br />
higher dairy prices <strong>and</strong> a tight labor market against clear signs of a slowdown in the<br />
housing sector. The CAD is also likely to remain range-bound in the near term, with<br />
some modest retreat from parity amid a slowing Canadian economy, ongoing financial<br />
market strains, <strong>and</strong> tighter credit conditions. While the BoC is now expected to lower<br />
policy rates by 100 basis points by midyear, this will only match the expected easing in<br />
the United States. As a result, continued commodity price strength <strong>and</strong> the weak U.S.<br />
economic outlook argue against a meaningful depreciation of the CAD.<br />
The Swiss franc (CHF) has been a star performer so far this year, rising about 4% in<br />
trade-weighted terms, <strong>and</strong> it is likely to remain strong. Markets have scaled back the<br />
amount of Swiss National Bank (SNB) easing priced in for the second <strong>and</strong> third<br />
quarters, as the economy holds up better than expected <strong>and</strong> inflation remains above the<br />
14
February 28, 2008<br />
<strong>Global</strong> <strong>Economic</strong> <strong>Outlook</strong> <strong>and</strong> <strong>Strategy</strong><br />
SNB’s 2% target ceiling. Therefore, the SNB will likely keep rates on hold in coming<br />
months, unless the CHF rises more sharply. The outlook for the CHF also should be<br />
reinforced by the currency’s longst<strong>and</strong>ing safe-haven status, with a strong <strong>and</strong> positive<br />
correlation between equity market volatility <strong>and</strong> the trade-weighted CHF.<br />
While the Norges Bank has recently expressed concerns about money market strains<br />
<strong>and</strong> heightened global economic uncertainty, we still expect further monetary policy<br />
tightening to combat inflation risks amid heightened capacity pressures <strong>and</strong><br />
accelerating wages. Oil prices are a double-edged sword for the NOK. Recent high<br />
prices have supported the NOK, but the sharp rise over the past year also raises the<br />
risk of a correction. In Sweden, the Riksbank is expected to keep rates steady near<br />
term, following the surprise rate hike in February. The next move is likely to be a cut<br />
around yearend to offset the negative effects from the credit crisis <strong>and</strong> weakening U.S.<br />
<strong>and</strong> global economic growth. But interest rate spreads remain in the SEK’s favor.<br />
Also, while periods of financial instability normally do not favor the SEK, the SEK<br />
should strengthen again once the dust settles in financial markets.<br />
Currencies across CEEMEA continue to feel the effects of conflicting forces. Amid<br />
ongoing financing concerns, currencies of external deficit countries such as South Africa<br />
<strong>and</strong> Romania remain under pressure relative to the EUR. Inflationary pressures across the<br />
region, however, continue to put upward pressure on domestic interest rates, providing<br />
some support to currencies of countries with better economic prospects, including Pol<strong>and</strong>,<br />
Israel, <strong>and</strong> Slovakia. Slovakia is also experiencing capital inflows in anticipation of a<br />
revaluation of the koruna’s central parity against the EUR next quarter as part of the euroadoption<br />
process. Hungary, by ab<strong>and</strong>oning its b<strong>and</strong>, reversed much of its January selloff.<br />
Latin American currencies have so far shown no vulnerability to deteriorating global<br />
prospects. In fact, with the United States cutting rates <strong>and</strong> commodity prices making<br />
new highs, Latin currencies have continued to appreciate. Inflationary challenges in<br />
Chile, Peru, <strong>and</strong> Colombia will likely keep those central banks vigilant, with a bias<br />
toward maintaining a hawkish discourse, <strong>and</strong> possibly even hiking rates. Rate cuts are<br />
likely in Mexico, but not until September, given the likelihood that yearly inflation will<br />
increase above the top of Banxico’s b<strong>and</strong> during most of the second quarter.<br />
Figure 20. Currency Recommendations, as of Feb 28, 2008<br />
Current<br />
3-Month<br />
Forecast<br />
Annual Return vs<br />
FWD Implied Vol.<br />
12-Month<br />
Forecast<br />
Annual Return vs<br />
FWD Implied Vol.<br />
United States NA NA NA NA NA NA NA<br />
Japan 106 105 1.9 10.7 112 -7.2 9.6<br />
Euro Area 1.51 1.52 4.1 9.1 1.46 -2.1 8.8<br />
Canada 0.98 1.02 -14.4 11.6 1.04 -5.2 10.9<br />
Australia 0.94 0.94 3.5 13.1 0.89 -0.7 12.7<br />
New Zeal<strong>and</strong> 0.81 0.80 -6.3 14.8 0.74 -3.6 14.8<br />
Norway 5.20 4.92 25.3 12.2 4.94 8.2 11.8<br />
Sweden 6.20 6.02 13.0 11.8 6.35 -0.5 11.3<br />
Switzerl<strong>and</strong> 1.06 1.05 4.7 10.0 1.03 2.7 9.0<br />
United Kingdom 1.98 1.96 -1.7 8.6 1.93 -0.4 8.5<br />
China 7.11 7.02 -5.2 3.4 6.62 -2.2 4.9<br />
India 39.9 38.7 12.7 6.0 37.2 7.7 6.4<br />
Korea 938 960 -8.8 5.3 887 6.0 4.9<br />
Pol<strong>and</strong> 2.33 2.39 -7.6 11.0 2.43 -0.7 10.5<br />
Russia 24.1 24.0 3.7 5.9 24.5 1.4 6.7<br />
South Africa 7.56 7.83 -5.5 19.6 8.07 2.2 19.3<br />
Turkey 1.18 1.23 -3.9 14.1 1.31 1.9 16.2<br />
Brazil 1.67 1.80 -23.7 13.6 1.83 -2.6 14.6<br />
Mexico 10.7 10.9 -2.3 5.3 11.0 1.6 6.6<br />
Source: Citi.<br />
15
February 28, 2008<br />
<strong>Global</strong> <strong>Economic</strong> <strong>Outlook</strong> <strong>and</strong> <strong>Strategy</strong><br />
<strong>Global</strong> Equity <strong>Strategy</strong><br />
Robert Buckl<strong>and</strong><br />
011-44-20-7986-3947<br />
robert.buckl<strong>and</strong><br />
@citi.com<br />
Our economics colleagues now forecast recessionary conditions in the United States.<br />
What have previous U.S. recessions meant for global corporate earnings <strong>and</strong> stock<br />
prices <strong>and</strong> what are the implications for the current situation<br />
Earnings Impact<br />
Figure 21 plots U.S. <strong>and</strong> world ex-U.S. trailing earnings growth for the listed<br />
corporate sector, with shaded regions denoting U.S. recessions. Given reporting<br />
delays, earnings will tend to lag the economic data, so this series does not yet reflect<br />
the recent earnings collapse among financials.<br />
Earnings are much more volatile than real GDP given the impact of financial <strong>and</strong><br />
operational leverage. For example, annual U.S. earnings growth has ranged from<br />
-40% to +40% over a period when real U.S. GDP growth has ranged between -3% <strong>and</strong><br />
+8%. Although GDP seems to have become less volatile, corporate earnings have<br />
become more volatile. There is no sign of the “great moderation” here. Figure 21 also<br />
shows that world ex-U.S. earnings growth tracks U.S. earnings closely but with even<br />
greater volatility recently. The key message is clear. U.S. recessions have been bad<br />
news for the United States <strong>and</strong> world earnings.<br />
In the past, U.S. recessions have been associated with contractions of at least 20% in<br />
both U.S. <strong>and</strong> world ex-U.S. earnings. To put this into context, the IBES consensus<br />
expects U.S. <strong>and</strong> global earnings growth of 14% <strong>and</strong> 13%, respectively, in 2008. So,<br />
investors should prepare themselves for a period of earnings downgrades.<br />
U.S. Recessions <strong>and</strong> <strong>Global</strong> Equities<br />
If the United States is heading into recession, the outlook for global corporate<br />
earnings looks bleak. What does that mean for share prices<br />
Figure 22 shows that, on average, global earnings have fallen by 31% around U.S.<br />
recessions. Share prices have fallen by slightly more (36%). As for the current<br />
situation, the 15% share price decline from last July’s high suggests that, even though<br />
earnings are only just starting to roll over, global equities are already halfway through<br />
Figure 21. U.S. <strong>and</strong> World Ex-U.S. Earnings Growth (Percent),<br />
1990-2007<br />
Figure 22. World Market Price <strong>and</strong> Earnings Decline in U.S.<br />
Recessions (Percent), 1973-2007<br />
60<br />
60<br />
0<br />
0<br />
40<br />
40<br />
-10<br />
-10<br />
20<br />
20<br />
-20<br />
-20<br />
0<br />
0<br />
-30<br />
-30<br />
-20<br />
-20<br />
-40<br />
-40<br />
-40<br />
-60<br />
70 72 74 76 78 80 82 84 86 88 90 92 94 96 98 00 02 04 06 08<br />
US World ex-US<br />
-40<br />
-60<br />
-50<br />
-60<br />
Price<br />
Earnings<br />
Mid 70s Early 80s Early 90s Early 00s Average Now<br />
-50<br />
-60<br />
Note: Shaded regions denote recession. Sources: MSCI <strong>and</strong> Datastream.<br />
Sources: MSCI <strong>and</strong> Datastream.<br />
16
February 28, 2008<br />
<strong>Global</strong> <strong>Economic</strong> <strong>Outlook</strong> <strong>and</strong> <strong>Strategy</strong><br />
the selloff associated with a typical U.S. recession <strong>and</strong> are rapidly approaching the<br />
mild correction seen in the early 1980s (19%).<br />
Valuations<br />
Could it be that the recent fall in prices has already priced a U.S. recession into global<br />
equities It seems that the bear market associated with the last U.S. recession was as<br />
severe as it was because global equities traded at a record 35 times PE heading into<br />
the worst earnings slump in 40 years. Now, global equities trade on a much more<br />
reasonable 15 times trailing PE, similar to valuations at the bottom of the early 1990s<br />
correction. Even if earnings do fall significantly, current valuations look reasonable.<br />
We also point out that global equities entered each of the last two recessions with a<br />
major valuation bubble. In 1990, Japan traded on a PE of 52 times. In 2000, global<br />
Technology (TMT) traded on a PE of 65 times. Both accounted for around 40% of the<br />
total global market cap <strong>and</strong> then bore the brunt of the subsequent selloff. This spared<br />
the rest of the global equity market from the worst of the pain. It is difficult to point to<br />
any such obvious major valuation anomalies this time round. Emerging markets have<br />
performed strongly, but they are hardly in bubble territory.<br />
Interest Rates<br />
Thus, the current valuation case in favor of global equities is better than it was during<br />
the last recession but still probably not enough to counter the impact of major<br />
earnings downgrades. Perhaps it is still too early to buy back into equities — stick<br />
with defensive cash <strong>and</strong> government bonds instead.<br />
But there is a problem with this defensive strategy — interest rates are already low.<br />
U.S. real rates have gone negative much earlier than in the early 1980s, 1990s, or<br />
2000s downturns. Not only do negative real rates help to reduce the severity of the<br />
U.S. recession, but they also undermine the attractiveness of cash as an asset class.<br />
The other obvious place to take refuge is government bonds. But value here also looks<br />
poor.<br />
Market Timing<br />
How do global equities perform around a U.S. recession Previously, the worst<br />
performance through the whole period has been in the first half. The best performance<br />
has been during the second half. What about now We start the clock ticking from<br />
January of this year. History suggests that the recession will last around a year. It also<br />
suggests that investors should not be in too much of a hurry to buy. Falling rates <strong>and</strong><br />
increasingly attractive valuations are not enough to counter the rising wave of bad<br />
economic <strong>and</strong> earnings news in the first half of the recession. At least the selloff this<br />
year is already approaching the average selloff for the first half, although it is still far<br />
from the worst.<br />
This supports our general suspicion that, despite aggressive Fed cuts <strong>and</strong> cheap<br />
valuations against government bonds, global equities may struggle to find a floor in<br />
the first half of this year as the barrage of poor economic <strong>and</strong> earnings news builds.<br />
Later in the year, the economic <strong>and</strong> earnings data should be just as bad (if not worse),<br />
but equity market expectations will be more realistic <strong>and</strong> the Fed’s magic will have<br />
had more time to work. This could leave global equities better placed later in the year<br />
to enjoy the rally traditionally seen in the second half of a U.S. recession.<br />
17
February 27, 2008<br />
<strong>Global</strong> <strong>Economic</strong> <strong>Outlook</strong> <strong>and</strong> <strong>Strategy</strong><br />
Figure 23. Long-Term Forecasts (Calendar Average), as of Feb 28, 2008<br />
GDP CPI Short-Term Interest Rates<br />
2008 2009 2010 2011 2012 2008 2009 2010 2011 2012 2008 2009 2010 2011 2012<br />
United States 1.6% 2.1% 2.7% 2.7% 2.7% 3.6% 2.0% 2.0% 2.0% 2.0% 2.35% 2.00% 3.50% 4.25% 4.25%<br />
Japan 1.9 1.7 2.0 2.0 1.2 0.7 0.3 0.5 0.6 2.3 0.56 0.88 1.38 1.75 2.00<br />
Euro Area 1.7 1.8 2.0 2.0 2.0 2.3 1.8 1.8 1.8 1.8 3.65 3.50 3.75 3.75 3.75<br />
Canada 1.0 1.5 2.2 2.4 2.5 1.4 2.0 2.0 2.1 2.1 3.15 3.00 3.25 3.50 3.50<br />
Australia 2.7 3.4 3.5 3.3 3.3 3.3 2.8 2.5 2.5 2.5 7.45 7.05 6.00 5.50 5.50<br />
New Zeal<strong>and</strong> 2.1 2.0 3.0 3.0 3.0 2.8 2.4 2.3 2.3 2.3 8.25 7.80 7.00 6.75 6.50<br />
Germany 1.6 1.9 2.1 1.7 1.7 1.8 1.6 1.6 1.5 1.5<br />
France 1.6 1.6 2.0 2.3 2.3 2.2 1.4 1.6 1.6 1.5<br />
Italy 0.8 1.4 1.2 1.3 1.2 2.5 1.8 1.9 1.8 1.7<br />
Spain 2.1 2.2 2.1 2.2 2.1 3.4 2.3 2.4 1.7 1.8<br />
Norway 4.0 3.0 2.5 2.5 2.5 3.4 2.5 2.5 2.5 2.5<br />
Sweden 2.3 2.2 2.3 2.3 2.3 3.4 2.3 2.1 2.1 2.0<br />
Switzerl<strong>and</strong> 2.2 2.0 2.2 2.0 1.9 1.5 0.8 1.1 0.8 0.8 2.90 3.00 3.00 3.00 3.00<br />
United Kingdom 1.7 1.9 2.6 2.8 2.9 2.5 2.0 2.2 1.9 2.1 4.75 4.30 4.90 5.00 5.25<br />
China 10.5 10.0 10.5 9.8 9.0 5.0 4.0 4.2 3.5 4.0 7.7 7.7 8.0 8.0 8.3<br />
India 8.3 8.5 8.7 9.5 9.5 4.3 4.0 4.0 4.0 3.5 6.0 6.0 6.0 5.5 5.5<br />
Korea 4.6 4.8 4.8 4.8 4.8 3.3 2.5 2.5 2.5 2.5 4.9 5.0 5.2 5.3 5.3<br />
Pol<strong>and</strong> 5.0 4.7 5.2 5.9 5.5 4.2 3.0 2.3 2.5 2.7 5.5 5.5 5.5 5.5 5.5<br />
Russia 6.6 6.5 6.5 6.5 6.6 12.9 8.9 7.0 5.9 4.8 11.0 9.5 8.3 7.5 6.8<br />
South Africa 3.5 4.3 5.3 5.1 5.5 6.1 5.4 5.5 5.0 5.2 10.3 8.9 9.0 9.3 9.0<br />
Turkey 4.2 5.2 5.8 6.0 6.2 7.8 6.5 5.1 4.5 4.2 16.3 13.8 11.1 10.0 9.2<br />
Brazil 4.4 4.0 4.0 4.0 4.0 4.7 4.5 4.1 4.0 3.7 11.3 10.5 9.8 9.3 8.5<br />
Mexico 2.9 3.7 4.1 3.8 4.3 3.9 3.5 3.2 3.1 3.1 7.3 6.5 6.5 6.5 6.5<br />
Note: For Norway, mainl<strong>and</strong> GDP. For India inflation forecast is for WPI.<br />
Source: Citi forecasts.<br />
18
February 27, 2008<br />
<strong>Global</strong> <strong>Economic</strong> <strong>Outlook</strong> <strong>and</strong> <strong>Strategy</strong><br />
Figure 24. Long-Term Forecasts (Calendar Average), as of Feb 28, 2008<br />
Ten-Year Yields Exchange Rate vs. U.S. Dollar Exchange Rate vs. Euro<br />
2008 2009 2010 2011 2012 2008 2009 2010 2011 2012 2008 2009 2010 2011 2012<br />
United States 3.75% 4.25% 4.75% 5.00% 5.00% NA NA NA NA NA 1.50 1.45 1.47 1.50 1.52<br />
Japan 1.68 1.90 2.50 2.75 2.25 108 110 100 95 95 162 160 147 143 144<br />
Euro Area a 4.05 4.40 4.40 4.40 4.40 1.50 1.45 1.47 1.50 1.52 NA NA NA NA NA<br />
Canada 3.91 4.41 4.75 4.90 4.90 1.04 1.06 1.08 1.13 1.15 1.56 1.54 1.59 1.70 1.75<br />
Australia b 6.35 6.40 6.75 6.50 6.50 0.92 0.87 0.82 0.78 0.78 1.63 1.67 1.79 1.92 1.95<br />
New Zeal<strong>and</strong> c 6.35 6.30 6.75 6.75 6.75 0.77 0.72 0.69 0.66 0.65 1.95 2.01 2.13 2.27 2.34<br />
Denmark 4.10 4.45 4.45 4.45 4.45 NA NA NA NA NA NA NA NA NA NA<br />
Norway 4.85 5.30 5.20 5.10 5.10 4.99 5.00 4.90 4.74 4.61 7.48 7.25 7.21 7.11 7.01<br />
Sweden 4.25 4.65 4.65 4.65 4.65 6.13 6.31 6.16 6.00 5.92 9.20 9.15 9.05 9.00 9.00<br />
Switzerl<strong>and</strong> 3.20 3.50 3.50 3.50 3.50 1.04 1.11 1.10 1.08 1.06 1.56 1.61 1.62 1.62 1.61<br />
United Kingdom d 4.75 5.10 5.10 5.10 5.10 1.95 1.93 2.10 2.17 2.20 0.77 0.75 0.70 0.69 0.69<br />
China e 4.1 4.0 4.5 5.0 5.5 6.98 6.35 5.89 5.58 5.40 10.5 9.2 8.7 8.4 8.2<br />
India 7.3 7.5 7.5 7.0 7.0 38.5 36.0 35.0 33.0 31.0 57.8 52.2 51.5 49.5 47.1<br />
Korea e 4.9 5.2 5.5 5.5 5.5 950 890 850 800 800 1425 1291 1250 1200 1216<br />
Pol<strong>and</strong> 5.9 5.7 5.5 5.5 5.4 2.41 2.43 2.32 2.21 2.12 3.61 3.52 3.42 3.32 3.22<br />
Russia 6.6 6.7 6.6 6.6 6.5 24.0 24.5 24.4 24.2 24.0 36.0 35.5 35.9 36.2 36.4<br />
South Africa 8.0 8.1 8.7 9.0 9.3 7.37 8.00 8.20 8.55 8.90 11.05 11.60 12.05 12.83 13.53<br />
Turkey NA NA NA NA NA 1.26 1.34 1.34 1.34 1.34 1.90 1.94 1.97 2.00 2.04<br />
Brazil 10.7 9.7 9.4 9.1 9.0 1.79 1.88 1.93 1.98 2.03 2.69 2.72 2.83 2.96 3.08<br />
Mexico 7.4 7.1 7.2 7.2 7.2 10.9 11.0 11.1 11.3 11.5 16.3 15.9 16.3 17.0 17.5<br />
a<br />
Ten-year bund yield. Exchange rate versus U.S. dollar shows US$/€ . b US$/A$. c US$/NZ$. d US$/£. e Five-year bond yield.<br />
Source: Citi forecasts.<br />
19
February 28, 2008<br />
<strong>Global</strong> <strong>Economic</strong> <strong>Outlook</strong> <strong>and</strong> <strong>Strategy</strong><br />
Robert V. DiClemente<br />
(1-212) 816-9894<br />
robert.diclemente<br />
@citi.com<br />
Peter D’Antonio<br />
Christopher Wieg<strong>and</strong><br />
Steven Wieting<br />
United States<br />
Recessionary conditions may be unfolding in the U.S. economy as the slowdown appears<br />
to be spreading with reinforcement from harsh financial conditions. Policy efforts have<br />
aided liquidity, but credit availability has tightened <strong>and</strong> lower rates have failed to ease<br />
strains on capital markets. With housing activity still declining <strong>and</strong> joblessness creeping<br />
higher, headwinds are forming against a timely <strong>and</strong> sustained return to trend growth<br />
despite a prospective boost from recent fiscal action.<br />
Given the threat of an especially adverse dynamic, Fed officials have turned more<br />
aggressive, <strong>and</strong> are expected to lower the funds rate by another percentage point by<br />
midyear. Nonetheless, any end to rate cuts would likely first require some improvement in<br />
the financial setting, reflected in a revival of risk assets <strong>and</strong> signs that large overhanging<br />
imbalances in housing markets are beginning to clear.<br />
Figure 25. United States — <strong>Economic</strong> Forecast, 2007-09F<br />
<strong>Economic</strong> growth appears to have stalled, reflecting slowdowns in consumer <strong>and</strong> business<br />
spending <strong>and</strong> continued sharp declines in homebuilding. Although many industries exhibit<br />
solid finances <strong>and</strong> have not overreached in recent years, business caution has increased,<br />
mirroring the pronounced retreat in risk appetites among financial markets. Lower equity<br />
prices are threatening to compound pressures on consumers from declining home values<br />
<strong>and</strong> faltering job growth.<br />
The improvement in inflation measures has stalled, but continued Fed easing indicates that<br />
officials still see scope for easing price pressures later this year. Oncoming financial<br />
restraint on dem<strong>and</strong> along with rising slack <strong>and</strong> protracted housing weakness should<br />
impose stiff competitive pressures on firm pricing. As long as inflation expectations<br />
remain checked in this setting, we expect underlying inflation to recede somewhat, aiding<br />
policy flexibility <strong>and</strong> shortening recession.<br />
2007 2008<br />
2007F 2008F 2009F 2Q 3Q 4Q 1QF 2QF 3QF 4QF<br />
GDP SAAR 3.8% 4.9% 0.6% -0.1% 0.9% 3.0% 2.2%<br />
YoY 2.2% 1.6% 2.1% 1.9 2.8 2.5 2.3 1.6 1.1 1.5<br />
Consumption SAAR 1.4 2.8 2.0 0.6 0.6 3.5 1.2<br />
YoY 2.9 1.6 1.8 2.9 3.0 2.5 1.7 1.5 1.7 1.5<br />
Business Investment SAAR 11.0 9.3 7.5 0.3 -1.2 -0.3 0.3<br />
YoY 4.8 3.0 0.7 4.1 5.1 7.4 7.0 3.9 1.5 -0.2<br />
Housing Investment SAAR -11.8 -20.5 -23.9 -23.9 -15.4 -6.4 -1.6<br />
YoY -16.9 -17.9 -0.2 -16.5 -16.5 -18.3 -20.2 -21.0 -17.7 -12.2<br />
Government SAAR 4.1 3.8 2.6 -1.2 1.4 1.7 2.0<br />
YoY 2.1 1.5 1.7 1.9 2.7 2.5 2.3 1.6 1.1 1.0<br />
Exports SAAR 7.5 19.1 3.9 4.9 5.1 5.6 5.1<br />
YoY 7.9 6.7 5.5 7.1 10.3 7.7 8.7 8.1 4.9 5.2<br />
Imports SAAR -2.7 4.4 0.3 0.3 -1.2 2.1 -0.8<br />
YoY 2.0 0.5 1.8 2.0 1.7 1.4 0.5 0.9 0.4 0.1<br />
CPI YoY 2.9 3.6 2.0 2.7 2.4 4.0 4.2 3.7 3.6 2.8<br />
Core CPI YoY 2.3 2.5 2.0 2.3 2.1 2.3 2.5 2.6 2.5 2.4<br />
Unemployment Rate % 4.6 5.4 5.9 4.5 4.7 4.8 5.1 5.3 5.6 5.7<br />
Govt Balance (Fiscal Year) % of GDP -1.1 -3.0 -3.0 — — — — — — —<br />
Assumed WTI Spot Price US$ 72.3 91.6 89.2 65.0 75.5 90.9 93.2 91.6 91.0 90.4<br />
Current Account US$bn -751 -693 -607 -756 -714 -748 -743 -700 -682 -647<br />
% of GDP -5.4 -4.8 -4.1 -5.5 -5.1 -5.3 -5.3 -4.9 -4.7 -4.4<br />
S&P 500 Profits (US$ Per Share) YoY -1.7 -0.6 5.0 9.4 -5.7 -19.2 -9.7 -11.5 1.8 22.4<br />
Notes: F Citi forecast. YoY Year-to-year percent change. SAAR Seasonally adjusted annual rate.<br />
Sources: Bureau of <strong>Economic</strong> Analysis, Bureau of Labor Statistics, I/B/E/S, Treasury Department, Wall Street Journal, <strong>and</strong> Citi.<br />
20
February 28, 2008<br />
<strong>Global</strong> <strong>Economic</strong> <strong>Outlook</strong> <strong>and</strong> <strong>Strategy</strong><br />
Kiichi Murashima<br />
(81-3) 5574-4730<br />
kiichi.murashima<br />
@nikkocitigroup.com<br />
Japan<br />
We expect Japan’s economic growth to stabilize near the potential growth rate of the<br />
economy (slightly below 2%) this year after a bumpy ride in 2007. Last year, higher input<br />
costs including energy costs, the resulting deterioration in the profit outlook for small<br />
firms, <strong>and</strong> the enforcement of the revised Building St<strong>and</strong>ard Law temporarily distorted<br />
economic growth. However, real GDP advanced at an annualized 3.7% in the fourth<br />
quarter, reflecting strong export <strong>and</strong> business investment growth.<br />
Major dem<strong>and</strong> components are likely to exp<strong>and</strong>. Private consumption will likely maintain<br />
modest but stable expansion on somewhat higher income growth in 2008. Business<br />
investment likely will increase amid capacity shortages <strong>and</strong> healthy profits at large firms,<br />
but investment at small firms should be soft. The negative impact of the revised Building<br />
St<strong>and</strong>ard Law on housing has already come to an end. Finally, exports are likely to<br />
maintain slower but solid growth because Japan’s exports are now much more diversified<br />
than in the past. For example, exports to oil-producing countries alone are pushing up<br />
overall exports by almost three percentage points. Exports to Asia will likely slow<br />
gradually as the negative impact of the U.S. slowdown dampens growth in the region.<br />
Underlying inflation will likely remain low in 2008. While year-to-year changes in core<br />
CPI are expected to reach the 1% mark in coming months, this is mostly attributable to<br />
surging energy <strong>and</strong> manufactured food prices. Core inflation adjusted for energy <strong>and</strong> food<br />
will likely remain low against the backdrop of near-trend growth <strong>and</strong> persistent declines in<br />
unit labor costs. Core inflation probably will slip again to about 0.3% by the end of 2008.<br />
We expect the next rate hike by the Bank of Japan (BoJ) to be delayed until the end of<br />
2008 or early 2009. Continued uncertainties surrounding the U.S. economy <strong>and</strong> global<br />
financial markets, combined with ambiguity regarding domestic growth prospects, will<br />
likely continue to dissuade the BoJ from raising policy rates until after the release of its<br />
October economic outlook. BoJ Governor Fukui will step down in March, but the basic<br />
thrust of monetary policy (that is, policy normalization) will be maintained.<br />
Figure 26. Japan — <strong>Economic</strong> Forecast, 2007-09F<br />
2007 2008<br />
2007F 2008F 2009F 2Q 3Q 4Q 1QF 2QF 3QF 4QF<br />
Real GDP YoY 2.1% 1.9% 1.7% 1.7% 1.9% 1.8% 1.4% 2.2% 2.3% 1.9%<br />
SAAR -1.4 1.3 3.7 2.0 2.0 1.5 2.0<br />
Domestic Dem<strong>and</strong> YoY 1.0 1.2 1.4 0.7 0.8 0.4 0.2 1.2 1.7 1.6<br />
SAAR -1.9 -0.7 2.1 1.5 1.8 1.5 1.7<br />
Private Consumption YoY 1.5 1.0 1.3 1.1 2.0 1.1 0.8 0.9 1.1 1.1<br />
SAAR 0.7 0.5 0.8 1.0 1.3 1.2 1.0<br />
Business Investment YoY 2.5 4.2 2.5 0.4 0.7 2.1 3.0 5.3 5.2 3.1<br />
SAAR -6.0 4.5 12.1 2.1 2.9 4.0 3.4<br />
Housing Investment YoY -9.3 0.4 4.8 -3.0 -11.4 -21.4 -13.5 -5.0 6.1 17.8<br />
Public Investment YoY -2.3 -4.6 -3.3 -1.9 1.0 -1.8 -7.0 -4.7 -3.3 -3.3<br />
Exports YoY 8.7 6.6 4.2 7.9 8.6 10.8 8.5 8.2 5.8 3.9<br />
SAAR 4.6 12.1 12.1 5.5 3.3 2.4 4.3<br />
Imports YoY 1.7 1.9 3.0 1.4 1.5 1.9 1.4 1.5 2.3 2.6<br />
SAAR 2.2 -0.5 1.9 2.0 2.5 2.9 2.9<br />
Core CPI YoY 0.0 0.7 0.3 -0.1 -0.1 0.4 0.9 0.8 0.7 0.5<br />
Nominal GDP YoY 1.3 1.4 1.8 1.2 1.1 0.7 0.3 1.5 1.8 2.0<br />
Current Account ¥ tn 25.0 25.0 27.9 26.1 24.9 26.3 26.1 25.2 23.8 24.8<br />
% of GDP 4.8 4.8 5.2 5.1 4.8 5.1 5.0 4.8 4.5 4.7<br />
Unemployment Rate % 3.9 3.9 3.7 3.8 3.8 3.9 3.9 3.9 3.9 3.8<br />
Industrial Production YoY 2.9 2.3 2.5 2.3 2.7 2.8 3.0 3.4 1.7 1.2<br />
Corporate Profits (Fiscal Year) YoY 6.0 4.0 5.0<br />
General Govt. Balance (Fiscal Year) % of GDP -2.8 -3.0 -3.1<br />
F Citi forecast. SAAR Seasonally adjusted annual rate. YoY Year-on-year percentage change. Corporate profits are TSE-I non-financials consolidated recurring profits. Source: Citi.<br />
21
February 28, 2008<br />
<strong>Global</strong> <strong>Economic</strong> <strong>Outlook</strong> <strong>and</strong> <strong>Strategy</strong><br />
José Luis Alzola<br />
(44-20) 7986-3281<br />
jose.alzola<br />
@citi.com<br />
Euro Area<br />
Our GDP growth forecast continues to inch down, following the deterioration in retail<br />
sales <strong>and</strong> many confidence indicators in late 2007 <strong>and</strong> early this year. The economy<br />
entered into a period of slightly subtrend growth, which will extend at least into the third<br />
quarter. In addition to worsening global growth prospects, the downward revisions to GDP<br />
growth — <strong>and</strong> the persistence of downside risks — mainly reflect the disappointing<br />
performance of consumer spending in recent months. Tightening financial conditions,<br />
aggravated since last summer by rising risk premia <strong>and</strong> the impact of higher food prices on<br />
real incomes, is weighing on consumer outlays across the euro area. We also look for<br />
slowing export dem<strong>and</strong> <strong>and</strong> a correction from the tax-induced rise in business fixed<br />
investment in Germany.<br />
Unfavorable base effects <strong>and</strong> the late-2007 jump in food prices are proving more protracted<br />
than expected. Headline inflation probably will remain above 2% until late 2008, assuming<br />
these prices recede only gradually. Despite some well-publicized sizable pay deals, signs<br />
of broad-based wage acceleration are absent, <strong>and</strong> worsening labor market conditions reduce<br />
the probability of a major upturn. The strong euro also is limiting import price inflation.<br />
Thus, we still expect inflation to settle below 2% late this year <strong>and</strong> in 2009, but this<br />
forecast is subject to relatively high uncertainty.<br />
Following the admission that downside risks to growth are materializing, the ECB has<br />
opened the door for an eventual rate cut if inflation starts to slow <strong>and</strong> wage restraint<br />
prevails. The ECB probably will maintain its key policy rate at 4% for now, but we expect<br />
some easing later this year, probably by 50 basis points, with a first 25-basis-point cut in<br />
the second quarter. The ECB staff’s new economic projections (to be released on March 6)<br />
likely will downgrade GDP growth this year to somewhat below trend <strong>and</strong> keep the 2009<br />
inflation projection below target. This combination would be an indication that the ECB is<br />
ready to lower rates if activity indicators continue to weaken in coming months.<br />
Figure 27. Euro Area — <strong>Economic</strong> Forecast, 2007-09F<br />
2007 2008F<br />
2007F 2008F 2009F 2Q 3Q 4QF 1Q 2Q 3Q 4Q<br />
Real GDP YoY 2.6% 1.7% 1.8% 2.5% 2.6% 2.2% 1.7% 1.7% 1.4% 1.6%<br />
SAAR 1.2 2.9 1.7 1.1 1.1 1.8 2.4<br />
Final Domestic Dem<strong>and</strong> YoY 2.2 1.6 1.8 2.2 2.3 1.8 1.6 1.6 1.5 1.8<br />
Private Consumption YoY 1.4 1.4 1.5 1.5 1.6 1.0 1.5 1.3 1.2 1.6<br />
Government Consumption YoY 1.9 1.5 1.4 2.0 2.1 1.7 1.4 1.5 1.4 1.8<br />
Fixed Investment YoY 4.8 2.3 2.9 4.2 4.3 3.6 2.1 2.6 2.2 2.3<br />
- Business Equipment YoY 5.1 1.7 2.8 4.3 4.9 4.9 2.8 2.2 1.2 0.6<br />
- Construction YoY 4.5 2.9 2.8 4.2 3.7 2.5 1.5 3.1 3.3 3.8<br />
Stocks (contrib. to GDP) YoY -0.1 0.1 0.0 -0.4 -0.2 0.2 0.0 0.2 0.1 0.1<br />
Exports YoY 6.1 4.0 4.7 5.8 7.3 4.8 4.7 4.2 3.2 3.7<br />
Imports YoY 5.3 4.3 4.9 4.8 5.9 4.3 4.1 4.8 3.7 4.5<br />
CPI YoY 2.1 2.3 1.8 1.9 1.9 2.9 3.0 2.3 2.1 1.7<br />
Core CPI YoY 2.0 1.9 1.8 1.9 2.0 2.3 2.3 1.9 1.8 1.6<br />
Unemployment Rate (s.a.) % 7.4 7.3 7.3<br />
Current Account Balance € bn 15 15 25<br />
% of GDP 0.2 0.2 0.3<br />
General Gov’t Balance € bn -90 -115 -115<br />
% of GDP -1.0 -1.3 -1.2<br />
Public Debt % of GDP 68.0 67.8 67.3<br />
Gross Operating Surplus YoY 6.4 4.0 4.5<br />
Oil Prices (Brent) $/barrel 72.6 94.1 91.1<br />
F Citi forecast. SAAR Seasonally adjusted annual rate. YoY Year-to-year growth rate. The annual forecasts for GDP <strong>and</strong> its components are consistent with the quarterly (seasonally <strong>and</strong> work-day adjusted)<br />
figures. Sources: Eurostat, national government sources, <strong>and</strong> Citi.<br />
22
February 28, 2008<br />
<strong>Global</strong> <strong>Economic</strong> <strong>Outlook</strong> <strong>and</strong> <strong>Strategy</strong><br />
Jürgen Michels<br />
(44-20) 7986-3294<br />
juergen.michels<br />
@citi.com<br />
Jürgen Michels<br />
(44-20) 7986-3294<br />
juergen.michels<br />
@citi.com<br />
Michael Saunders<br />
(44-20) 7986-3299<br />
michael.saunders<br />
@citi.com<br />
Euro Area<br />
Germany<br />
While German consumption disappointed again at the end of 2007, recent activity <strong>and</strong><br />
confidence data suggest solid growth in the manufacturing sector. With ongoing job<br />
creation <strong>and</strong> rising wages, we continue to forecast a modest recovery in private<br />
consumption in 2008. However, we do not expect excessive wage gains that would be a<br />
threat to price stability. The recently negotiated 5% wage gain in the steel sector probably<br />
will not be the pattern for other sectors, although there is a chance that public sector trade<br />
unions will get a big increase from their 8% wage claim. With the shift to the left in the<br />
recent state elections, the gr<strong>and</strong> coalition probably will ease fiscal policy somewhat <strong>and</strong> is<br />
unlikely to implement structural reforms before the 2009 general election.<br />
France<br />
The moderation in French GDP growth at the end of 2007 was in line with expectations, but<br />
final domestic dem<strong>and</strong> surprised to the upside due to a pickup in capital spending growth.<br />
Buoyant construction activity is likely to boost investment growth at the beginning of 2008,<br />
but tighter financing conditions probably will lead to moderation in the rest of the year.<br />
However, the plunge in consumer confidence suggests that private consumption growth is<br />
likely to moderate further in early 2008. Furthermore, sluggish export growth probably will<br />
cap GDP growth in 2008. As the French government is unlikely to find support for<br />
undermining the value of the euro, President Nicolas Sarkozy’s administration probably will<br />
have to ease fiscal policy to keep growth from moderating, which could lead to further<br />
deterioration of the government’s public support.<br />
Italy<br />
Italian GDP growth probably sank into negative territory in the fourth quarter, prompting<br />
us to lower our 2008 forecast to well below trend. The expansion continues to<br />
underperform that of the euro area, reflecting worsening export performance <strong>and</strong> weak<br />
consumption. Political uncertainty — the government had to call snap elections after<br />
losing a confidence vote — is also making a dent in business <strong>and</strong> consumer confidence,<br />
<strong>and</strong> has virtually eliminated the chances of new reforms in the near term. The 2008 budget<br />
proposal was less ambitious than that of 2007. The implementation of the welfare accord is<br />
postponed, fiscal consolidation is diluted, <strong>and</strong> spending cuts are delayed. On a positive<br />
note, unemployment reached a record low in 2007.<br />
Figure 28. Germany, France, <strong>and</strong> Italy — <strong>Economic</strong> Forecast, 2007-09F<br />
Germany France Italy<br />
2007F 2008F 2009F 2007F 2008F 2009F 2007F 2008F 2009F<br />
Real GDP YoY 2.6% 1.6% 1.9% 1.9% 1.6% 1.6% 1.6% 0.8% 1.4%<br />
Final Domestic Dem<strong>and</strong> YoY 1.2 1.0 1.4 2.3 1.8 2.0 1.7 1.2 1.3<br />
Private Consumption YoY -0.5 1.0 1.2 2.0 1.6 1.9 1.8 0.8 1.4<br />
Fixed Investment YoY 5.3 1.1 2.6 3.9 3.0 3.1 2.9 2.3 2.2<br />
Exports YoY 8.0 5.2 6.0 2.7 1.1 2.8 2.1 0.6 3.2<br />
Imports YoY 5.0 4.0 5.9 3.6 2.1 3.7 2.3 1.5 2.9<br />
CPI YoY 2.1 1.8 1.6 1.5 2.2 1.4 2.2 2.5 1.8<br />
Unemployment Rate % 8.4 7.8 7.6 8.1 8.0 8.0 6.0 6.1 6.1<br />
Current Account bn 160.8 170.8 174.3 -23.5 -28.3 -30.3 -30.5 -25.0 -25.0<br />
% of GDP 6.6 6.8 6.8 -1.5 -1.7 -1.6 -2.0 -1.5 -1.5<br />
General Govt. Balance bn 0.4 -12.7 -17.6 -48.2 -55.8 -55.5 -35.7 -43.5 -48.0<br />
% of GDP 0.0 -0.5 -0.7 -2.6 -2.9 -2.8 -2.3 -2.7 -2.9<br />
General Govt. Debt % of GDP 62.7 61.3 60.6 66.8 67.6 68.1 104.5 103.0 102.4<br />
Gross Trading Profits YoY 6.9 3.5 6.5 4.1 2.6 3.8 5.0 3.5 3.6<br />
F Citi forecast. YoY Year-to-year growth rate. Note: The German annual figures are derived from quarterly Bundesbank data, <strong>and</strong> thus, adjusted for working days. The forecasts for GDP <strong>and</strong> its<br />
components are calendar adjusted. Sources: Deutsche Bundesbank, Statistisches Bundesamt, <strong>and</strong> Citi.<br />
23
February 28, 2008<br />
<strong>Global</strong> <strong>Economic</strong> <strong>Outlook</strong> <strong>and</strong> <strong>Strategy</strong><br />
José Luis Alzola<br />
(44-20) 7986-3281<br />
jose.alzola<br />
@citi.com<br />
Jürgen Michels<br />
(44-20) 7986-3294<br />
juergen.michels<br />
@citi.com<br />
Tina Mortensen<br />
(44-20) 7986-3284<br />
tina.mortensen<br />
@citi.com<br />
Euro Area: Others<br />
Spain<br />
Spanish GDP growth remained surprisingly strong at 0.8% in the fourth quarter (not<br />
annualized). However, a number of activity indicators declined sharply in December <strong>and</strong><br />
January, suggesting a significant loss of momentum, particularly of domestic dem<strong>and</strong>.<br />
Residential construction continues to moderate <strong>and</strong> probably will be a drag on overall GDP<br />
growth later this year. Higher mortgage rates, which impinge on elevated household<br />
indebtedness, also are limiting spending power by consumers. On the favorable side,<br />
exports remain relatively dynamic (especially to emerging markets). In addition, the<br />
government achieved a budget surplus of 2.2% of GDP last year, providing some room for<br />
the automatic stabilizers to cushion the economic downturn <strong>and</strong>, perhaps, for some<br />
expansionary measures after the March 9 elections.<br />
Benelux<br />
Thanks to a strong increase in net exports, Dutch GDP growth surprised again on the<br />
upside in the fourth quarter. Furthermore, consumption accelerated at the end of last year,<br />
<strong>and</strong> ongoing job creation, in combination with some wage acceleration, is likely to support<br />
consumption in 2008. However, private consumption growth will be overstated this year<br />
by about one-half percentage point due to reform of the public health plan. Facing tighter<br />
financial conditions, investment growth is likely to slow <strong>and</strong> exports should moderate. In<br />
Belgium, the government crisis has not had substantial negative repercussions for the<br />
economy so far. While the interim government has managed to propose a 2008 budget,<br />
targeting a balanced position, the country’s large parties made some progress in reforming<br />
the constitution. However, if these talks fail, the political crisis probably will escalate<br />
again at the end of March.<br />
Finl<strong>and</strong><br />
The pace of Finnish growth is expected to ease further this year, in line with the global<br />
growth slowdown, as consumer dem<strong>and</strong> is capped by intensifying price pressures <strong>and</strong> less<br />
stimulus from the housing market. The tight labor market is fueling wage pressures,<br />
suggesting upside inflation risks. The government will continue to strive for a prudent<br />
fiscal policy stance, with the focal point being an improvement of long-term growth<br />
prospects via enhanced job creation <strong>and</strong> tax cuts. However, high pay increases in recent<br />
wage agreements pose a minor setback to planned income tax cuts.<br />
Figure 29. Spain, Belgium, the Netherl<strong>and</strong>s, <strong>and</strong> Finl<strong>and</strong> — <strong>Economic</strong> Forecast, 2007-09F<br />
Spain Belgium The Netherl<strong>and</strong>s Finl<strong>and</strong><br />
2007F 2008F 2009F 2007F 2008F 2009F 2007F 2008F 2009F 2007F 2008F 2009F<br />
Real GDP YoY 3.8% 2.1% 2.2% 2.6% 1.7% 1.9% 3.5% 2.8% 1.8% 4.3% 2.5% 2.9%<br />
Final Dom. Dem<strong>and</strong> YoY 4.4 2.4 1.6 2.8 2.1 2.3 2.9 2.5 1.7 3.7 3.2 2.3<br />
Public Consumption YoY 5.1 4.5 4.4 1.7 1.8 1.8 2.9 2.0 1.6 1.5 1.7 1.4<br />
Private Consumption YoY 3.1 1.8 1.7 2.5 1.9 1.9 2.1 2.4 1.2 3.9 3.3 2.6<br />
Investment (excl. Stocks) YoY 6.3 2.3 2.3 5.0 2.9 3.8 4.9 3.3 2.9 5.3 4.4 2.4<br />
Exports YoY 5.3 4.1 4.0 4.6 4.2 3.7 6.4 4.6 3.7 6.2 4.5 4.9<br />
Imports YoY 6.6 4.5 3.9 4.9 4.6 4.2 5.6 4.7 3.9 3.5 4.1 3.8<br />
CPI (Average) YoY 2.7 3.4 2.3 1.8 2.6 1.8 1.6 2.1 2.5 2.5 2.8 2.1<br />
Unemployment Rate % 8.1 8.4 8.8 7.5 7.2 7.1 4.6 4.5 4.5 6.8 6.3 6.0<br />
Current Account % of GDP -9.6 -8.9 -7.5 3.0 2.5 2.4 7.6 7.3 7.2 6.1 5.7 5.4<br />
General Govt. Balance % of GDP 2.2 1.2 0.0 -0.2 -0.3 -0.3 -0.2 0.2 0.7 4.4 4.5 4.3<br />
General Govt. Debt % of GDP 37.3 35.8 34.4 83.7 80.0 77.9 45.7 43.5 41.0 36.5 34.0 33.0<br />
F Citi forecast. YoY Year-on-year growth rate. The forecasts for GDP <strong>and</strong> its components are calendar adjusted.<br />
Source: Citi.<br />
24
February 28, 2008<br />
<strong>Global</strong> <strong>Economic</strong> <strong>Outlook</strong> <strong>and</strong> <strong>Strategy</strong><br />
Michael Saunders<br />
(44-20) 7986-3299<br />
michael.saunders<br />
@citi.com<br />
United Kingdom<br />
The U.K. economy continues to show signs of economic slowdown, <strong>and</strong> further marked<br />
weakness is likely in coming months as the credit crunch <strong>and</strong> last year’s rate hikes bite.<br />
We expect GDP growth this year to be about 1¾%, with consumption growth the weakest<br />
since 1992. The MPC has already made two 25-basis-point cuts, <strong>and</strong> we expect the MPC<br />
to cut by an additional 100 basis points over the course of the year. The gradual pace of<br />
easing is recognition that, with rising near-term inflation <strong>and</strong> a sharp recent pickup in<br />
inflation expectations, the MPC wants to allow a disinflationary cushion of economic<br />
weakness to build up. Easing aims to limit the extent of the slowdown, not prevent it from<br />
happening. In turn, this lack of aggressive early stimulus raises the likelihood that growth<br />
remains subdued <strong>and</strong> interest rates stay low in 2009.<br />
The United Kingdom is especially sensitive to the crisis in money <strong>and</strong> credit markets<br />
because of the interplay between high private debt, low private savings, the massively<br />
overstretched housing market, <strong>and</strong> the big role played by wholesale lenders in the<br />
mortgage market. Housing dem<strong>and</strong> is dropping amid tightening lending st<strong>and</strong>ards <strong>and</strong><br />
widening mortgage spreads. Commercial property values also are plunging, with the<br />
sharpest drop since data began more than 20 years ago. In turn, consumer spending is now<br />
starting to slow as savings begin to rise <strong>and</strong> surveys of retailers show marked weakness.<br />
Given that sales usually lag housing by about six months, retail sales growth is likely to<br />
slow a lot more in coming months. The labor market remains quite strong so far but<br />
usually lags the economy by a quarter or two. Hence, employment will probably start to<br />
weaken around midyear.<br />
The MPC faces a tricky job in balancing downside risks to growth against upside inflation<br />
risks. Recent surveys suggest that firms are very confident in their ability to raise selling<br />
prices, <strong>and</strong> food <strong>and</strong> energy price increases are likely to lift CPI inflation to about 3.0%<br />
this year. Inflation expectations already are elevated, <strong>and</strong> there is a risk that rapid easing,<br />
amid rising inflation, could destabilize inflation expectations further <strong>and</strong> worsen the<br />
growth-inflation tradeoff. Balancing these risks suggests that easing will be gradual.<br />
Figure 30. United Kingdom — <strong>Economic</strong> Forecast, 2007-09F<br />
2007 2008<br />
2007F 2008F 2009F 2Q 3QF 4QF 1QF 2QF 3QF 4QF<br />
Real GDP YoY 3.1% 1.7% 1.9% 3.2% 3.2% 3.0% 2.5% 1.9% 1.3% 1.2%<br />
SAAR 3.3 2.9 2.5 1.3 0.8 0.6 2.1<br />
Domestic Dem<strong>and</strong> YoY 3.8 1.6 1.4 3.4 4.0 3.9 3.0 2.3 0.7 0.4<br />
(Incl. Inventories) SAAR 2.6 6.2 2.8 0.4 -0.1 -0.4 1.7<br />
Consumption YoY 3.1 0.9 1.4 2.7 3.6 3.0 2.1 1.3 0.3 0.0<br />
SAAR 2.9 4.5 1.5 -0.3 -0.5 0.6 0.3<br />
Investment YoY 6.6 4.6 1.5 6.4 6.0 4.9 4.8 6.7 4.3 2.5<br />
SAAR -3.0 9.8 9.1 3.9 4.3 0.1 1.9<br />
Exports YoY -4.6 4.0 6.9 -11.7 2.1 2.4 3.7 4.3 3.4 4.7<br />
SAAR 1.0 8.1 1.6 4.4 3.3 4.3 7.0<br />
Imports YoY -2.3 3.4 4.7 -10.3 4.3 5.3 5.2 5.7 1.1 1.6<br />
SAAR -1.9 20.0 3.3 0.8 0.1 0.5 5.3<br />
Unemployment Rate % 5.4 5.5 5.8 5.4 5.4 5.4 5.4 5.4 5.5 5.6<br />
CPI Inflation YoY 2.3 2.5 2.0 2.6 1.8 2.1 2.4 2.3 2.7 2.4<br />
Merch. Trade £bn -86.2 -90.1 -81.0 -19.3 -22.4 -24.7 -25.2 -22.4 -21.4 -21.1<br />
% of GDP -6.2 -6.2 -5.3 -5.6 -6.4 -7.0 -7.0 -6.2 -5.8 -5.7<br />
Current Account £bn -72.1 -66.2 -51.0 -13.7 -20.0 -21.8 -21.0 -16.1 -14.8 -14.3<br />
% of GDP -5.2 -4.5 -3.3 -4.0 -5.7 -6.1 -5.9 -4.4 -4.0 -3.8<br />
PSNB £bn FY -42.9 -48.8 -54.6<br />
% of GDP -3.0 -3.3 -3.5<br />
General Govt. Balance % of GDP -3.0 -3.4 -3.6<br />
Public Debt % of GDP 42.9 44.2 45.8<br />
Gross Nonoil Trading Profits YoY 13.2 5.9 5.8<br />
F Citi forecast. SAAR Seasonally adjusted annual rate. YoY Year-to-year growth rate. Investment excludes inventories. Source: Citi.<br />
25
February 28, 2008<br />
<strong>Global</strong> <strong>Economic</strong> <strong>Outlook</strong> <strong>and</strong> <strong>Strategy</strong><br />
Michael Saunders<br />
(44-20) 7986-3299<br />
michael.saunders<br />
@citi.com<br />
Tina Mortensen<br />
(44-20) 7986-3284<br />
tina.mortensen<br />
@citi.com<br />
Tina Mortensen<br />
(44-20) 7986-3284<br />
tina.mortensen<br />
@citi.com<br />
Tina Mortensen<br />
(44-20) 7986-3284<br />
tina.mortensen<br />
@citi.com<br />
Switzerl<strong>and</strong><br />
Swiss GDP will probably continue to grow at an above-average pace this year but may<br />
moderate slightly. In light of upbeat employment prospects, domestic dem<strong>and</strong> will probably<br />
remain the main growth engine in 2008. However, the net contribution of exports to GDP<br />
growth could decline on the back of a slowdown in global economic activity. The Swiss<br />
National Bank will probably keep its key rate on hold at 2.75%, unless there is a clear<br />
deterioration in the inflation outlook through a sharp weakening of the Swiss franc <strong>and</strong> a<br />
surge in imported inflation.<br />
Sweden<br />
The Swedish economy is shifting into low gear with signs of slowing activity, fading<br />
employment growth, <strong>and</strong> a leveling out of unemployment. Nevertheless, private<br />
consumption will continue to benefit from a loose fiscal policy <strong>and</strong> healthy disposable<br />
income growth, partly offsetting weaknesses in exports <strong>and</strong> capital spending. The<br />
Riksbank lifted the policy rate in February amid rising cost pressures, a tight labor market,<br />
<strong>and</strong> low productivity growth. However, the ongoing credit crisis <strong>and</strong> weakening U.S. <strong>and</strong><br />
global economic growth will likely turn the Bank more dovish eventually. We expect the<br />
next move to be a cut, probably late this year.<br />
Denmark<br />
Growth is set to moderate further this year, reflecting the persistent sluggishness in the<br />
housing market, the lagged effect of rising interest rates, <strong>and</strong> lower growth among<br />
Denmark’s key export markets. Lower domestic dem<strong>and</strong> growth is a welcome<br />
development in Denmark because of the historically tight labor markets <strong>and</strong> the elevated<br />
risks of outsized wage dem<strong>and</strong>s. The big challenge in coming years will be to find a way<br />
to increase the labor supply while coping with age-dependent retirement. The central bank<br />
is expected to continue to shadow the ECB, with a 25-basis-point interest rate spread,<br />
leading to two rate cuts this year.<br />
Norway<br />
Intensifying capacity strains, lower global growth, the lagged effect of higher domestic<br />
interest rates, <strong>and</strong> a cooler housing market will cap Norwegian growth this year. The<br />
combination of rising cost pressures <strong>and</strong> a cyclical slowdown in productivity will lift unit<br />
labor costs markedly in 2008 <strong>and</strong>, in turn, domestic inflation. But subdued import prices<br />
will remain an offset. The ongoing credit crisis, a slowing global economy, <strong>and</strong> a strong<br />
NOK prompted the Norges Bank to lower its rate path in October, indicating a 50% chance<br />
of a final rate hike next quarter. However, intensifying cost pressures might force the Bank<br />
to lift the policy rate further, unless external factors derail Norwegian growth prospects or<br />
cause the NOK to strengthen sharply.<br />
Figure 31. Switzerl<strong>and</strong>, Sweden, Denmark, <strong>and</strong> Norway — <strong>Economic</strong> Forecast, 2007-09F<br />
Switzerl<strong>and</strong> Sweden Denmark Norway<br />
2007F 2008F 2009F 2007F 2008F 2009F 2007F 2008F 2009F 2007F 2008F 2009F<br />
Real GDP a YoY 2.6% 2.2% 2.0% 2.7% 2.3% 2.2% 1.7% 1.6% 1.6% 6.0% 4.0% 3.0%<br />
Public Consumption YoY -0.8 0.0 0.2 0.6 1.0 0.7 1.6 1.8 1.7 3.2 3.2 3.1<br />
Private Consumption YoY 1.8 1.6 1.7 3.1 2.5 2.4 2.1 1.7 1.7 6.5 4.1 3.7<br />
Investment (Ex Stocks) YoY 3.9 3.0 3.2 8.0 3.7 2.5 4.9 2.5 2.3 9.8 5.3 3.6<br />
Exports YoY 8.3 3.8 4.0 5.0 4.4 5.1 3.9 4.0 4.4 3.1 1.8 2.1<br />
Imports YoY 3.9 4.3 4.4 9.0 6.0 5.3 5.5 4.7 4.8 8.6 4.7 4.0<br />
CPI (Average) YoY 0.7 1.5 0.8 2.2 3.4 2.3 1.7 2.3 2.0 0.7 3.4 2.5<br />
Unemployment Rate % 2.8 2.5 2.3 6.2 5.7 5.7 3.4 3.2 3.5 2.6 2.5 2.5<br />
Current Account % of GDP 15.1 19.0 26.4 6.2 6.3 6.9 1.4 1.3 1.2 16.1 16.2 16.2<br />
General Govt Balance % of GDP -0.4 0.8 0.2 2.8 2.5 2.4 4.3 3.6 3.0 17.3 16.0 16.0<br />
General Govt Debt % of GDP 50.9 49.7 48.4 42.0 39.0 35.0 25.0 21.0 16.0 40.5 37.0 35.0<br />
a For Norway, mainl<strong>and</strong> GDP. F Citi forecast. YoY Year-on-year growth rate. Source: Citi.<br />
26
February 28, 2008<br />
<strong>Global</strong> <strong>Economic</strong> <strong>Outlook</strong> <strong>and</strong> <strong>Strategy</strong><br />
Dana M. Peterson<br />
(1-212) 816-3549<br />
dana.peterson<br />
@citi.com<br />
Canada<br />
Anemic U.S. final dem<strong>and</strong> growth, last year’s rapid appreciation of the Canadian dollar<br />
(CAD), <strong>and</strong> ongoing financial market strains will continue to weigh on the Canadian<br />
economy over the medium term. Flagging output <strong>and</strong> moderating inflation likely will<br />
prompt an additional 100 basis points of easing by June.<br />
Tighter credit conditions, a considerable net exports drag, <strong>and</strong> slower domestic dem<strong>and</strong><br />
growth probably will result in significantly subpar growth in 2008. Accommodative policy,<br />
against a backdrop of hearty global growth, an improved U.S. outlook, healthy Canadian<br />
balance sheets, <strong>and</strong> elevated commodity prices should help place the expansion back on<br />
track by late 2009.<br />
The disinflationary effects of last year’s rapid currency appreciation <strong>and</strong> the 1% cut in the<br />
Goods <strong>and</strong> Services Tax will keep both overall <strong>and</strong> core inflation in the lower bound of the<br />
Bank of Canada’s (BoC) operational guide in 2008. Headline CPI should move back to the<br />
2.0% target in 2009, but the core measure likely will settle just below 2.0%.<br />
Key downside risks to the inflation outlook include a protracted period of net exports drag<br />
amid a U.S. recession, the dampening effects of past <strong>and</strong> recent CAD appreciation, <strong>and</strong> a<br />
disorderly resolution to global imbalances. Furthermore, possible moderation in global<br />
growth or curbed investment by top Asian trading partners present an uncertain outlook for<br />
commodity prices — a key driver of the Canadian expansion in recent years. Meanwhile,<br />
excess consumer dem<strong>and</strong> remains the main upside risk. As downside risks are likely to<br />
dominate near term, we expect the BoC to lower its policy rate to 3% before the summer.<br />
The stronger CAD <strong>and</strong> stricter lending st<strong>and</strong>ards are squeezing corporate profits in certain<br />
key sectors, limiting investment <strong>and</strong> hiring intentions. A peak in the housing boom this year<br />
should diminish construction spending <strong>and</strong> quell excess dem<strong>and</strong> for housing-related<br />
products. But slower dem<strong>and</strong> overall should alleviate capacity pressures, limiting outsized<br />
employment gains <strong>and</strong> wage inflation. In addition, we anticipate that a cooler economy will<br />
likely trigger a modest retreat in the CAD versus the USD.<br />
Figure 32. Canada — <strong>Economic</strong> Forecast, 2007-09F<br />
2007 2008<br />
2007F 2008F 2009F 2Q 3Q 4QF 1QF 2QF 3QF 4QF<br />
Real GDP YoY 2.5% 1.0% 1.5% 2.5% 2.9% 2.7% 1.8% 1.0% 0.6% 0.6%<br />
SAAR 3.8 2.9 0.7 0.1 0.4 1.0 0.9<br />
Final Domestic Dem<strong>and</strong> YoY 3.9 2.9 2.1 3.8 4.0 4.2 4.0 3.3 2.6 1.9<br />
SAAR 4.9 4.6 4.4 2.2 2.1 1.6 1.7<br />
Private Consumption YoY 4.2 3.3 2.6 4.5 4.0 4.1 4.0 3.3 3.1 2.7<br />
SAAR 5.9 3.0 4.2 3.0 2.8 2.5 2.4<br />
Government Spending YoY 2.9 2.7 2.4 2.3 3.4 3.4 3.5 3.2 2.3 2.0<br />
SAAR 2.9 5.9 3.2 2.0 2.0 2.0 2.0<br />
Private Fixed Investment YoY 4.1 1.9 0.2 3.7 4.6 4.7 4.2 3.1 0.9 -0.4<br />
SAAR 4.4 7.6 4.7 0.1 0.2 -1.1 -0.8<br />
Exports YoY 1.4 -0.3 3.1 2.3 2.2 0.1 -0.4 -1.2 -0.7 1.3<br />
SAAR 3.1 2.3 -5.4 -1.5 0.1 4.0 2.7<br />
Imports YoY 5.2 6.8 4.6 3.2 6.1 7.8 9.0 8.3 5.0 4.9<br />
SAAR 7.7 18.6 5.5 4.9 4.9 4.9 4.9<br />
CPI YoY 2.1 1.4 2.0 2.2 2.1 2.4 1.7 1.1 1.3 1.4<br />
Core CPI YoY 2.1 1.1 1.9 2.4 2.2 1.6 1.2 0.9 0.9 1.4<br />
Unemployment Rate % 6.0 6.3 6.4 6.1 6.0 5.9 6.1 6.3 6.4 6.4<br />
Current Account Balance, SA C$bn 13.6 -2.5 -12.4 25.4 4.2 -0.5 -0.2 -5.0 -2.3 -2.6<br />
% of GDP 0.9 -0.2 -0.8 1.7 0.3 0.0 0.0 -0.3 -0.1 -0.2<br />
Net Exports (Pct. Contrib.) -1.7 -3.1 -0.9 -1.4 -4.9 -4.5 -2.7 -2.1 -0.7 -1.2<br />
Inventories (Pct. Contrib.) 0.0 1.0 0.2 0.5 2.9 1.7 0.6 0.4 0.0 0.4<br />
Budget Balance % of GDP 0.2 0.1 0.1<br />
F Citi forecast. YoY Year-to-year percent change. SAAR Seasonally adjusted annual rate. Sources: Statistics Canada <strong>and</strong> Citi.<br />
27
February 28, 2008<br />
<strong>Global</strong> <strong>Economic</strong> <strong>Outlook</strong> <strong>and</strong> <strong>Strategy</strong><br />
Stephen Halmarick<br />
Paul Brennan<br />
Annette Beacher<br />
(61-2) 8225-6043<br />
Australia <strong>and</strong> New Zeal<strong>and</strong><br />
<strong>Economic</strong> growth in Australia probably slowed slightly since the third quarter of 2007, but<br />
not by enough to alleviate inflation pressures. The Reserve Bank of Australia’s underlying<br />
inflation measures accelerated further in the fourth quarter, the unemployment rate fell to a<br />
new low of 4.1% in January, <strong>and</strong> credit provided by banks has continued to grow briskly.<br />
Moreover, lead guides such as job vacancies have remained at high levels despite a sharp<br />
drop in business confidence. In addition, higher contract prices for iron ore <strong>and</strong> most likely<br />
coal will help boost Australia’s terms of trade by a further 5% this year.<br />
With inflation continuing to rise, measures of monetary policy such as the real cash rate<br />
remain only slightly above neutral levels, even though the nominal cash rate is high.<br />
Another 100 basis points of tightening would be required to align the real cash rate with its<br />
peak in 2000 of just over 4%. Markets are priced for an increase of around half of this<br />
magnitude. While we agree with market expectations, the risks are very much slanted<br />
toward a third tightening early in the third quarter. This, in turn, could prompt economic<br />
growth to dip below potential by the end of the year.<br />
In New Zeal<strong>and</strong>, two trends appear to be emerging: a weakening housing sector <strong>and</strong> slower<br />
retail spending. The trend in the housing sector is more pronounced, with lower house<br />
sales <strong>and</strong> prices. Moreover, the cooling housing sector <strong>and</strong> increased borrowing costs also<br />
will impact consumer spending over the medium term. Lower house prices could be a<br />
trigger for possible easing by the Reserve Bank of New Zeal<strong>and</strong>, just as it raised rates in<br />
the past due to rapidly appreciating house prices. But an easing cycle is still some way off<br />
in our view. A tight labor market, rising wages <strong>and</strong> terms of trade, <strong>and</strong> a prospective fiscal<br />
stimulus will underpin consumer spending this year. With significant inflationary pressures<br />
to worry policymakers, we expect monetary policy to be on hold for all of 2008.<br />
Figure 33. Australia <strong>and</strong> New Zeal<strong>and</strong> — <strong>Economic</strong> Forecast, 2007-2009F<br />
Australia<br />
New Zeal<strong>and</strong><br />
2007F 2008F 2009F 2007F 2008F 2009F<br />
Real GDP a 3.8% 2.7% 3.4% 3.1% 2.1% 2.0%<br />
Real GDP (4Q versus 4Q) 3.5 2.8 3.4 3.2 2.2 1.7<br />
Real Final Domestic Dem<strong>and</strong> 5.0 3.5 3.5 4.1 1.6 1.4<br />
Consumption 4.1 3.3 3.2 4.3 0.9 0.9<br />
Govt. Current & Capital Spending 3.1 4.4 3.4 2.1 4.0 4.6<br />
Housing Investment 4.1 0.7 4.9 3.8 -9.2 2.0<br />
Business Investment 11.8 4.0 3.7 5.3 4.6 4.1<br />
Exports of Goods & Services 3.8 1.3 6.2 2.2 2.1 3.2<br />
Imports of Goods & Services 10.4 6.5 5.3 7.0 0.6 2.0<br />
CPI 2.3 3.3 2.8 2.4 2.8 2.4<br />
CPI (4Q versus 4Q) 3.0 3.0 3.1 3.2 2.3 2.4<br />
Unemployment 4.4 4.3 4.6 3.6 4.0 4.4<br />
Merch. Trade, BOP (Local Currency, bn) -17.9 -18.5 -20.5 -3.2 -2.9 -2.9<br />
Current Account, (Local Currency, bn) -63.6 -59.4 -63.2 -14.1 -13.6 -12.3<br />
Percent of GDP -5.9 -5.2 -5.2 -8.2 -7.5 -6.6<br />
Budget Balance b (Local Currency, bn) 17.2 14.4 15.3 6.1 5.2 5.2<br />
Percent of GDP 1.6 1.3 1.5 3.6 2.9 2.9<br />
General Govt. Debt (% of GDP) c -2.9 -1.1 -2.5 3.5 4.0 4.0<br />
Gross Trading Profits d 13.5 5.4 7.1 NA NA Na<br />
BOP Balance of payments basis. CPI Consumer Price Index. F Citigroup forecast. NA Not available. a Averaged-based GDP in Australia; Production in New Zeal<strong>and</strong>. b Fiscal year ending June. Australia’s<br />
underlying cash balance c Australia <strong>and</strong> New Zeal<strong>and</strong> Budget definition <strong>and</strong> forecasts. – debt equals an asset. d Company gross operating surplus. Source: Citi.<br />
28
February 28, 2008<br />
<strong>Global</strong> <strong>Economic</strong> <strong>Outlook</strong> <strong>and</strong> <strong>Strategy</strong><br />
Yiping Huang<br />
(852) 2501-2735<br />
yiping.huang@citi.com<br />
Minggao Shen<br />
86 (10) 6510-2933<br />
ext. 71068<br />
minggao.shen@citi.com<br />
China: Renewed Inflation Challenge<br />
After a temporary dip in December, January consumer inflation rose to 7.1%, another 11-<br />
year high. The elevated inflation rate is probably the result of several factors — a slow<br />
supply response to rising dem<strong>and</strong>, inclement weather, <strong>and</strong> the Chinese New Year holiday.<br />
February CPI could rise even further. High inflation complicates macroeconomic<br />
policymaking in China, especially with increasing weakness in the global economy, <strong>and</strong><br />
could result in a combination of tight monetary policy <strong>and</strong> expansionary fiscal policy.<br />
As long as inflation remains high, the central bank will likely retain its tightening<br />
language. High inflation could create political as well as economic instability, as evidenced<br />
by the Tiananmen Incident in 1989. But we expect the year-to-year inflation rate to<br />
moderate starting in March, as snowstorms <strong>and</strong> the holiday effects recede <strong>and</strong> a higher base<br />
lowers year-to-year comparisons. Slowing exports also could ease inflation pressures by<br />
softening aggregate dem<strong>and</strong>. During the past ten years, export growth slumped twice, first<br />
in 1998 <strong>and</strong> then in 2001. Both instances were followed by deflation.<br />
The relatively resilient Chinese trade data for January alongside weak U.S. retail sales in<br />
December led some investors to believe that “de-coupling” might be at work. January<br />
export <strong>and</strong> import data, however, were likely distorted, as traders rushed to have their<br />
products delivered ahead of the lunar holiday. More importantly, U.S. consumption<br />
remained relatively strong until December. Weak U.S. consumption probably translates<br />
into slowing Chinese exports with a lag of a couple of months.<br />
We expect the government to move decisively once economic momentum slows. As in<br />
earlier economic slowdowns, the authorities could boost domestic dem<strong>and</strong> by increasing<br />
direct spending, encouraging state sector investment, <strong>and</strong> relaxing some existing controls.<br />
While distribution of additional funds may take some time, the authorities could accelerate<br />
the spending process once the annual budgets are allocated after the National People’s<br />
Congress meeting in early March.<br />
China’s GDP growth should remain strong this year, but its structure could shift<br />
significantly. Investment could again serve as an important countercyclical force, while<br />
consumption is likely to soften alongside weakening exports. Dem<strong>and</strong> for nontraded goods<br />
should outperform that of traded goods, especially if cautious yuan appreciation continues,<br />
which we expect.<br />
Figure 34. China — <strong>Economic</strong> Forecast, 2007-09F<br />
2007F 2008F 2009F<br />
Real GDP YoY 11.4% 10.5% 10.0%<br />
Real Final Domestic Dem<strong>and</strong> YoY 12.7 13.3 12.4<br />
Consumption YoY 11.3 12.2 11.4<br />
Fixed Capital Formation YoY 15.3 14.0 13.0<br />
Exports YoY 25.7 18.0 15.0<br />
Imports YoY 20.8 19.5 18.0<br />
Industrial Production YoY 18.5 16.8 16.5<br />
Merch<strong>and</strong>ise Trade Balance $bn 262.2 295.1 305.0<br />
FX Reserves $bn 1528 1900 2000<br />
Current Account % of GDP 10.8 8.8 7.0<br />
Fiscal Balance % of GDP -1.8 -2.0 -1.5<br />
General Govt. Debt % of GDP 56.1 54.2 49.2<br />
Urban Unemployment Rate % 4.0 4.0 4.1<br />
CPI YoY 4.8 5.0 4.0<br />
Exchange Rate CNY/$ 7.61 6.98 6.35<br />
One-Year Base Lending Rate %, p.e. 7.47 7.74 8.10<br />
Source: Citi estimates.<br />
29
February 28, 2008<br />
<strong>Global</strong> <strong>Economic</strong> <strong>Outlook</strong> <strong>and</strong> <strong>Strategy</strong><br />
Don Hanna<br />
(1-212) 816-7919<br />
don.hanna<br />
@citigroup.com<br />
A weaker G3 outlook is<br />
compromising the<br />
emerging market outlook.<br />
Fears of stagflation are<br />
rising as inflation exceeds<br />
expectations.<br />
Inflation concerns in<br />
emerging markets are<br />
probably misplaced.<br />
Emerging Markets: Food for Thought<br />
Two developments have complicated the outlook for emerging markets in the past month:<br />
the worsening financial stress in the United States <strong>and</strong> continued inflation shocks in food<br />
<strong>and</strong> energy. These developments are likely to generate a combination of slow growth <strong>and</strong><br />
rising inflation in emerging markets, which already is garnering worries about stagflation.<br />
However, we believe that fears of higher inflation coming from higher food <strong>and</strong> energy<br />
prices are misplaced. While the shift to biofuels should add to food prices, we do not<br />
expect that this will generate a lasting pickup in overall inflation in emerging markets.<br />
With the continued deterioration in financial conditions in the United States (see Figure 4),<br />
the risks to U.S. import dem<strong>and</strong> <strong>and</strong>, thereby, growth in emerging markets is rising. The<br />
high correlation between U.S. <strong>and</strong> emerging market share price indexes provides another<br />
avenue for the weakening U.S. economy to influence emerging markets: Lower emerging<br />
market share prices feed into lower emerging market wealth <strong>and</strong>, in turn, into lower<br />
consumption. At the same time, tighter credit conditions seem to be feeding a continued<br />
retreat from risk that damages emerging market asset values, as the widening of credit<br />
spreads <strong>and</strong> the downdraft in stock prices indicates (see Figure 35).<br />
Despite a softening global dem<strong>and</strong> outlook, food <strong>and</strong> energy prices <strong>and</strong> headline inflation<br />
measures continue to rise, fueling concerns about stagflation. Oil surged back over $100<br />
per barrel, platinum reached a record high in the middle of February, <strong>and</strong> the combination<br />
of wheat, corn, soybean, <strong>and</strong> palm oil prices are high <strong>and</strong> rising (see Figure 36). In<br />
January, actual inflation was higher than expectations across a wide swathe of countries<br />
including the United States, Australia, <strong>and</strong> 16 of the 19 emerging market countries that had<br />
reported by mid-February.<br />
Concerns about inflation in most emerging markets, though, are likely misplaced. First, the<br />
recent softer data out of the United States, the EU, <strong>and</strong> Japan point to weakening dem<strong>and</strong><br />
that should, with a lag, soften prices. Indeed, trends in core inflation look less worrisome<br />
than in headline inflation (see Figures 37 <strong>and</strong> 38). 1<br />
Figure 35. ESBI <strong>and</strong> MSCI Emerging Markets, Jun 06-19 Feb 08<br />
Figure 36. Commodity Price Indexes, Jun 07-21 Feb 08<br />
1450<br />
285<br />
170<br />
170<br />
1350<br />
265<br />
160<br />
160<br />
1250<br />
245<br />
150<br />
150<br />
1150<br />
225<br />
140<br />
140<br />
1050<br />
205<br />
950<br />
185<br />
850<br />
165<br />
750<br />
145<br />
650<br />
125<br />
Jun-06 Aug-06 Oct-06 Dec-06 Feb-07 Apr-07 Jun-07 Aug-07 Oct-07 Dec-07 Feb-08<br />
MSCI Emerging Markets US$ (Left)<br />
ESBI Spread (Right)<br />
Sources: Citi <strong>and</strong> MSCI.<br />
130<br />
120<br />
110<br />
100<br />
90<br />
2-Jul-07 18-Aug-07 4-Oct-07 20-Nov-07 6-Jan-08 22-Feb-08<br />
Grains Fats <strong>and</strong> Oils Energy<br />
Note: Grains <strong>and</strong> energy are from Reuters-CRB Futures Continuous Commodity Index. Fats <strong>and</strong><br />
Oils prices are from CRB Spot Commodity Price Index. Source: Haver.<br />
130<br />
120<br />
110<br />
100<br />
90<br />
1<br />
The alarming rise in inflation in Latin America is largely due to the seasonally adjusted surge in Venezuelan inflation to over 50% on an<br />
annualized basis. Ex-Venezuela, Latin American inflation is up 5.5% at an annual rate.<br />
30
February 28, 2008<br />
<strong>Global</strong> <strong>Economic</strong> <strong>Outlook</strong> <strong>and</strong> <strong>Strategy</strong><br />
The recent supply shock<br />
is small relative to past<br />
shocks.<br />
Rising food prices are a<br />
particular concern.<br />
Dem<strong>and</strong> for biofuels has<br />
pushed up food prices...<br />
...but the boost is not<br />
large.<br />
Food price increases are<br />
relative price increases.<br />
To affect inflation, relative<br />
price increases have to be<br />
large <strong>and</strong> persistent.<br />
Richer economies spend a<br />
smaller proportion of<br />
income on food.<br />
Second, stagflation would need to arise from large supply shocks that drive up costs<br />
significantly. Much of the rise in commodity prices in the past few months can be linked to<br />
supply shocks, but in the aggregate they do not look as abrupt <strong>and</strong> large as the oil price<br />
shocks of 1973 <strong>and</strong> 1979 that prompted ensuing periods of stagflation. The average price<br />
of WTI crude oil shot up 168% between 1973 <strong>and</strong> 1974, 166% between 1979 <strong>and</strong> 1980,<br />
<strong>and</strong> just 58% year to year in February 2008.<br />
Some investors cite concerns about a secular rise in agricultural prices, driven by a<br />
combination of higher dem<strong>and</strong> for some foods as a source of biofuel, rising incomes in<br />
emerging markets, <strong>and</strong> more unpredictable weather. While arguments that these forces will<br />
continue to drive up food prices may have some merit, the increases in overall emerging<br />
market inflation in 2008 should be much more muted for several reasons.<br />
First, some researchers do find sustained pressure on wheat, corn, soybean, <strong>and</strong> palm oil<br />
prices from aggressive expansion of biofuels. However, the implied increases are small<br />
relative to recent price gains. For example, an International Food Policy Research Institute<br />
study finds increases that cumulate to 15%-30% for wheat over the next 12 years <strong>and</strong> 20%-<br />
40% for corn. 2 But these figures are all less than the price rises in these products in the<br />
past 18 months as oil prices have nearly doubled. A renewed surge in energy prices could<br />
fuel another round of food price increases, as it would shift dem<strong>and</strong> toward biofuels. But<br />
any increase in energy prices is unlikely to be as steep as the runup in the past year. That<br />
alone should dampen food price inflation.<br />
Furthermore, the pressure on food prices from increased dem<strong>and</strong> for biofuels would occur<br />
mainly under circumstances that are unlikely to persist — that is, no improvement in the<br />
efficiency of biofuels production <strong>and</strong> the continuation of U.S. <strong>and</strong> EU government<br />
subsidies. The rise in oil prices has boosted the profitability of producing biofuels, which<br />
is likely to encourage improved efficiency. Rising food prices may alter some of the<br />
public’s support for subsidies to biofuel production <strong>and</strong> eliminate the need for government<br />
programs to artificially restrain agricultural production as a support for farm incomes.<br />
Second, increases in food prices are an increase in relative prices, not in the absolute price<br />
level. With a larger proportion of income spent on food bills, less money is available to<br />
spend on other products, which tends to dampen those other product’s prices <strong>and</strong> offset the<br />
initial shock, leaving the general price level unchanged.<br />
Relative prices can influence inflation if adjusting prices is costly so that firms absorb<br />
small changes rather than pass them on to consumers. Thus, only large changes get<br />
reflected in price measures. 3 In the case of a relative price shock, such as the recent rise in<br />
food prices, a large price change in one sector is not offset by small opposite adjustments<br />
in prices of other products. However, for inflation to persist, future large shocks would<br />
need to occur.<br />
Third, rising incomes can alter the sorts of food that people dem<strong>and</strong> <strong>and</strong>, over time, reduce<br />
the proportion of income spent on it. This can be seen in the lower share of consumer<br />
baskets spent on food in high-income countries (15%-20% versus 35%-40% in emerging<br />
markets). The shifting pattern of food consumption can also be seen in the rising dem<strong>and</strong><br />
2<br />
See von Braun, Joachim, <strong>and</strong> P. K. Pachauri, Essay: The Promises <strong>and</strong> Challenges of Biofuels for the Poor in Developing Countries,<br />
International Food Policy Research Institute, 2006.<br />
3<br />
For a discussion of inflation, relative prices, <strong>and</strong> the skew in their changes, see Ball, Laurence <strong>and</strong> Greg Mankiw, “Relative-Price Changes as<br />
Aggregate Supply Shocks,” Quarterly Journal of <strong>Economic</strong>s, Vol. 110: No. 1 (Feb, 1995) pp. 161-193.<br />
31
February 28, 2008<br />
<strong>Global</strong> <strong>Economic</strong> <strong>Outlook</strong> <strong>and</strong> <strong>Strategy</strong><br />
Figure 37. Headline Consumer Price Inflation in Emerging Markets<br />
(Sequential Three-Month Seasonally Adjusted Percent Change),<br />
Jun 03-Jan 08<br />
4.0% 4.0%<br />
3.5<br />
3.0<br />
2.5<br />
2.0<br />
1.5<br />
1.0<br />
0.5<br />
0.0<br />
-0.5<br />
Jun-03 Dec-03 Jun-04 Dec-04 Jun-05 Dec-05 Jun-06 Dec-06 Jun-07 Dec-07<br />
Asia ex China China CEEMEA Latin America<br />
3.5<br />
3.0<br />
2.5<br />
2.0<br />
1.5<br />
1.0<br />
0.5<br />
0.0<br />
-0.5<br />
Figure 38. Core Consumer Price Inflation in Emerging Markets<br />
(Sequential Three-Month Seasonally Adjusted Percent Change),<br />
Jun 03-Jan 08<br />
9% 9<br />
9% 9<br />
8<br />
8<br />
7<br />
7<br />
6<br />
6<br />
5<br />
5<br />
4<br />
4<br />
3<br />
3<br />
2<br />
2<br />
1<br />
1<br />
0<br />
0<br />
Jun-03 Dec-03 Jun-04 Dec-04 Jun-05 Dec-05 Jun-06 Dec-06 Jun-07 Dec-07<br />
Asia Latin America CEEMEA<br />
Note: GDP weighted. Asia — Hong Kong, <strong>Indonesia</strong>, Korea, Philippines, Singapore, Taiwan,<br />
Thail<strong>and</strong>. CEEMEA — Czech Republic, Hungary, Pol<strong>and</strong>, Slovakia, Turkey, Israel, South Africa.<br />
Latin America — Argentina, Brazil, Chile, Mexico, Peru, Venezuela.<br />
Sources: Haver <strong>and</strong> Citi.<br />
Note: Core inflation is defined as 20% trimmed in Asia <strong>and</strong> by respective government national<br />
statistics offices in CEEMEA <strong>and</strong> Latin America. GDP weighted. Asia — Hong Kong, <strong>Indonesia</strong>,<br />
Korea, Philippines, Singapore, Taiwan, Thail<strong>and</strong>. CEEMEA — Czech Republic, Hungary, Pol<strong>and</strong>,<br />
Slovakia, Turkey, Israel, South Africa. Latin America — Argentina, Brazil, Chile, Mexico, Peru,<br />
Venezuela. Sources: Haver Analytics <strong>and</strong> Citi.<br />
for meat in China <strong>and</strong> India. Spending a lower share of income does not preclude an<br />
absolute rise in food dem<strong>and</strong>, but it does lower the increase in that dem<strong>and</strong> relative to<br />
income growth, giving supply adjustments a better chance of keeping pace.<br />
Low food inventories are<br />
exacerbating price<br />
movements.<br />
Food price inflation<br />
probably is complicating<br />
monetary policy in the<br />
short run.<br />
Other measures to<br />
stabilize food prices are<br />
widespread but could<br />
prove destabilizing in the<br />
future.<br />
Third, the rise in food prices is in part a reflection of the low levels of stocks that translate<br />
dem<strong>and</strong> surges more directly into price increases <strong>and</strong> increase the volatility of prices. In<br />
the United States, for example, wheat stocks are at their lowest levels since the 1930s. But<br />
price increases that stem from dem<strong>and</strong> shocks <strong>and</strong> low inventories should, over time, lead<br />
to substitution to cheaper foods <strong>and</strong>/or innovations that improve yields <strong>and</strong> thereby supply.<br />
While food price inflation is, in our view, likely to moderate, its current elevated level<br />
constrains the scope of some central banks to use countercyclical monetary policy in the<br />
face of weakening external dem<strong>and</strong>. Food price inflation threatens the credibility of<br />
inflation targets, forcing inflation-targeting central banks to take a more hawkish stance, as<br />
has been the case in Slovakia, Turkey, <strong>and</strong> Brazil. Elsewhere, rising food prices can feed<br />
into inflation expectations, forcing central banks into a tighter stance. However, the yield<br />
curves of most countries do not reflect large changes in steepness that would be consistent<br />
with higher expected future inflation.<br />
Besides constraining monetary policy, high food prices have engendered a spate of market<br />
interventions in a variety of countries — price controls, export bans, tax increases, import<br />
tariff cuts — designed to shelter domestic consumers. Such interventions have been<br />
especially prominent in China, India, Vietnam, <strong>Indonesia</strong>, Argentina, <strong>and</strong> Mexico. While<br />
designed to lessen the social disruption <strong>and</strong> unrest that higher food prices can foster, the<br />
export bans <strong>and</strong> price controls either shift burdens to trading partners or risk shortages.<br />
Prominent price controls also risk future spikes in inflation if ensuing shortages become<br />
unmanageable.<br />
32
February 28, 2008<br />
<strong>Global</strong> <strong>Economic</strong> <strong>Outlook</strong> <strong>and</strong> <strong>Strategy</strong><br />
Even if stagflation<br />
subsides, the long-term<br />
trend for the relative price<br />
of food to rise looks<br />
intact.<br />
Higher food prices could<br />
moderate the pressure for<br />
urbanization by lifting<br />
rural incomes.<br />
While the risk of food price inflation appears set to ease over the course of this year in the<br />
face of weaker aggregate dem<strong>and</strong> <strong>and</strong> more stable energy prices, the long-term trend for<br />
food prices to increase relative to manufactured products looks robust. As mentioned, the<br />
increased dem<strong>and</strong> for food as a source of energy will tend to inflate grain <strong>and</strong> oil seeds.<br />
Meanwhile, the average level of manufacturing productivity remains low in emerging<br />
markets relative to the G7. Relocating manufacturing production to emerging markets <strong>and</strong><br />
raising productivity there can generate higher profits or lower selling prices.<br />
Finally, a relatively higher price for commodities, especially food, could diminish some of<br />
the pressure for urbanization <strong>and</strong> the associated stress on emerging market cities. Higher<br />
food prices would tend to boost rural incomes relative to urban wages, lessening the<br />
attractiveness of migrating to cities.<br />
33
February 28, 2008<br />
<strong>Global</strong> <strong>Economic</strong> <strong>Outlook</strong> <strong>and</strong> <strong>Strategy</strong><br />
Latin America<br />
Argentina. The main focus of attention starting in March will be wage negotiations. The<br />
government wants wages to increase by 20%, while some unions are dem<strong>and</strong>ing about<br />
30%. We believe that the final hike will be closer to the government target, although risks<br />
are high. The harvest will likely be flat this year <strong>and</strong> the summer tourism season was<br />
disappointing. In addition to the prospects of energy restrictions, these developments<br />
provide some counterbalance to strong dem<strong>and</strong> growth, high commodity prices, <strong>and</strong><br />
expansionary policies. The January inflation report showed that the government will likely<br />
continue to introduce “methodological innovations” in the calculation of the CPI. The<br />
focus will be on the discussions between Finance Minister Lousteau <strong>and</strong> Secretary of<br />
Domestic Commerce Moreno regarding these statistical reforms. We have lowered our<br />
yearend official inflation forecast to 10% from 11.3% to reflect greater manipulation. We<br />
believe that interbank rates will likely increase in March, but a lax monetary policy may<br />
result in a slower-than-expected rise. We expect strong fiscal figures during the first<br />
quarter due to healthy growth, strong imports, <strong>and</strong> higher export taxes.<br />
Mexico. GDP grew by an annual 3.8% in the fourth quarter of 2007, <strong>and</strong> 3.3% for the year<br />
as a whole. But the first signs of an economic slowdown appeared at the end of last year.<br />
We think low growth rates are very likely for the first half of 2008 due to the effect of the<br />
U.S. slowdown on export-oriented manufacturing output. However, we estimate that this<br />
impact will be partially cushioned by a reasonable expansion in local dem<strong>and</strong>. Our GDP<br />
growth forecast for this year remains at 2.9%. Although annual headline inflation in<br />
January dropped to 3.7% from 3.8% in December, we expect a rebound in the next few<br />
months with readings above 4%, the upper limit of Banxico’s tolerance range. We think<br />
Banxico is unlikely to cut interest rates until inflation readings show a definitive<br />
downward trend <strong>and</strong> return to below the 4% threshold, probably in the second half. Our<br />
yearend inflation <strong>and</strong> overnight rate forecasts remain at 3.8% <strong>and</strong> 6.75%, respectively. We<br />
also continue to expect a relatively strong peso in the first half of 2008. However, by the<br />
second half, a smaller spread in policy rates between Mexico <strong>and</strong> the United States, along<br />
with a larger current account deficit from lower oil prices, may push the USD/MXN to<br />
11.0. Congressional negotiations on energy reform should be followed closely, as many<br />
local analysts expect a bill on this issue to be submitted by President Calderón to Congress<br />
in March.<br />
Venezuela. Developments this month will be influenced by the aftermath of the U.K. court<br />
hearing, where ExxonMobil seeks to uphold a court order to freeze US$12 billion in the<br />
state oil company’s (PDVSA) assets pending an outcome on arbitration proceedings.<br />
PDVSA will defend its case in that court on February 27, likely arguing that the amount<br />
frozen is far above the fair value of ExxonMobil’s expropriated share in the Cerro Negro<br />
oilfield (between US$2 billion <strong>and</strong> US$5 billion by most accounts), <strong>and</strong> showcasing its<br />
willingness to negotiate <strong>and</strong> compensate appropriately. If the freeze is upheld, it could<br />
have important negative cash flow consequences for PDVSA, which has less than 5% of its<br />
assets in cash, <strong>and</strong> would hamper the company’s ability to raise new financing. This ability<br />
is, in turn, crucial to the government, which is squeezing the company’s resources to<br />
finance fiscal expenditure growth ahead of important regional elections set for November<br />
2008. Meanwhile, macroeconomic imbalances will likely continue to deepen. In particular,<br />
inflation of over 24% <strong>and</strong> scarcity levels of up to 90% in some basic products have<br />
triggered social discontent <strong>and</strong> are meaningfully denting the political capital of President<br />
Chávez. However, oil prices near US$100 will allow the country to maintain a comfortable<br />
stock of assets <strong>and</strong> a balance of payments surplus over the near term, sustaining the<br />
34
February 28, 2008<br />
<strong>Global</strong> <strong>Economic</strong> <strong>Outlook</strong> <strong>and</strong> <strong>Strategy</strong><br />
country (<strong>and</strong> PDVSA’s) ability to meet debt service payments comfortably. However, the<br />
high dependence on oil sales to the United States means that threats of retaliation in the<br />
wake of the ExxonMobil case are unlikely to be carried out.<br />
Asia<br />
India. We expect growth to moderate from 8.7% in fiscal year 2008 to 8.3% in fiscal year<br />
2009, amid a deteriorating global economic environment coupled with continuing higher<br />
domestic interest rates. Growth would have been slower had it not been for positive<br />
structural changes <strong>and</strong> the uptrend in savings <strong>and</strong> investment. With 2008 being a preelection<br />
year, we expect renewed focus on infrastructure, health, education, <strong>and</strong><br />
agriculture/rural development.<br />
In January, the central bank kept all rates unchanged <strong>and</strong> said that risks to inflation have<br />
dem<strong>and</strong>ed priority over growth. After keeping domestic fuel prices on hold since it cut<br />
them in February 2007, when oil prices were US$58 per barrel, the government raised<br />
transport fuel prices by 4%. As this price hike is far lower than what is necessary to meet<br />
import costs, the government has increased the quantity of oil bonds, an off-balance sheet<br />
fiscal item, to compensate domestic oil companies. If all the off-balance sheet items are<br />
included in the budget arithmetic, the headline deficit would rise by roughly 120 basis<br />
points. Against this backdrop, we expect the pace of rupee appreciation to be limited to 5%<br />
<strong>and</strong> thus maintain our yearend target of R37/US$.<br />
Philippines. Fundamentals remain solid, even as the global economy slows down. Fourth<br />
quarter GDP grew by 7.3% year to year. The downside risk from potential export<br />
weakness, investor risk aversion, <strong>and</strong> heightened political risk premia relating to the latest<br />
corruption allegations are likely to weaken the upbeat momentum. In late January, shortterm<br />
bank rates spiked to the low double-digit range, well above the policy rate of 5%.<br />
Special deposit accounts increased as liquidity sought safer outlets. If credit <strong>and</strong> monetary<br />
conditions continue to tighten without a corresponding policy rate response, interest rate<br />
volatility could be negative for consumer <strong>and</strong> business sentiment.<br />
A possible stall of infrastructure spending remains the major threat to domestic dem<strong>and</strong><br />
this year. Persistent financial market tightening could also aggravate downside risks. This<br />
worst-case scenario could transpire if tax collection efficiency fails to improve the<br />
government’s cash flow. The deficit may balloon in the first half of 2008 if the bulk of the<br />
PHP200 billion infrastructure program is front-loaded as a fiscal hedge against offshore<br />
downside influences. We expect peso appreciation to the 37.50 range against the USD in<br />
the second half. Easing inflation risk in the second quarter, a strong peso, <strong>and</strong> a less robust<br />
cyclical environment set the stage for a policy rate cut of another 50 basis points later this<br />
year.<br />
Singapore. The fairy-tale combination of strong growth <strong>and</strong> low inflation has come to an<br />
end. Fourth-quarter real GDP grew 5.4%, below market expectations of 6%. The<br />
government has revised down its 2008 GDP growth forecast range to 4%-6% from 4.5%-<br />
6.5%. Our GDP forecast for 2008 st<strong>and</strong>s at 5.6%, taking into account a manufacturing<br />
contraction in the first half. But further downgrades closer to 4% are possible if the U.S.<br />
recession proves deeper or longer than we currently foresee.<br />
Despite a slowdown in potential growth, we expect inflation to accelerate to 5% from 2.2%<br />
in 2007. The combined impact of fuel <strong>and</strong> food price increases, hikes in electricity tariffs,<br />
<strong>and</strong> a 20% upward revision in imputed rents to public housing (HDB annual values) in<br />
January may push inflation through 6% in the first half, before moderating to around 4% in<br />
35
February 28, 2008<br />
<strong>Global</strong> <strong>Economic</strong> <strong>Outlook</strong> <strong>and</strong> <strong>Strategy</strong><br />
the second half when the sales tax base effects kick in. The government also raised its<br />
inflation forecast to 4.5%-5.5% for 2008, from 3.5%-4.5%. Despite sharply higher<br />
inflation, downside risks to growth may make it difficult for the Monetary Authority of<br />
Singapore to tighten further in April. Instead, fiscal measures, including generous rebates<br />
<strong>and</strong> h<strong>and</strong>outs, have been used to offset higher living costs for households, especially in the<br />
lower income groups.<br />
Taiwan. GDP growth at the end of 2007 came in higher than expected on strong export<br />
growth. While this growth will likely diminish in 2008, we expect the USD/NTD to<br />
appreciate. First, diminishing political risks <strong>and</strong> expected liberalization of the government’s<br />
mainl<strong>and</strong> China policy should boost investor sentiment <strong>and</strong> encourage a net capital inflow.<br />
Second, with narrowing interest rate differentials between the United States <strong>and</strong> Taiwan,<br />
exporters <strong>and</strong> dollar-holding retail investors have started to sell dollars more aggressively.<br />
This also imposes higher sterilization costs for the central bank’s currency intervention.<br />
Third, rising labor costs <strong>and</strong> continuous RMB appreciation concerns in China have forced<br />
some Taiwan enterprises to shift their FDI funds back to Taiwan. Fourth, the central bank<br />
has been reluctant to loosen monetary policy on enduring inflation concerns. The key event<br />
to watch is the March presidential election. If the KMT party c<strong>and</strong>idate Ma Ying-jeou wins,<br />
the NTD could gain more significantly. Our yearend NTD forecast is 30.6.<br />
We believe the central bank will hike policy rates once more by 12.5 basis points in March<br />
<strong>and</strong> thereafter shift policy measures to allow more appreciation of the currency. The<br />
market, however, increasingly expects no change in policy rates at the March meeting. Net<br />
capital inflows <strong>and</strong> a limited supply of government bonds likely will boost bond prices <strong>and</strong><br />
benchmark ten-year government bond yields likely will consolidate in the first half of<br />
2008.<br />
Central Europe, Middle East, Africa<br />
Israel. <strong>Economic</strong> growth will probably slow in 2008 in response to weaker import dem<strong>and</strong><br />
in Israel’s major partners, particularly the United States. Nonetheless, leading indicators of<br />
expansion so far remain well oriented, suggesting continued resilience in the domestic<br />
economy (including export-oriented sectors). Dynamic job creation <strong>and</strong> a gradual<br />
acceleration in wages — as the labor market tightens — is boosting consumer dem<strong>and</strong>,<br />
while more stable economic <strong>and</strong> policy conditions also are boosting fixed investment<br />
growth. Consequently, we still expect somewhat above-par growth of 4.6% in 2008.<br />
The implications for policy are mixed: While strong growth, the closing of the output gap,<br />
<strong>and</strong> faster unit labor cost growth are boosting domestic price pressures, upside pressure on<br />
the shekel <strong>and</strong> downside global growth risks improve the inflation outlook. Surprisingly,<br />
the central bank opted for an aggressive 50-basis-point rate cut on February 25, even after<br />
hinting at a neutral stance in earlier weeks. Additional easing cannot be ruled out, but we<br />
lean toward no policy change in coming months because we do not expect the shekel to<br />
appreciate further. We still believe that equilibrium short-term rates are somewhat higher<br />
than their current levels, though the long end of the bond market offers attractive returns,<br />
in our view — even if short rates end up rising again somewhat.<br />
Romania. In view of forward-looking growth indicators, we estimate that GDP growth<br />
softened to 5.8% in 2007 from 7.7% in 2006 <strong>and</strong> forecast further weakening to around 5%<br />
this year. Volatile food prices <strong>and</strong> further currency weakness — along with the possibility<br />
of administrative price hikes — continue to cloud the inflation outlook. Barring<br />
36
February 28, 2008<br />
<strong>Global</strong> <strong>Economic</strong> <strong>Outlook</strong> <strong>and</strong> <strong>Strategy</strong><br />
unexpected shocks, we believe that yearend 2008 inflation is likely to be around 5.8%,<br />
which is above the 4.8% upper b<strong>and</strong> of the target.<br />
While the large external gap calls for a strong policy response, fiscal tightening is unlikely<br />
ahead of the upcoming elections. Therefore, the onus will be on the central bank, which<br />
has hiked rates aggressively since the beginning of the year. The tight international<br />
financing picture exposes the country to a sudden halt in capital inflows <strong>and</strong> introduces<br />
additional uncertainty to the exchange rate outlook. However, we think the probability of a<br />
soft l<strong>and</strong>ing is still reasonably high.<br />
Russia. The trade, services, <strong>and</strong> construction sectors are likely to drive sustainable<br />
economic growth of around 6.6% this year. Russia’s dependence on commodities <strong>and</strong> the<br />
continuing high rate of inflation remain serious constraints to faster growth. Stronger-thanexpected<br />
energy export revenues have led the government to revise up the 2008 federal<br />
government fiscal surplus to 3% of GDP from 0.2%. We expect the surplus to exceed 5%<br />
of GDP.<br />
We forecast a moderation of the net foreign exchange inflows — the sum of the current<br />
account surplus <strong>and</strong> net capital inflows — to 9% of GDP from 12.3% in 2007. In principle,<br />
this should ease inflationary <strong>and</strong> ruble appreciation pressures, although inflation is set to<br />
accelerate in the short run. While the central bank likely will continue to target inflation<br />
<strong>and</strong> real ruble appreciation, we expect the bank gradually to shift its interest rate policy,<br />
with the aim of making short-term interest rates less negative in real terms.<br />
Saudi Arabia. High oil prices have not helped Saudi Arabia as much as other oil<br />
exporters, since the Kingdom is the swing producer in OPEC <strong>and</strong> produced below its<br />
production quota for most of last year. With the oil sector accounting for 55% of GDP in<br />
2006, the slowdown in oil production last year pushed down growth to 3.5% against a<br />
figure of 4.3% in 2006. With oil prices again firming <strong>and</strong> Saudi production increasing<br />
since last September, we expect real growth to hit 5.5% in 2008. This will be<br />
complimented by robust nonoil growth, which we project at 7.5%.<br />
As we expect the OPEC basket to average US$73.8 per barrel in 2008 against $70.5 per<br />
barrel in 2007, Saudi Arabia will remain in comfortable surpluses on the fiscal side <strong>and</strong> the<br />
external sector side. We project the fiscal surplus at 14.8% of GDP this year <strong>and</strong> the<br />
current account surplus at 17.3%. Both have narrowed slightly, reflecting the impact of<br />
strong domestic growth driven by an expansionary fiscal stance. However, inflation is a<br />
growing problem with the year-to-year increase of 6.5% in December, a 16-year high.<br />
With a strong political commitment to the fixed dollar peg, Saudi Arabia is unable to<br />
contain imported inflation from a weak dollar <strong>and</strong> it is unable to resist the direction of U.S.<br />
Federal Reserve policy. We expect inflation to remain a problem, as the trend increase in<br />
private-sector credit growth will continue to feed dem<strong>and</strong> pressures <strong>and</strong> an adequate fiscal<br />
policy contraction in the face of surging government revenue looks unlikely.<br />
37
February 28, 2008<br />
<strong>Global</strong> <strong>Economic</strong> <strong>Outlook</strong> <strong>and</strong> <strong>Strategy</strong><br />
Figure 39. Selected Emerging Market Countries — <strong>Economic</strong> Forecast Overview, 2007-09F<br />
GDP Growth CPI Inflation Current Balance (% of GDP) Fiscal Balance (% of GDP)<br />
2007F 2008F 2009F 2007F 2008F 2009F 2007F 2008F 2009F 2007F 2008F 2009F<br />
Asia 8.7% 8.1% 8.1% 4.1% 4.5% 3.9% 7.0% 5.6% 4.7% -1.1% -1.7% -1.4%<br />
Bangladesh 6.2 6.0 6.5 7.5 6.5 6.5 1.2 -0.1 -1.1 -4.4 -4.6 -4.7<br />
China 11.4 10.5 10.0 4.8 5.0 4.0 10.8 8.8 7.0 -1.8 -2.0 -1.5<br />
Hong Kong 6.3 5.3 5.5 2.0 3.7 4.8 11.3 9.1 7.0 7.2 -0.4 2.6<br />
India* 8.7 8.3 8.5 4.5 4.3 4.0 -1.2 -1.9 -1.8 -6.0 -5.8 -5.2<br />
<strong>Indonesia</strong> 6.3 6.2 6.5 6.4 6.7 6.9 2.0 1.4 0.8 -1.3 -1.5 -1.7<br />
Korea 4.9 4.6 4.8 2.5 3.3 2.5 0.6 -1.3 -0.6 2.0 2.0 1.5<br />
Malaysia 6.3 5.6 6.5 2.0 2.8 2.6 15.0 12.5 12.0 -3.2 -3.3 -3.1<br />
Philippines 7.3 6.5 7.5 2.8 3.9 3.5 3.7 3.3 2.8 -0.1 -0.4 0.0<br />
Singapore 7.7 5.6 6.8 2.1 5.0 2.6 29.2 26.0 25.0 10.7 8.0 7.0<br />
Sri Lanka 6.7 6.0 6.5 16.0 12.0 9.0 -2.8 -3.1 -2.7 -7.2 -7.1 -7.2<br />
Taiwan 5.7 4.5 5.0 1.8 2.3 1.8 8.3 7.2 6.2 -0.2 -0.4 -0.3<br />
Thail<strong>and</strong> 4.8 4.5 5.3 2.3 3.5 2.8 6.1 5.6 5.4 2.1 -1.7 -0.5<br />
Vietnam 8.5 8.1 8.3 8.3 8.8 7.0 -9.0 -8.5 -5.1 -1.8 -2.3 -2.5<br />
Latin America 5.3% 4.4% 3.8% 5.2% 6.6% 7.1% 0.8% -0.2% -1.0% 0.1% 0.1% -0.3%<br />
Argentina 8.6 5.7 3.0 8.8 9.1 13.7 2.7 2.8 1.2 0.1 0.8 -0.6<br />
Brazil 5.3 4.4 4.0 3.6 4.7 4.5 0.3 -0.6 -1.0 -1.4 -0.7 -0.4<br />
Chile 5.1 4.5 4.7 4.4 6.5 3.3 4.3 0.8 1.1 8.9 7.0 4.0<br />
Colombia 7.1 5.3 4.8 5.3 5.3 4.5 -3.7 -4.1 -4.1 -0.6 -1.5 -1.5<br />
Ecuador 2.0 2.5 3.5 2.3 4.2 3.2 3.3 2.3 2.0 3.3 2.3 1.2<br />
Mexico 3.3 2.9 3.7 4.0 3.9 3.5 -0.9 -1.8 -2.3 0.0 0.0 0.0<br />
Panama 10.3 9.0 8.0 4.2 5.7 4.7 -5.3 -6.8 -6.9 0.0 0.0 0.0<br />
Peru 8.5 7.5 6.5 1.8 4.1 3.2 1.4 0.1 0.2 6.5 5.1 2.2<br />
Uruguay 7.2 6.0 4.5 8.1 6.7 6.0 -2.0 -1.3 -2.0 0.0 -0.5 -0.5<br />
Venezuela 8.4 5.9 1.5 18.7 27.8 32.5 8.5 5.4 0.9 -1.5 -2.0 -3.9<br />
Europe 6.5% 5.5% 5.8% 7.4% 9.5% 6.8% -0.6% -0.4% -1.5% 1.1% 1.1% 0.8%<br />
Czech Republic 6.6 4.7 5.2 2.8 6.3 3.4 -3.1 -2.8 -2.1 -2.1 -1.9 -2.1<br />
Hungary 1.3 2.2 3.2 8.0 5.9 3.8 -5.3 -4.7 -4.2 -5.7 -4.0 -3.7<br />
Pol<strong>and</strong> 6.5 5.0 4.7 2.5 4.2 3.0 -3.7 -4.7 -4.6 -1.5 -2.1 -2.5<br />
Romania 5.8 4.9 5.8 4.8 6.8 4.5 -14.0 -13.0 -12.5 -2.4 -2.6 -2.6<br />
Russia 8.1 6.6 6.5 9.0 12.9 8.9 5.9 6.2 3.3 5.4 5.6 5.0<br />
Slovak Rep. 9.8 7.5 6.6 2.8 3.1 2.9 -4.8 -2.9 -2.5 -2.3 -1.9 -1.8<br />
Turkey 3.8 4.2 5.2 8.8 7.8 6.5 -7.7 -8.3 -6.8 -2.2 -2.4 -3.2<br />
Ukraine 7.3 6.6 5.8 12.8 14.8 9.9 -4.6 -6.9 -8.0 -0.9 -2.1 -2.8<br />
Africa/Mideast 5.5% 5.3% 4.8% 6.4% 6.3% 6.0% 10.1% 7.8% 3.6% 6.2% 4.7% 1.7%<br />
Egypt 7.9 6.1 4.5 9.5 8.1 8.5 1.1 -0.7 -2.1 -4.8 -6.5 -6.6<br />
Israel 5.4 4.6 4.4 0.5 1.6 1.4 3.1 3.1 3.8 0.1 -0.1 0.5<br />
Jordan 5.9 5.0 5.1 5.4 5.0 3.7 -9.3 -6.0 -6.9 -5.5 -5.3 -5.6<br />
Kazakhstan 8.5 5.7 6.6 10.8 15.6 12.2 -1.9 -1.2 -0.9 -1.8 -2.0 -1.6<br />
Kuwait 4.4 4.9 2.3 5.3 4.0 3.8 52.2 51.4 46.1 28.0 24.7 16.7<br />
Lebanon 2.0 2.9 2.3 5.7 5.2 2.3 -2.9 -6.7 -9.0 -15.5 -17.7 -19.8<br />
Nigeria 5.7 6.9 7.1 5.4 8.2 9.5 0.8 4.9 2.2 -3.5 -2.8 -2.3<br />
Pakistan 6.0 6.6 6.5 8.8 6.0 6.4 -5.7 -4.8 -5.0 -5.4 -5.5 -5.3<br />
Qatar 7.2 6.2 7.0 12.1 10.7 8.3 16.1 9.3 3.5 6.3 2.3 -2.0<br />
Saudi Arabia 3.5 5.5 4.0 4.1 3.9 3.8 23.1 17.3 8.0 18.1 14.8 6.2<br />
South Africa 5.1 3.5 4.3 7.1 6.1 5.4 -7.1 -7.7 -7.7 0.8 0.3 0.2<br />
United Arab Emirates 7.6 5.6 4.0 9.2 8.4 8.0 17.4 11.9 2.2 12.7 12.5 8.4<br />
Total 7.2% 6.5% 6.4% 5.2% 6.1% 5.4% 4.6% 3.5% 2.3% 0.4% -0.1% -0.4%<br />
Source GDP <strong>and</strong> CPI are expressed as year-to-year percent change. Calendar years except fiscal years for Bangladesh, India, <strong>and</strong> Pakistan. F Citi forecasts. Source: Citi.<br />
38
February 28, 2008<br />
<strong>Global</strong> <strong>Economic</strong> <strong>Outlook</strong> <strong>and</strong> <strong>Strategy</strong><br />
Figure 40. Citi <strong>Economic</strong> <strong>and</strong> Market Analysis (EMA) Team<br />
Name Office Number Email Address Responsibilities<br />
NEW YORK Lewis Alex<strong>and</strong>er (1-212) 816-9888 lewis.alex<strong>and</strong>er@citi.com Chief Economist<br />
Kim Schoenholtz (1-212) 816-9866 kim.schoenholtz@citi.com <strong>Economic</strong> Advisor<br />
North America<br />
Robert DiClemente (1-212) 816-7942 robert.diclemente@citi.com Head, North America<br />
Peter D’Antonio (1-212) 816-9889 peter.dantonio@citi.com U.S. Forecast<br />
Steven Wieting (1-212) 816-7148 steven.wieting@citi.com Equity Themes<br />
Christopher Wieg<strong>and</strong> (1-212) 816-9892 christopher.wieg<strong>and</strong>@citi.com U.S. <strong>Economic</strong> <strong>and</strong> Fiscal <strong>Outlook</strong><br />
Ken Peng (1-212) 816-7184 ken.peng@citi.com Equity Themes<br />
Dana Peterson (1-212) 816-3549 dana.peterson@citi.com U.S. Forecast <strong>and</strong> Canada<br />
Emerging Markets<br />
Donald Hanna (1-212) 816-7919 don.hanna@citi.com <strong>Global</strong> Head, Emerging Markets<br />
Alberto Ades (1-212) 816-2735 alberto.ades@citi.com Head, Latin America<br />
Tania Reif (1-212) 816-6281 tania.reif@citi.com Equity Themes, Venezuela<br />
Jose Wynne (1-212) 816-9895 jose.wynne@citi.com Peru, Ecuador<br />
LONDON<br />
Western Europe<br />
Michael Saunders (44-20) 7986-3299 michael.saunders@citi.com Head, Western Europe <strong>and</strong> U.K. Coverage<br />
José Luis Alzola (44-20) 7986-3281 jose.alzola@citi.com Euro Area <strong>and</strong> ECB Specialist<br />
Juergen Michels (44-20) 7986-3294 juergen.michels@citi.com Euro Area (Germany)<br />
Tina Mortensen (44-20) 7986-3284 tina.mortensen@citi.com Nordics<br />
Ann O’Kelly (44-20) 7986-3297 ann.okelly@citi.com Europe<br />
Richard Reid (44-20) 7986-4307 richard.reid@citi.com Equity Themes<br />
Stuart Block (44-20) 7986-3293 stuart.block@citi.com Equity Themes<br />
Emerging Markets<br />
David Lubin (44-20) 7986-3302 david.p.lubin@citi.com Head, CEEMEA<br />
Ali Al-Eyd (44-20) 7986-4356 ali.aleyd@citi.com Kazakhstan, Ukraine<br />
David Cowan (44-20) 7986-3285 david.cowan@citi.com Sub-Sahara Africa<br />
Mushtaq Khan (44-20) 7986-3291 mushtaq.khan@citi.com Middle East<br />
TOKYO Kiichi Murashima (813) 5574-4729 kiichi.murashima@nikkociti.com Head, Japan<br />
SYDNEY Paul Brennan (612) 8225-4899 paul.brennan@citi.com Co-Head, Australia <strong>and</strong> New Zeal<strong>and</strong><br />
Stephen Halmarick (612) 8225-6043 stephen.halmarick@citi.com Co-Head, Australia <strong>and</strong> New Zeal<strong>and</strong><br />
Annette Beacher (612) 8225-6183 annette.beacher@citi.com Australia, New Zeal<strong>and</strong><br />
Shane Lee (612) 8225-6042 shane.lee@citi.com Australia<br />
HONG KONG Yiping Huang (852) 2501-2735 yiping.huang@citi.com Head, Emerging Asia<br />
Joe Lo (852) 2868-8442 joe.lo@citi.com Hong Kong<br />
Patricia Pong (852) 2868-8449 patricia.pong@citi.com Hong Kong<br />
SINGAPORE Hak Bin Chua (65) 6432-2057 hak.bin.chua@citi.com Equity Themes, Asia<br />
Kit Wei Zhang (65) 6328-5079 kit.wei.zheng@citi.com Singapore, Malaysia<br />
MUMBAI Rohini Malkani (91) 22-6631-9876 rohini.malkani@citi.com India, Bangladesh, Sri Lanka<br />
Anushka Shah (91) 22-6631-9878 anushka.shah@citi.com India, Bangladesh, Sri Lanka<br />
JOHANNESBURG Jean-François Mercier (27) 11 944-0813 jean.mercier@citi.com South Africa, Israel<br />
BUENOS AIRES Marcos Buscaglia 54 (11-4) 329-1104 marcos.buscaglia@citi.com Argentina, Chile, Uruguay, Paraguay<br />
SAO PAULO Marcelo Kfoury 55 (11) 4009-3470 marcelo.kfoury@citi.com Brazil<br />
BEIJING Minggao Shen 86 (10) 6510-2933, x7141 minggao.shen@citi.com China<br />
SHANGHAI Ken Peng 86 (21) 2896-6600 ken.peng@citi.com China<br />
TAIPEI Cheng-Mount Cheng 886 (2) 2777-7070 chengmount.cheng@citi.com Taiwan<br />
Renee Chen 886 (2) 2777-7063 renee.chen@citi.com Taiwan, Vietnam<br />
JAKARTA Anton Gunawan 62 (21) 5290-8423 anton.gunawan@citi.com <strong>Indonesia</strong><br />
SEOUL Suktae Oh 82 (2) 2077-4014 suktae.oh@citi.com Korea<br />
MANILA Jun Trinidad 63 (2) 894-7270 jun.trinidad@citi.com Philippines, Thail<strong>and</strong><br />
39
February 28, 2008<br />
<strong>Global</strong> <strong>Economic</strong> <strong>Outlook</strong> <strong>and</strong> <strong>Strategy</strong><br />
Figure 41. Recent Publications from the Citigroup <strong>Economic</strong> <strong>and</strong> Market Analysis (EMA) Team<br />
Title Contact Name Date of Publication<br />
Annual Report<br />
Industrial Countries<br />
Prospects for Financial Markets Lewis Alex<strong>and</strong>er November 21, 2007<br />
Monthly Reports<br />
Industrial Countries<br />
<strong>Global</strong> <strong>Economic</strong> <strong>Outlook</strong> <strong>and</strong> <strong>Strategy</strong> Lewis Alex<strong>and</strong>er January 2008<br />
Emerging Markets<br />
Emerging World Don Hanna January 2008<br />
Weekly Reports<br />
Industrial Countries<br />
Comments on Credit (North America)<br />
Robert V. DiClemente<br />
“Right Here, Right Now” February 22, 2008<br />
“No Let Up” February 15, 2008<br />
“Markets Struggle to Discount Recession” February 8, 2008<br />
“Another Step in the Right Direction” February 1, 2008<br />
Euro Weekly<br />
Michael Saunders<br />
“Confusing Price Expectations” February 21, 2008<br />
“Changing Fortunes” February 14, 2008<br />
“Language Acrobatics” February 7, 2008<br />
“Toward A Policy Debate” January 31, 2008<br />
Sterling Weekly (United Kingdom)<br />
Michael Saunders<br />
“The Crunch Goes On” February 22, 2008<br />
“MPC’s Flinty Message” February 15, 2008<br />
“MPC On Gradual Easing Path” February 8, 2008<br />
“The MPC’s Dilemma” February 1, 2008<br />
Issues <strong>and</strong> Prospects (Japan)<br />
Kiichi Murashima<br />
“Resilient Consumer Spending through 2008” February 21, 2008<br />
“Q4 GDP Surprises to the Upside” February 15, 2008<br />
“Solid Exports albeit Moderating” February 7, 2008<br />
“Will Industrial Production Peak Out” January 31, 2008<br />
Australia <strong>and</strong> NZ Weekly: Economy <strong>and</strong> Markets<br />
Stephen Halmarick<br />
“Australia: The Upside on Rates” February 22, 2008<br />
“Australia: Smash Through or Smashed Up” February 15, 2008<br />
“The AUD, Interest Rates, Commodities <strong>and</strong> Inflation” February 8, 2008<br />
“Heading In Different Directions” February 1, 2008<br />
Emerging Markets<br />
Asian <strong>Economic</strong> Weekly<br />
Eastern Europe/Middle East/Africa Weekly<br />
Latin America: The Week Ahead<br />
EMA research is available through your sales representative via mail or the Internet.<br />
Don Hanna<br />
40
February 28, 2008<br />
<strong>Global</strong> <strong>Economic</strong> <strong>Outlook</strong> <strong>and</strong> <strong>Strategy</strong><br />
Notes<br />
41
February 28, 2008<br />
<strong>Global</strong> <strong>Economic</strong> <strong>Outlook</strong> <strong>and</strong> <strong>Strategy</strong><br />
Notes<br />
42
ANALYST CERTIFICATION<br />
Disclosure Appendix A1<br />
Each individual hereby certify that all of the views expressed in this research report accurately reflect their personal views about any <strong>and</strong> all of the subject issuer(s)<br />
or securities. We also certify that no part of their compensation was, is, or will be directly or indirectly related to the specific recommendation(s) or views in this<br />
report.<br />
Other Disclosures<br />
ADDITIONAL INFORMATION AVAILABLE UPON REQUEST<br />
ISSUER-SPECIFIC DISCLOSURES<br />
Citigroup, its officers, directors <strong>and</strong>/or employees, may from time to time have long or short positions in, act as principal in connection with, <strong>and</strong> buy or sell securities<br />
or derivatives (including options <strong>and</strong> warrants) discussed in this report. For purposes of your review of this report, you should assume that this is the case with respect<br />
to the securities covered herein.<br />
Citigroup does <strong>and</strong>/or seeks to do business with many issuers, including through the provision of investment banking or other services. For purposes of your review of<br />
this report, you should assume that Citigroup has acted as a manager or co-manager of an offering of securities discussed in this report within the prior 12 months or<br />
has provided other services to the issuer within the prior 12 months for which it has received or expects to receive compensation.<br />
Citigroup is an active market maker or liquidity provider for many fixed-income securities <strong>and</strong> from time to time takes principal positions in such securities or related<br />
derivatives. For purposes of your review of this report, you should assume that this is the case with respect to the securities covered herein.<br />
LIQUIDITY PROVIDER DISCLOSURE<br />
Citi is a regular issuer of traded financial instruments linked to securities that may have been recommended in this report. Citi regularly trades in the securities of the<br />
subject company(ies) discussed in this report. Citi may engage in securities transactions in a manner inconsistent with this report <strong>and</strong>, with respect to securities<br />
covered by this report, will buy or sell from customers on a principal basis. For securities recommended in this report, in which Citi is not a market maker, Citi is a<br />
liquidity provider in the issuer’s financial instruments <strong>and</strong> may act as principal in connection with such transactions.<br />
VALUATION METHODOLOGY AND OTHER DISCLOSURES<br />
“Relative Value”-based recommendations is the principal approach used by Citi’s Fixed Income <strong>Strategy</strong> <strong>and</strong> Analysis (“FISA”) <strong>and</strong> <strong>Economic</strong> & Market Analysis<br />
(“EMA”) divisions’ strategists/analysts when they make “Buy” <strong>and</strong> “Sell” recommendations to clients. These recommendations use a valuation methodology that is<br />
principally driven by opportunistic spread differences between the appropriate benchmark security <strong>and</strong> the security being discussed: (1) that have different maturities<br />
within a unique capital structure, (2) that have different collateral classes within a unique capital structure, or (3) that reflect a unique opportunity associated with a<br />
debt security. In addition, it is also not uncommon for a strategist/analyst to make an “Asset Swap” recommendation, such as a “Buy” <strong>and</strong> “Sell” recommendation<br />
between two securities from the same issuer/tranche/sector.<br />
OTHER GENERAL DISCLOSURES<br />
This research report was prepared by Citigroup <strong>Global</strong> Markets Inc. (“CGMI”) <strong>and</strong>/or one or more of its affiliates (collectively, “Citi”), as further detailed in the report,<br />
<strong>and</strong> is provided for information <strong>and</strong> discussion purposes only. It does not constitute an offer or solicitation to purchase or sell any securities or other financial<br />
products.<br />
This report does not take into account the investment objectives, financial situation, or particular needs of any particular person. Investing in securities <strong>and</strong> other<br />
financial products entails certain risks, including the possible loss of the entire principal amount invested. Certain investments in particular, including those involving<br />
structured products, futures, options, <strong>and</strong> other derivatives, are complex, may entail substantial risk, <strong>and</strong> are not suitable for all investors. The price <strong>and</strong> value of, <strong>and</strong><br />
income produced by, securities <strong>and</strong> other financial products may fluctuate <strong>and</strong> may be adversely impacted by exchange rates, interest rates, or other factors. Prior to<br />
effecting any transaction in options or options-related products, investors should read <strong>and</strong> underst<strong>and</strong> the current Options Clearing Corporation Disclosure Document,<br />
a copy of which may be obtained on request from your Citi representative. Certain securities may not be registered with, or subject to the reporting requirements of,<br />
the US Securities <strong>and</strong> Exchange Commission or any comparable regulatory authority. Information available on such securities may be limited. Investors should obtain<br />
advice from their own tax, financial, legal, <strong>and</strong> other advisors <strong>and</strong> only make investment decisions on the basis of the investor’s own objectives, experience, <strong>and</strong><br />
resources.<br />
The information contained in this report is based on generally available information <strong>and</strong>, although obtained from sources believed to be reliable, its accuracy <strong>and</strong><br />
completeness is not guaranteed. The analysis contained in this report is based on a number of assumptions. Changes in such assumptions could produce materially<br />
different results. This communication is not intended to forecast or predict future events. Past performance is not a guarantee or indication of future results.<br />
Citi research analysts may communicate with sales <strong>and</strong> trading personnel <strong>and</strong> other Citi personnel for the purposes of gathering <strong>and</strong> analyzing market information<br />
<strong>and</strong> may discuss with such personnel information regarding, among other things, market trends, economic trends, the market for bonds of a specific issuer, <strong>and</strong> other<br />
market information (such as current prices, spreads, <strong>and</strong> liquidity), as long as such communications do not impair the analyst's independent ability to express<br />
accurately his or her personal views about any <strong>and</strong> all of the subject securities or issuers. Other Citi personnel who do not function as research analysts, including<br />
sales <strong>and</strong> trading personnel, may provide oral or written market commentary or trade ideas to Citi’s customers or proprietary trading desks that differ from the views<br />
expressed in this report. Citi’s proprietary trading <strong>and</strong> asset management businesses may make investment decisions that are different from the recommendations<br />
contained in this report.<br />
Citi has no duty to update this report, <strong>and</strong> the opinions, estimates, <strong>and</strong> other views expressed in this report may change without notice. No liability whatsoever is<br />
accepted for any loss (whether direct, indirect, or consequential) that may arise from any use of the information contained in or derived from this report.<br />
Securities recommended, offered, or sold by Citi (unless expressly stated otherwise): (1) are not insured by the Federal Deposit Insurance Corporation or any other<br />
body; <strong>and</strong> (2) are not deposits or other obligations of Citibank, N.A. or any other insured depository institution.<br />
Citi does not provide tax advice <strong>and</strong> nothing contained herein is intended to be, or should be construed as, tax advice. Any discussion of US tax matters contained in<br />
this report was written to support the promotion or marketing of the transactions or other matters addressed herein <strong>and</strong> is not intended to be used, <strong>and</strong> must not be<br />
used by any recipient, for the purpose of avoiding US federal tax penalties. Recipients of this report should seek tax advice based on the recipient’s own particular<br />
circumstances from an independent tax adviser.<br />
This report is intended for distribution solely to customers of Citi in those jurisdictions where such distribution is permitted. No part of this report may be copied or<br />
redistributed by any recipient for any purpose without Citi’s prior written consent.
Local law requirements may prohibit certain investors from effecting a transaction in the security or securities covered in this report. US persons wishing further<br />
information or to effect a transaction should contact a registered representative of CGMI in the United States. Non-US persons wishing further information or to effect<br />
a transaction should contact a Citi entity located in their own jurisdiction unless applicable governing law permits otherwise.<br />
AUSTRALIA: The Product is made available in Australia to wholesale clients through Citigroup <strong>Global</strong> Markets Australia Pty Ltd. (ABN 64 003 114 832 <strong>and</strong> AFSL No.<br />
240992) <strong>and</strong> to retail clients through Citi Smith Barney Pty Ltd. (ABN 19 009 145 555 <strong>and</strong> AFSL No. 240813), participants of the ASX Group, <strong>and</strong> regulated by the<br />
Australian Securities & Investments Commission. Citigroup Centre, 2 Park Street, Sydney, NSW 2000. BRAZIL: The Product is made available in Brazil by Citigroup<br />
<strong>Global</strong> Markets Brasil - CCTVM SA, which is regulated by CVM - Comissão de Valores Mobiliários, BACEN - Brazilian Central Bank, APIMEC - Associação Associação<br />
dos Analistas e Profissionais de Investimento do Mercado de Capitais <strong>and</strong> ANBID - Associação Nacional dos Bancos de Investimento. Av. Paulista, 1111 - 11º <strong>and</strong>ar -<br />
CEP. 01311920 - São Paulo - SP. CANADA: If this report is being made available in certain provinces of Canada by Citigroup <strong>Global</strong> Markets (Canada) Inc. (“CGM<br />
Canada”), CGM Canada has approved the Product. Citigroup Place, 123 Front Street West, Suite 1100, Toronto, Ontario M5J 2M3. CHINA: This report is made<br />
available in China through Citibank (China) Co., Ltd. Beijing Branch, 16F Tower 1 Bright China Chang-an Bldg., 7 Jianguomen Nei Avenue, Beijing, 100005 P.R. China.<br />
Citibank (China) Co., Ltd.Beijing Branch is regulated by the China Banking Regulatory Commission. CZECH REPUBLIC: This report is being distributed within the<br />
territory of the Czech Republic by Citibank a.s. Citibank a.s. is a bank <strong>and</strong> securities broker/dealer regulated by the Czech National Bank, Na Príkope 28, Prague 1,<br />
Czech Republic. Unless expressly stated otherwise, Citibank a.s. is only distributing this report <strong>and</strong>, upon its distribution, it has not changed or amended the actual<br />
content of this report in any way (as such was prepared by respective entities <strong>and</strong>/or individuals as further detailed in the report). HONG KONG: If this report is made<br />
available in Hong Kong by, or on behalf of, Citigroup <strong>Global</strong> Markets Asia Ltd., it is attributable to Citigroup <strong>Global</strong> Markets Asia Ltd., Citibank Tower, Citibank Plaza, 3<br />
Garden Road, Hong Kong. Citigroup <strong>Global</strong> Markets Asia Ltd. is regulated by the Hong Kong Securities <strong>and</strong> Futures Commission. If this report is made available in<br />
Hong Kong by Citibank, N.A., it is attributable to Citibank, N.A., Citibank Tower, Citibank Plaza, 3 Garden Road, Hong Kong. Citibank, N.A. is regulated by the Hong<br />
Kong Monetary Authority. INDIA: The Product is made available in India by Citigroup <strong>Global</strong> Markets India Private Limited, which is regulated by Securities <strong>and</strong><br />
Exchange Board of India. Bakhtawar, Nariman Point, Mumbai 400 021. INDONESIA: The Product is made available in <strong>Indonesia</strong> through PT Citigroup Securities<br />
<strong>Indonesia</strong>. 5/F, Citibank Tower, Bapindo Plaza, Jl. Jend. Sudirman Kav. 54-55, Jakarta 12190. Neither this Product nor any copy hereof may be distributed in<br />
<strong>Indonesia</strong> or to any <strong>Indonesia</strong>n citizens wherever they are domiciled or to <strong>Indonesia</strong>n residents except in compliance with applicable capital market laws <strong>and</strong><br />
regulations. This Product is not an offer of securities in <strong>Indonesia</strong>. The securities referred to in this Product have not been registered with the Capital Market <strong>and</strong><br />
Financial Institutions Supervisory Agency (BAPEPAM-LK) pursuant to relevant capital market laws <strong>and</strong> regulations, <strong>and</strong> may not be offered or sold within the territory<br />
of the Republic of <strong>Indonesia</strong> or to <strong>Indonesia</strong>n citizens through a public offering or in circumstances which constitute an offer within the meaning of the <strong>Indonesia</strong>n<br />
capital market laws <strong>and</strong> regulations. JAPAN: This report is being distributed in Japan by Nikko Citigroup Limited. If this report was prepared by a Citi affiliate of Nikko<br />
Citigroup Limited (“NCL”), it is being so distributed under license. If this report was prepared by NCL, it may be based in part on a report produced by one of its<br />
affiliates under license. If this report was prepared by NCL <strong>and</strong> is being distributed in other jurisdictions by other Citi affiliates, or by Nikko Cordial Securities Inc., it is<br />
being distributed by them under license. NCL is regulated by Financial Services Agency, Securities <strong>and</strong> Exchange Surveillance Commission, Japan Securities Dealers<br />
Association, Tokyo Stock Exchange <strong>and</strong> Osaka Securities Exchange. Shin-Marunouchi Building, 1-5-1 Marunouchi, Chiyoda-ku, Tokyo 100-6520 Japan. KOREA: The<br />
Product is made available in Korea by Citibank Korea Inc., which is regulated by the Financial Supervisory Commission <strong>and</strong> the Financial Supervisory Service. Address<br />
is Dadong 39, Jung Gu, Seoul, Korea, 100-180. MEXICO: This report is made available in Mexico by Acciones y Valores Banamex, S.A. De C. V., Casa de Bolsa, <strong>and</strong><br />
Banco Nacional de México S.A. Acciones y Valores Banamex is regulated by Comision Nacional Bancaria y de Valores. Its address is Reforma 398, Col. Juarez, 06600<br />
Mexico, D.F. Banco Nacional de México S.A. is regulated by the Comisión Nacional Bancaria y de Valores. Its address is Actuario Roberto Medellín 800, Col. Santa Fé,<br />
(01210) Mexico City, Mexico. NEW ZEALAND: In New Zeal<strong>and</strong> the Product is made available through Citigroup <strong>Global</strong> Markets New Zeal<strong>and</strong> Ltd. (Company Number<br />
604457), a Participant of the New Zeal<strong>and</strong> Exchange Limited <strong>and</strong> regulated by the New Zeal<strong>and</strong> Securities Commission. Level 19, Mobile on the Park, 157 Lambton<br />
Quay, Wellington. PHILIPPINES: This report is made available in the Philippines through Citibank, N.A. Philippine Branch, 8741 Paseo de Roxas, Makati City,<br />
Philippines. Citibank, N.A. Philippine Branch is regulated by the Bangko Sentral ng Pilpinas. POLAND: The Product is made available in Pol<strong>and</strong> by Dom Maklerski<br />
Banku H<strong>and</strong>lowego SA, an indirect subsidiary of Citigroup Inc., which is regulated by Komisja Papierów Wartosciowych i Gield. Bank H<strong>and</strong>lowy w Warszawie S.A. ul.<br />
Senatorska 16, 00 923 Warszawa. RUSSIA: The Product is made available in the Russian Federation through ZAO Citibank, which is licensed to carry out banking<br />
activities in the Russian Federation in accordance with the general banking license issued by the Central Bank of the Russian Federation <strong>and</strong> brokerage activities in<br />
accordance with the license issued by the Federal Service for Financial Markets. Neither the Product nor any information contained in the Product shall be considered<br />
as advertising the securities mentioned in this report within the territory of the Russian Federation or outside the Russian Federation. The Product does not constitute<br />
an appraisal within the meaning of the Federal Law of the Russian Federation of 29 July 1998 No. 135 FZ (as amended) On Appraisal Activities in the Russian<br />
Federation. 8 10 Gasheka Street, 125047 Moscow. SINGAPORE: The Product is made available in Singapore through Citigroup <strong>Global</strong> Markets Singapore Pte. Ltd. <strong>and</strong><br />
Citicorp Investment Bank Singapore Ltd. Citigroup <strong>Global</strong> Markets Singapore Pte. Ltd. is a Capital Markets Services License holder <strong>and</strong> regulated by the Monetary<br />
Authority of Singapore. 1 Temasek Avenue, #39-02 Millenia Tower, Singapore 039192. Citicorp Investment Bank Singapore Ltd. is a Merchant Banking License<br />
holder <strong>and</strong> regulated by the Monetary Authority of Singapore. 3 Temasek Avenue, #17-00 Centennial Tower, Singapore 039190. SOUTH AFRICA: Citigroup <strong>Global</strong><br />
Markets (Pty) Ltd. is incorporated in the Republic of South Africa (company registration number 2000/025866/07) <strong>and</strong> its registered office is at 145 West Street,<br />
S<strong>and</strong>ton, 2196, Saxonwold. Citigroup <strong>Global</strong> Markets (Pty) Ltd. is regulated by the JSE Securities Exchange South Africa, the South African Reserve Bank <strong>and</strong> the<br />
Financial Services Board. The investments <strong>and</strong> services contained herein are not available to private customers in South Africa. TAIWAN: The Product is made<br />
available in Taiwan through Citibank, N.A., Taipei Branch, which is regulated by the Financial Supervisory Commission. No portion of the report may be reproduced or<br />
quoted in Taiwan by the press or any other person. F.8 No. 169, Section 4, Jen Ai Road, Taipei, Taiwan. UNITED KINGDOM: This report is being distributed in the<br />
United Kingdom by Citibank, N.A., London Branch, or Citigroup <strong>Global</strong> Markets Limited, Citigroup Centre, Canada Square, Canary Wharf, London E14 5LB, UK. This<br />
material is directed exclusively at market professional <strong>and</strong> institutional investor customers in the United Kingdom <strong>and</strong> is not for distribution to private customers in<br />
the United Kingdom as defined by the Financial Services Authority. Any investment or service to which this material may relate will not be made available to such<br />
private customers. This material may relate to investments or services of a person outside the United Kingdom or to other matters that are not regulated by the<br />
Financial Services Authority <strong>and</strong> further details as to where this may be the case are available on request in respect of this material. UNITED STATES: This report is<br />
being distributed in the United States by CGMI. If this report was prepared in whole or in part by a non-US affiliate of CGMI, CGMI accepts responsibility for its<br />
contents (subject to the notices above). If this report covers non-US securities, US investors should be aware that non-US companies may not be subject to uniform<br />
audit <strong>and</strong> reporting st<strong>and</strong>ards, practices <strong>and</strong> requirements comparable to those in the United States. Securities of some non-US companies may be less liquid <strong>and</strong><br />
their prices may be more volatile than securities of comparable US companies. Exchange rate movements may have an adverse effect on the value of an investment<br />
in non-US securities <strong>and</strong> its corresponding dividend payment for US investors. CGMI is a member of the Securities Investor Protection Corporation. EUROPEAN UNION:<br />
Unless specified to the contrary, within EU Member States, the Product is made available by Citigroup <strong>Global</strong> Markets Limited, which is regulated by the Financial<br />
Services Authority. Many European regulators require that the firm must establish, implement <strong>and</strong> make available a policy for managing conflicts of interest arising as<br />
a result of publishing or distribution of investment research. The policy applicable to research analysts within Citi’s FISA <strong>and</strong> EMAA divisions, as well as the<br />
investment research they produce, can be obtained by contacting Citigroup <strong>Global</strong> Markets Inc., 388 Greenwich Street 11th floor, NY, NY 10013, Attention: Fixed<br />
Income Publishing.<br />
© 2008 Citigroup <strong>Global</strong> Markets Inc. (© Nikko Citigroup Limited, if this Product was prepared by it). All rights reserved. Smith Barney is a division <strong>and</strong> service mark<br />
of Citigroup <strong>Global</strong> Markets Inc. <strong>and</strong> its affiliates <strong>and</strong> is used <strong>and</strong> registered throughout the world. Citi <strong>and</strong> Arc Design are trademarks <strong>and</strong> service marks of Citigroup<br />
Inc. or its affiliates <strong>and</strong> are used <strong>and</strong> registered throughout the world. CitiFx® is a service mark of Citicorp Inc. Nikko is a service mark of Nikko Cordial Corporation.<br />
Any unauthorized use, duplication, or disclosure is prohibited by law <strong>and</strong> may result in prosecution.