2012 Results - Essilor
2012 Results - Essilor
2012 Results - Essilor

Create successful ePaper yourself
Turn your PDF publications into a flip-book with our unique Google optimized e-Paper software.
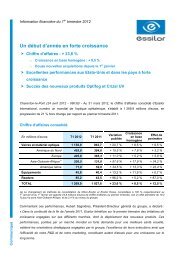
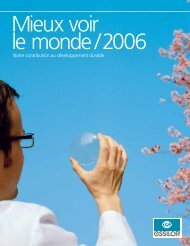
<strong>2012</strong> <strong>Results</strong><br />
February 28, 2013
Agenda<br />
Introduction<br />
Operational and Financial Performance<br />
Innovation<br />
Crizal ® Prevencia<br />
Strategy and Outlook<br />
<strong>2012</strong> <strong>Results</strong><br />
2
<strong>2012</strong>: A Year of Acceleration<br />
<strong>2012</strong> Revenue: €4,989m<br />
Like-for-like Revenue Growth<br />
& Bolt-on Acquisitions (1)<br />
Strategic<br />
Acquisitions<br />
Revenue Growth<br />
at Constant Exchange Rates<br />
+7.3%<br />
+8.0%<br />
+9.7%<br />
+14.5%<br />
Change in<br />
consolidation<br />
+2.4%<br />
Bolt-on<br />
acquisitions (1)<br />
+2.3%<br />
+2.8%<br />
+4.1%<br />
+2.5%<br />
Like-for-like<br />
Revenue<br />
Growth<br />
+5.0%<br />
+5.2%<br />
<strong>2012</strong><br />
2011 <strong>2012</strong><br />
<strong>2012</strong><br />
2011 <strong>2012</strong><br />
<strong>2012</strong><br />
2011<br />
<strong>2012</strong><br />
(1) Local acquisitions or partnerships<br />
<strong>2012</strong> <strong>Results</strong><br />
4
<strong>2012</strong>: A Year of Market Share Gains<br />
Lenses<br />
Readers<br />
<strong>2012</strong><br />
36%<br />
<strong>2012</strong><br />
22%<br />
2011<br />
31%<br />
2011<br />
16%<br />
Volume market share<br />
Volume market share<br />
<strong>2012</strong> <strong>Results</strong><br />
5
<strong>2012</strong>:<br />
Step-up in Revenues from Fast-Growing Markets<br />
<strong>2012</strong><br />
€911m (2)<br />
18.3% (1)<br />
2011<br />
€664m<br />
15.9% (1)<br />
(1) As a percentage of total Group revenue<br />
(2) Of which €828m for Lenses and Optical Instruments<br />
<strong>2012</strong> <strong>Results</strong><br />
6
Strong Contribution from Innovation<br />
Enhancing vision<br />
through personalization<br />
Protecting health<br />
& reducing risk<br />
In-store technologies<br />
in all market segments<br />
Creating value in high-end and mid-range markets<br />
Opening new fields for eyeglasses<br />
Widening the gap with competitors<br />
<strong>2012</strong> <strong>Results</strong><br />
7
Leveraging the Power of Partnerships & Acquisitions<br />
Building new networks<br />
and new offerings worldwide<br />
Cascading innovation to<br />
leaders in local midrange<br />
markets<br />
Entering new countries<br />
with strong local partners<br />
A unique growth model to maximize value creation<br />
<strong>2012</strong> <strong>Results</strong><br />
8
Enhanced Ability to Execute and Deliver<br />
Members of <strong>Essilor</strong>’s Executive Committee<br />
<strong>2012</strong> <strong>Results</strong><br />
9
Strategy Delivering Consistent and Visible <strong>Results</strong><br />
Contribution from operations (1)<br />
Earnings per share<br />
Free cash flow (2)<br />
894<br />
In € millions In €<br />
In € millions<br />
597<br />
748<br />
+19.5%<br />
2.44<br />
2.80<br />
463<br />
+28.9%<br />
+14.7%<br />
2011 2011 <strong>2012</strong><br />
2011 2011 <strong>2012</strong><br />
<strong>2012</strong><br />
2011 2011<br />
<strong>2012</strong><br />
(1) Operating profit before compensation costs of share-based payments, restructuring costs, other income & expense and goodwill impairment<br />
(2) Free cash flow = Net cash from operating activities less change in WCR and less net capital expenditure.<br />
<strong>2012</strong> <strong>Results</strong><br />
10
Agenda<br />
Introduction<br />
Operational and Financial Performance<br />
Innovation<br />
Crizal ® Prevencia<br />
Strategy and Outlook<br />
<strong>2012</strong> <strong>Results</strong><br />
11
Revenue Up 19.1% to €4,989m<br />
In € millions<br />
+4.6%<br />
+4.1%<br />
+2.4%<br />
101<br />
193<br />
+2.8%<br />
171<br />
+5.2%<br />
117<br />
217<br />
4,989<br />
4,190<br />
+8.0%<br />
+14.5%<br />
at constant exchange rates<br />
2011 Revenue Like-for-like<br />
growth<br />
Bolt-on<br />
acquisitions*<br />
Strategic<br />
acquisitions**<br />
Change<br />
in<br />
consolidation***<br />
Currency<br />
effect<br />
<strong>2012</strong> Revenue<br />
* Local acquisitions or partnerships<br />
** H1: Shamir / Full year: Stylemark<br />
*** Nikon <strong>Essilor</strong> & <strong>Essilor</strong> Korea<br />
<strong>2012</strong> <strong>Results</strong><br />
12
<strong>2012</strong> Revenue by Region and Division<br />
Reported revenue in € millions <strong>2012</strong> 2011<br />
% Change<br />
(like-for like and bolt-on<br />
acquisitions (1) combined)<br />
Lenses and Optical Instruments 4,445 3,796 +8.3%<br />
North America (2) 1,736 1,503 +6.0%<br />
Europe 1,559 1,471 +3.0%<br />
Asia-Oceania/Middle East/Africa 829 551 +21.6%<br />
Latin America (2) 322 270 +23.2%<br />
Fast-Growing<br />
Markets: +31.8%<br />
Developed<br />
Markets: +5.0%<br />
Equipment 199 185 +2.4%<br />
Readers 344 209 +6.6%<br />
TOTAL 4,989 4,190 +8.0%<br />
(1) Local acquisitions or partnerships<br />
(2) Mexico revenue (€15.9m in 2011) has been reclassified from the North America region to the Latin America region<br />
<strong>2012</strong> <strong>Results</strong><br />
13
Q4 Revenue Up 10.5% at Constant Exchange Rates<br />
Like-for-like growth: +3.6% despite high Q4 2011 comparatives<br />
› Successful launch of Varilux ® S series and further deployment of Crizal ® UV<br />
› Continued momentum in fast-growing markets<br />
› Robust performance in Readers<br />
Good contribution from bolt-on acquisitions (1)<br />
› 7 new partnerships in both developed and fast-growing countries<br />
› Leading positions in new key countries (Turkey, Colombia, etc.)<br />
› Valuable additions to <strong>Essilor</strong>’s business portfolio (IVS, X-Cel Optical, etc.)<br />
(1) Local acquisitions or partnerships<br />
<strong>2012</strong> <strong>Results</strong> 14
Quarterly Revenue Growth<br />
Revenue growth: like-for-like and bolt-on acquisitions (1) combined<br />
+11.8%<br />
+8.5%<br />
+7.3%<br />
+6.7%<br />
+6.7%<br />
+7.1%<br />
+6.5%<br />
+6.6%<br />
Bolt-on<br />
acquisitions (1)<br />
Like-for-like<br />
Revenue<br />
Growth<br />
1 st Quarter<br />
2 nd Quarter<br />
3 rd Quarter<br />
4 th Quarter<br />
1 st Quarter<br />
2 nd Quarter<br />
3 rd Quarter<br />
4 th Quarter<br />
2011<br />
<strong>2012</strong><br />
(1) Local acquisitions or partnerships<br />
<strong>2012</strong> <strong>Results</strong> 15
Positive Contribution from All Regions…<br />
<strong>2012</strong>/11 2011/10 2010/09<br />
North America (1)<br />
€1,736m<br />
Europe<br />
€1,559m<br />
Latin America (1)<br />
€322m<br />
Asia-Oceania/<br />
Middle East/Africa<br />
€829m<br />
Lenses and<br />
Optical Instruments<br />
€4,445m<br />
+6.0% o/w +4.0% like-for-like<br />
+4.6% o/w +3.8% like-for-like<br />
+3.5% o/w +1.4% like-for-like<br />
+3.0% o/w +2.6% like-for-like<br />
+2.2% o/w +1.9% like-for-like<br />
+2.3% o/w +0.4% like-for-like<br />
+23.2%<br />
+26.8%<br />
+22.6%<br />
+21.6%<br />
+20.0%<br />
+15.1%<br />
+8.3%<br />
+6.8%<br />
+5.0%<br />
- Dynamic underlying demand<br />
- Improved product mix/UV protection<br />
- Successes with key accounts<br />
- Good performance in France<br />
- Promising launch of Varilux ® S series<br />
- South Europe and Instruments weak<br />
- Robust dynamics in Brazil<br />
- Key partnerships in Mexico and Columbia<br />
- Weak economy in Argentina<br />
- Strong performance in China and India<br />
- Good year in Japan<br />
- Expansion in new high potential markets<br />
- Rigorous deployment of the strategy<br />
- New products and services<br />
- Market share gains in all regions<br />
(1) Mexico revenue (€15.9m in 2011) has been reclassified from the North America region to the Latin America region<br />
Reported revenue / Growth: like-for-like and bolt-on acquisitions combined<br />
<strong>2012</strong> <strong>Results</strong><br />
16
… and All Business Segments<br />
<strong>2012</strong>/11 2011/10 2010/09<br />
Equipment<br />
€199m<br />
+2.4%<br />
+21.9%<br />
+38.0%<br />
- Return to normal after high comparatives<br />
- Strong intra-group activity<br />
- Customer segmentation<br />
Readers<br />
€344m<br />
+6.6%<br />
+4.5%<br />
+6.9%<br />
- Robust growth in Sunglasses<br />
- Expansion at new key accounts<br />
- Integration of Stylemark in line with plan<br />
Reported revenue / Growth: like-for-like and bolt-on acquisitions combined<br />
<strong>2012</strong> <strong>Results</strong><br />
17
24 Bolt-on Acquisitions (1)<br />
Representing €171m in Full-Year Revenues<br />
Europe<br />
1<br />
Asia<br />
5<br />
North America<br />
9<br />
Africa – Middle East<br />
4<br />
Oceania<br />
1<br />
Latin America<br />
4<br />
(1) Local acquisitions or partnerships<br />
<strong>2012</strong> <strong>Results</strong> 18
Stylemark Integration Fully on Track<br />
Building a strong American leader shipping 130 million units at 85,000 doors<br />
› Increased presence in Department store channel<br />
› Operations regrouped under single headquarters in the course of H1 2013<br />
› FGX’s Field service model applied to common customers<br />
Positive impact on <strong>Essilor</strong>’s accounts<br />
› Synergies of c.$5m in <strong>2012</strong> (excluding PPA)<br />
› Further sales and cost synergies in 2013<br />
› Neutral to <strong>2012</strong> EPS and accretive in 2013<br />
<strong>2012</strong> <strong>Results</strong><br />
19
Fast-Growing Markets (1) :<br />
On Track to Achieve Revenue of €1.5 Billion by 2015<br />
Revenue: €911m<br />
Up 27.3% (2)<br />
Russia<br />
+18%<br />
China<br />
+47%<br />
North Asia<br />
+17%<br />
Africa – Middle East<br />
+49%<br />
India<br />
+43%<br />
ASEAN<br />
+13%<br />
Latin America<br />
+23%<br />
(1) Fast-growing markets include China, India, ASEAN, South Korea,<br />
Hong Kong, Taiwan, Africa, the Middle East, Russia and Latin America<br />
(2) Growth: like-for-like and bolt-on acquisitions combined<br />
including: Lenses and Optical instruments, Equipment & Readers<br />
<strong>2012</strong> <strong>Results</strong> 20
Earnings per Share Up 14.7%<br />
In € millions <strong>2012</strong> 2011 % Change<br />
Revenue 4,989 4,190 +19.1%<br />
Gross profit<br />
% of revenue<br />
2,784<br />
55.8%<br />
2,322<br />
55.4%<br />
+19.9%<br />
Contribution from operations (1)<br />
894<br />
748<br />
+19.5%<br />
% of revenue<br />
17.9%<br />
17.9%<br />
Operating profit 832 683 +21.8%<br />
Profit of fully consolidated companies 607 490 +23.7%<br />
Profit attributable to equity holders<br />
584<br />
506<br />
+15.5%<br />
% of revenue<br />
11.7%<br />
12.1%<br />
Earnings per share (in €) 2.80 2.44 +14.7%<br />
(1) Operating profit before compensation costs of share-based payments, restructuring costs, other income & expense and goodwill impairment<br />
<strong>2012</strong> <strong>Results</strong> 21
Impact of PPA and Acquisition Costs on Profitability<br />
In € millions <strong>2012</strong> 2011 2010 2009 2008<br />
Revenue 4,989 4,190 3,892 3,268 3,074<br />
PPA (27.3) (22.2) (18.4) (12.3) (7.5)<br />
Bolt-on acquisition costs (5.8) (3.9) (6.6) 0* 0*<br />
Impact on contribution margin -70 bp -60 bp -60 bp -40 bp -20 bp<br />
Strategic acquisition costs (1.6) (7.5) (6.5) 0* 0*<br />
Full EPS impact (in cents) (12) (12) (10) (6) (3)<br />
* IFRS 3 Revised has applied since 2010<br />
Contribution margin excluding PPA<br />
and bolt-on acquisition costs: 18.6%<br />
<strong>2012</strong> <strong>Results</strong><br />
22
Other Income and Other Expense<br />
In € millions <strong>2012</strong> 2011<br />
%<br />
Change<br />
Contribution from operations (1) 894 748 +19.5%<br />
Other income and other expense (62.4) (65.1)<br />
o/w restructuring costs (25.3) (22.6)<br />
o/w compensation costs for share-based payment,<br />
acquisition costs and impairment losses<br />
(30.8) (30.7)<br />
o/w other expenses (21.9) (9.3)<br />
o/w net gain/(loss) on asset disposals 15.6 (2.5)<br />
Operating profit 832 683 +21.8%<br />
(1) Operating profit before compensation costs of share-based payments, restructuring costs, other income & expense and goodwill impairment<br />
<strong>2012</strong> <strong>Results</strong><br />
23
Profit Attributable to Equity Holders Up 15.5%<br />
In € millions <strong>2012</strong> 2011<br />
%<br />
Change<br />
Contribution from operations (1) 894 748 +19.5%<br />
Other income and other expense (62.4) (65.1)<br />
Operating profit 832 683 +21.8%<br />
Financial result (18.0) (13.4)<br />
Income tax<br />
Effective tax rate<br />
(207.1)<br />
25.5%<br />
(179.4)<br />
26.8%<br />
Contribution from associates 23.8 27.9<br />
Transitions<br />
business with 3 rd<br />
parties<br />
Success of<br />
partnerships<br />
Minority interests (46.4) (12.6)<br />
Profit attributable to equity holders<br />
584<br />
506<br />
+15.5%<br />
% of revenue<br />
11.7%<br />
12.1%<br />
(1) Operating profit before compensation costs of share-based payments, restructuring costs, other income & expense and goodwill impairment<br />
<strong>2012</strong> <strong>Results</strong><br />
24
Operating Leverage at Work<br />
Contribution margin*<br />
+0.3%<br />
+0.3% -0.2%<br />
-0.4%<br />
Structures in FGM<br />
Sales & Marketing<br />
17.9%<br />
Efficiencies<br />
18.2%<br />
17.9%<br />
2011<br />
reported<br />
Operating<br />
leverage on<br />
2011 business<br />
base<br />
<strong>2012</strong><br />
before<br />
change in<br />
consolidation,<br />
bolt-on and<br />
strategic<br />
acquisitions<br />
Change in<br />
consolidation**<br />
Bolt-on<br />
acquisitions***<br />
Strategic<br />
acquisitions****<br />
<strong>2012</strong><br />
reported<br />
* Contribution from operations (operating profit before compensation costs of share-based payments, restructuring costs, other income &<br />
expense and goodwill impairment) as a percentage of revenue<br />
** Nikon <strong>Essilor</strong> & <strong>Essilor</strong> Korea<br />
*** Local acquisitions or partnerships<br />
**** H1: Shamir / Full year: Stylemark<br />
<strong>2012</strong> <strong>Results</strong><br />
25
Investing in New Capacity to Support Growth<br />
9%<br />
Capital expenditure (net of disposals)<br />
As a percentage of revenue<br />
in € millions<br />
8%<br />
7%<br />
6%<br />
5%<br />
192<br />
7.1%<br />
224<br />
7.7%<br />
5.9%<br />
183<br />
<br />
<br />
<br />
192<br />
Digital Surfacing, Export Labs…<br />
Innovation & Technology Centers<br />
Readers new Key Accounts<br />
232<br />
4%<br />
116 124<br />
4.6% 4.7%<br />
3%<br />
2%<br />
3.5%<br />
3.2%<br />
1%<br />
0%<br />
2006 2007 2008 2009 2010 2011 <strong>2012</strong><br />
<strong>2012</strong> <strong>Results</strong><br />
26
Free Cash Flow Up 29%<br />
In € millions<br />
241<br />
Capital expenditure<br />
10<br />
Change in WCR<br />
Operating cash flow<br />
(excl. change in WCR)<br />
848<br />
201<br />
Dividends<br />
+597<br />
193<br />
Net financial investments<br />
112<br />
Share buybacks<br />
48<br />
Change in consolidation<br />
Capital increase<br />
Misc. 12<br />
118<br />
269<br />
Reported change in net debt<br />
<strong>2012</strong> <strong>Results</strong><br />
27
Strong Financial Position<br />
In € millions<br />
Equity<br />
Net Debt<br />
3,458<br />
3,921<br />
1,892<br />
2,168<br />
2,366<br />
2,735<br />
3,044<br />
(210) (260)<br />
112<br />
(93)<br />
296<br />
506<br />
237<br />
2006 2007 2008 2009* 2010 2011 <strong>2012</strong><br />
* Adjusted for acquisition-related costs in accordance with IFRS 3R<br />
<strong>2012</strong> <strong>Results</strong><br />
28
Dividend Per Share: €0.88*<br />
Total payout (in € millions)<br />
Dividend per share (in €)<br />
0.83<br />
0.85<br />
0.88*<br />
0.62<br />
0.66<br />
0.70<br />
129<br />
137<br />
147<br />
172 177<br />
184<br />
2007 2008 2009 2010 2011 <strong>2012</strong>*<br />
* Submitted to shareholder approval at the May 16, 2013 Annual Meeting<br />
<strong>2012</strong> <strong>Results</strong><br />
29
Transitions: Background to discussions with PPG Industries<br />
New challenges of the photochromic market<br />
› The photochromic market is growing rapidly in high-growth countries as well as in the<br />
mid-range<br />
› Certain manufacturing customers of Transitions and new Asian players are developing<br />
alternative solutions<br />
› Increasing integration of value at laboratory level (digital surfacing and In lab casting)<br />
At the same time<br />
› Transitions’ growth has slowed<br />
› Transitions is very focused on the United States with a high-end brand and products<br />
› Transitions is dependent on certain manufacturers including <strong>Essilor</strong>, its main customer<br />
Objective of discussions with PPG Industries:<br />
Adapt the governance of Transitions to respond to these new<br />
challenges and better serve the industry and the consumer<br />
<strong>2012</strong> <strong>Results</strong> 30
<strong>Essilor</strong> Bolstered<br />
by Strong Financial Performance in <strong>2012</strong><br />
Revenue<br />
+19.1%<br />
Gross margin<br />
55.8% of revenue<br />
+40 bp<br />
17.9% of revenue<br />
including strategic acquisitions<br />
Contribution margin (1) from 23% to 20%<br />
Working Capital Requirement<br />
of revenue<br />
Reduction in net debt<br />
€269m<br />
(1) Contribution from operations (operating profit before compensation costs of share-based payments, restructuring<br />
costs, other income & expense and goodwill impairment) as a percentage of revenue<br />
<strong>2012</strong> <strong>Results</strong> 31
Agenda<br />
Introduction<br />
Operational and Financial Performance<br />
Innovation<br />
Crizal ® Prevencia<br />
Strategy and Outlook<br />
<strong>2012</strong> <strong>Results</strong><br />
32
The Ophthalmic Industry is in its Early Stages<br />
Unsolved problems<br />
And unmet needs<br />
Personalization<br />
Digital surfacing<br />
New surface function<br />
First Transitions ® photochromic lenses<br />
First Crizal ® antireflective coatings<br />
Plastic lenses<br />
First Varilux ® progressive lenses<br />
<br />
Where we currently stand<br />
<strong>2012</strong> <strong>Results</strong> 33
Many New Fields of Research…<br />
Personalization Ageing Health<br />
<strong>2012</strong> <strong>Results</strong> 34
… And Highly Promising Innovation Curves<br />
Visual Acuity<br />
Where we currently stand<br />
Digital surfacing<br />
New surface function<br />
Plastic lenses<br />
First Varilux ® progressive lenses<br />
Comfort of Use<br />
Where we currently stand<br />
First Optifog lenses<br />
First Xperio ® lenses<br />
First Transitions ® photochromic lenses<br />
First Crizal ® antireflective coatings<br />
<strong>2012</strong> <strong>Results</strong> 35
… And Highly Promising Innovation Curves<br />
Visual Acuity<br />
Prevention/Protection<br />
Where we currently stand<br />
Digital surfacing<br />
New surface function<br />
Plastic lenses<br />
First Varilux ® progressive lenses<br />
<br />
Where we currently stand<br />
First Crizal ® UV lenses<br />
Comfort of Use<br />
Therapeutic Lenses<br />
Where we currently stand<br />
First Optifog lenses<br />
First Xperio ® lenses<br />
First Transitions ® photochromic lenses<br />
First Crizal ® antireflective coatings<br />
<strong>2012</strong> <strong>Results</strong> 36<br />
Where we currently stand<br />
First Myopilux lenses
Success of Recent Product Launches<br />
A new category<br />
Success with consumers<br />
New generation at the<br />
end of 2013<br />
Success in Europe & Canada:<br />
25% of Varilux ® volumes after<br />
4 months of launch<br />
US ongoing roll-out<br />
Strong start in the US<br />
Ramp up in Europe<br />
Crizal ® category growth<br />
>10% in value in <strong>2012</strong><br />
<strong>2012</strong> <strong>Results</strong> 37
… And Still Many Challenges to Meet…<br />
Amplified zone<br />
of phototoxicity<br />
Transmittance at retinal level<br />
Retinal photosensitizer absorption<br />
280 330 380 430 480 530 580 630 680 730 780<br />
λ (nm)<br />
NON-VISIBLE<br />
VISIBLE<br />
UV light<br />
<br />
<strong>2012</strong> <strong>Results</strong> 38
Agenda<br />
Introduction<br />
Operational and Financial Performance<br />
Innovation<br />
Crizal ® Prevencia<br />
Strategy and Outlook<br />
<strong>2012</strong> <strong>Results</strong><br />
39
40<br />
TM
Moving Beyond Vision Correction<br />
Since <strong>2012</strong>, <strong>Essilor</strong> has protected the eye<br />
CORNEA and CRYSTALLINE LENS against UV<br />
(from the lens front & back sides)<br />
In 2013, <strong>Essilor</strong> takes this to next level with<br />
RETINA protection against BLUE LIGHT<br />
<strong>2012</strong> <strong>Results</strong> 41
People Can Now Live 100 Years, BUT<br />
Eyes Start to Lose Natural Performance at Age 45 …<br />
<strong>2012</strong> <strong>Results</strong> 42
A Growing Health Issue<br />
Cataract<br />
AMD<br />
In millions of people<br />
2040<br />
In millions of people<br />
2040<br />
>500<br />
>200<br />
2013<br />
2013<br />
250<br />
100<br />
N.B.: Simplified Extrapolation Model of Cataract & AMD prevalence [<strong>Essilor</strong> Int., DMS, EL, Jan. 2013]<br />
Sources: United Nations, World Population Prospects, Epidemiological and Marketing studies<br />
<strong>2012</strong> <strong>Results</strong> 43
Understanding Light’s Crucial Role in Everyday Health<br />
Most of visible light is essential & beneficial<br />
› Acuity<br />
› Color perception<br />
› Pupillary reflex<br />
› Control of non-visual functions (circadian rhythm)<br />
Part of the light spectrum is harmful and even toxic<br />
› UV can cause crystalline lens opacity & cataract (possible surgery)<br />
› Blue light can cause retinal cell damage & AMD (no curative solution)<br />
NON-VISIBLE<br />
UV<br />
280nm<br />
380nm<br />
BLUE<br />
500nm<br />
VISIBLE<br />
780nm<br />
<strong>2012</strong> <strong>Results</strong> 44
<strong>Essilor</strong>’s Long-term EYE HEALTH Defense Program<br />
4 years ago,<br />
<strong>Essilor</strong> & Paris Vision Institute (IdV)* partnership<br />
embarked on a long-term eye health program<br />
The 1 st ever biological in vitro tests in the ophthalmic industry<br />
were conducted to identify the most toxic wavelengths in blue light:<br />
- Unique cell illumination system: narrow bands, natural sunlight retinal exposure.<br />
- Phototoxicity model with primary retinal cells.<br />
- Rigorous photometric protocol, etc…<br />
* Based in Paris, and linked to Pierre & Marie Curie University, IdV is considered as one of Europe's foremost integrated research Centers<br />
of Excellence on eye diseases and vision. Researchers, medical doctors and industry players work together for the discovery and clinical<br />
evidence of new therapeutic approaches and preventive solutions, as well as innovative compensatory technologies for vision impairments.<br />
<strong>2012</strong> <strong>Results</strong> 45
After 2 Years of Photobiology Cell Tests,<br />
<strong>Essilor</strong> & IdV Have Released Their SCIENTIFIC DISCOVERY<br />
Phototoxicity screening and elucidation of a very specific band,<br />
435nm +/- 20nm, that is the most noxious for target retinal cells,<br />
corresponding to the Blue-Violet light<br />
Healthy<br />
RPE* cells<br />
Degenerated<br />
RPE cells<br />
*RPE – Retinal Pigment Epithelium<br />
<strong>2012</strong> <strong>Results</strong> 46
Selective Light Filter to Improve Eye Protection<br />
NON-VISIBLE<br />
UV<br />
280nm<br />
380nm<br />
BLUE<br />
500nm<br />
VISIBLE<br />
780nm<br />
UV light<br />
435nm<br />
BLUE-VIOLET light<br />
Risks even in cloudy weather (40%)<br />
Skin damage, corneal damage<br />
Crystalline-lens opacity<br />
Risks outdoor and more & more indoor (LED)<br />
CATARACT<br />
Retinal cell degeneration<br />
AMD<br />
<strong>2012</strong> <strong>Results</strong> 47
A New Technology Allowing SELECTIVE PROTECTION<br />
Thanks to 20 years of R&D expertise in selective light<br />
filtering, <strong>Essilor</strong> once again overcomes a trade-off and delivers a<br />
clear lens combining 3 features at the same time:<br />
PATENT<br />
APPLICATIONS<br />
PENDING<br />
Excellent protection against HARMFUL LIGHT<br />
Excellent transmittance of ESSENTIAL LIGHT<br />
Excellent TRANSPARENCY<br />
<strong>2012</strong> <strong>Results</strong> 48
Introducing….<br />
First application of<br />
The MOST SELECTIVE EYE PROTECTION in the market:<br />
› 25% less light-induced retinal cell death rate versus the naked eye<br />
› 25x protection against UV rays versus the naked eye (E-SPF TM 25)<br />
› The most complete lens protection, as expected from Crizal ®<br />
Cuts Blue-Violet light<br />
Cuts UV<br />
<strong>2012</strong> <strong>Results</strong><br />
49
2 Strategic Targets for<br />
Blue-Violet light and UV light hazard<br />
have a cumulative life-long effect<br />
Blue-Violet light<br />
hazard<br />
Age-related<br />
accumulation of toxic<br />
lipofuscin in Retina<br />
Recommended for everyone, especially<br />
Kids45 based on age-related<br />
light risks<br />
<strong>2012</strong> <strong>Results</strong><br />
50
Market Size & Pricing Strategy<br />
Market Size<br />
1.3 billion people worldwide in 2013<br />
Population stable over time<br />
Kids 45 years old<br />
Pricing Strategy<br />
Better eye health protection justifies a price premium<br />
versus Crizal ® Forte UV<br />
<strong>2012</strong> <strong>Results</strong><br />
51
Launch Strategy of<br />
April 2013: Country pilots & getting key opinion leaders involved<br />
September 2013: Global launch<br />
Europe:<br />
Sept 2013<br />
North America:<br />
Sept 2013<br />
Asia-Oceania<br />
Middle East-Africa:<br />
Sept 2013/Q1 2014<br />
Latin America:<br />
Sept 2013<br />
<strong>2012</strong> <strong>Results</strong><br />
52
<strong>Essilor</strong> Crizal ® Prevencia lenses are Class I medical devices intended for the correction of ametropias and presbyopia and offering selective protection from harmful blue light and UV rays. In compliance with French law of December 29th, 2011<br />
andwith the decree of May 9th, <strong>2012</strong> <strong>Essilor</strong> informs you that the above information is general information given as prevention and public awareness. For more information <strong>Essilor</strong> invites you to consult a healthcare professional.<br />
53
Crizal ® Prevencia:<br />
A New Step Forward in Eye Protection<br />
<strong>2012</strong> <strong>Results</strong><br />
54
<strong>2012</strong> <strong>Results</strong><br />
55
Agenda<br />
Introduction<br />
Operational and Financial Performance<br />
Innovation<br />
Crizal ® Prevencia<br />
Strategy and Outlook<br />
<strong>2012</strong> <strong>Results</strong><br />
56
Poor Vision: A Global Handicap Throughout the World…<br />
Solutions Exist for All Conditions<br />
2030<br />
6.0<br />
billion<br />
<strong>2012</strong><br />
4.2<br />
billion<br />
Number of people requiring vision correction in the world<br />
Source: <strong>Essilor</strong> estimate<br />
<strong>2012</strong> <strong>Results</strong> 57
Optical Market: An Accelerating Growth Path<br />
Strong Impact from Demographics<br />
Need for Vision Correction is Increasing<br />
Per Capita GDP Growth Drives Volume & Value<br />
Product Mix is Changing Rapidly<br />
Social and Economic Impact of Poor Vision<br />
<strong>2012</strong> <strong>Results</strong><br />
58
Strong Impact from Demographics<br />
Fast-Growing Markets<br />
drive population growth<br />
Aged population growth exceeds<br />
total population growth by 2 to 3 times<br />
World population<br />
In billions of people<br />
8.3<br />
Population over 45 years old<br />
In millions of people<br />
2,821<br />
7.0<br />
CAGR: +1.0%<br />
1,921<br />
CAGR: +2.2%<br />
Fast-Growing Markets:<br />
+1.0%<br />
North America: +0.8%<br />
Europe: +0.2%<br />
Other developed: +0.1%<br />
Over 60 years old:<br />
+3.0%<br />
<strong>2012</strong><br />
<strong>2012</strong> 2030<br />
<strong>2012</strong><br />
<strong>2012</strong> 2030<br />
Source: Worldbank<br />
<strong>2012</strong> <strong>Results</strong> 59
Need for Vision Correction is Increasing<br />
Myopia<br />
Presbyopia<br />
In billions of people<br />
2030<br />
In billions of people<br />
2030<br />
2.7<br />
33%*<br />
2.8<br />
34%*<br />
<strong>2012</strong><br />
<strong>2012</strong><br />
1.5<br />
24%*<br />
1.9<br />
27%*<br />
* As a percentage of worldwide population<br />
Lifestyle changes increase vision needs<br />
Migration and Urbanization: urban population +1.5 billion by 2030<br />
Source: United Nation, CIA, <strong>Essilor</strong> analysis<br />
<strong>2012</strong> <strong>Results</strong> 60
Per Capita GDP Growth Drives Volume & Value<br />
Volume Growth potential<br />
Spectacle lenses per person with correction need (<strong>2012</strong>)<br />
Value Growth potential<br />
Price to consumer (log $)<br />
1.0 1,0<br />
Canada<br />
UK<br />
USA<br />
Size proportional to<br />
the population with<br />
correction need<br />
30 M<br />
0.8 0,8<br />
0.6 0,6<br />
0.4 0,4<br />
Indonesia<br />
Egypt<br />
0.2 0,2<br />
0,0<br />
Brazil<br />
China<br />
Russia<br />
Mexico<br />
Philippines Hungary<br />
India<br />
0 10,000 10000 20,000 20000 30,000 30000 40,000 40000 50,000 50000 60,000 60000<br />
Fast-Growing Markets<br />
France<br />
Austria<br />
Malaysia Germany Netherlands<br />
Argentina Finland<br />
Belgium<br />
Hong-Kong<br />
Italy Sweden<br />
Turkey<br />
Switzerland<br />
Taiwan<br />
Slovenia<br />
Slovakia SpainDK<br />
Ireland<br />
Poland NZ<br />
S. Africa<br />
Thailand<br />
Portugal<br />
Czech Japan<br />
Australia<br />
GDP per capita<br />
(in PPP USD, <strong>2012</strong>)<br />
Developed Markets<br />
Geography with<br />
strong market growth<br />
in value (CAGR<br />
<strong>2012</strong>-2017 > 5%)<br />
GDP per capita (log $)<br />
$2,000 $20,000 $100,000<br />
Fast-Growing Markets Developed Markets<br />
Fast-Growing Markets per capita GDP: +8% per year<br />
Middle class: from 26% (<strong>2012</strong>) to 59% (2030) of worldwide population<br />
Source: Worldbank, <strong>Essilor</strong> estimate, Estin & Co.<br />
<strong>2012</strong> <strong>Results</strong> 61
Product Mix is Changing Rapidly<br />
Progressive lenses<br />
Anti-reflective lenses<br />
Thin lenses (index>=1.6)<br />
14%<br />
15%<br />
16.5%<br />
48%<br />
57%<br />
66%<br />
12%<br />
15%<br />
20%<br />
2007<br />
<strong>2012</strong> 2017<br />
2007<br />
<strong>2012</strong> 2017<br />
2007<br />
<strong>2012</strong> 2017<br />
2%<br />
13%<br />
26% 31% 49%<br />
13% 24% 37%<br />
60%<br />
100%<br />
2% 4% 6% 14% 60%<br />
China Italy USA France New<br />
Argentina India USA Spain Japan<br />
Zealand<br />
Penetration of total lens market in volume / Source: <strong>Essilor</strong> estimate<br />
Brazil Czech. USA China Korea<br />
Rep.<br />
Strong consumer benefits driven by innovation<br />
Demand for better vision drives product mix<br />
<strong>2012</strong> <strong>Results</strong> 62
Increasing Recognition<br />
of Social and Economic Impact of Poor Vision<br />
Children Workers Elderly Drivers<br />
810<br />
million<br />
1,100<br />
million<br />
300<br />
million<br />
280<br />
million<br />
Uncorrected<br />
Uncorrected<br />
Uncorrected<br />
Uncorrected<br />
$275 billion<br />
Global economic productivity loss due to poor vision<br />
Source: World Health Organization, BCG<br />
<strong>2012</strong> <strong>Results</strong> 63
A Further 1.4 Billion People Will Correct their Vision by 2030<br />
<strong>2012</strong><br />
1.7<br />
billion<br />
Corrected<br />
CAGR: +3.4%<br />
2030<br />
3.1<br />
billion<br />
Corrected<br />
Source: <strong>Essilor</strong> estimate<br />
But 2.9 billion will remain<br />
uncorrected in 2030<br />
<strong>2012</strong> <strong>Results</strong> 64
Fundamental Characteristics Driving<br />
Mid-Term Growth of the Optics Industry<br />
A Fragmented Industry<br />
Robust Momentum in Fast-Growing Markets<br />
Strength of the US Market<br />
Strong Demand for Innovation<br />
Increasing Accessibility to Vision Care<br />
<strong>2012</strong> <strong>Results</strong><br />
65
A Fragmented Industry where Consolidation has Only Started<br />
Breakdown of<br />
local leaders*<br />
Spectacle Lenses<br />
Readers<br />
Plano Sun<br />
Manufacturers<br />
<strong>Essilor</strong> 150 to 200<br />
Small operators<br />
250 to 350 Manufacturers<br />
Distributors<br />
& Laboratories<br />
1,500 to 2,000<br />
Local operators<br />
500-600<br />
150-200<br />
400-600<br />
400-500<br />
Retail<br />
200-300<br />
1.2 Billion<br />
Rx lenses<br />
220 Million<br />
Readers<br />
Pairs<br />
420 Million<br />
Plano Sun<br />
Pairs<br />
Source: <strong>Essilor</strong> estimate, 2011 Infomarket, VisionWatch 2011<br />
* Only for spectacle lenses<br />
An industry led by strong, local entrepreneurs<br />
Accelerating new technologies and innovations push need to consolidate<br />
<strong>2012</strong> <strong>Results</strong> 66
Robust Momentum in Fast-Growing Markets<br />
Which Are Less Sensitive to Economic Conditions<br />
20<br />
15<br />
Expected market growth in value<br />
(CAGR <strong>2012</strong>-2017, in %)<br />
9 MPc<br />
Size proportional to market<br />
size in volume <strong>2012</strong><br />
Russia<br />
India<br />
China<br />
China: the largest presbyope<br />
market in the world<br />
Middle-Class*<br />
In millions of people<br />
Presbyopes**<br />
In millions of people<br />
10<br />
5<br />
0<br />
Ghana<br />
Kenya<br />
Kazakhstan<br />
Colombia<br />
Egypt<br />
Turkey<br />
Ethiopia<br />
Vietnam<br />
Costa Rica<br />
Chile<br />
Morocco<br />
Saudi Arabia<br />
Brazil<br />
Dom Rep.<br />
Nigeria<br />
UAE<br />
Mexico<br />
South Africa<br />
Serbia<br />
USA<br />
Croatia Finland Argentina<br />
Canada<br />
Ireland<br />
Taiwan<br />
UK<br />
Norway<br />
France<br />
Denmark<br />
Netherlands<br />
Switzerland<br />
Spain Japan<br />
Germany<br />
<strong>2012</strong><br />
300<br />
2020<br />
580<br />
<strong>2012</strong><br />
450<br />
2020<br />
570<br />
0,2 0,5 1 2 5 10 20 50 100<br />
200<br />
Market volume in <strong>2012</strong> (millions of lenses)<br />
* Annual Income of US$ 10,000 – 60,000<br />
* * > 45 years old<br />
Source: <strong>Essilor</strong> estimate, Estin & Co.<br />
Source: Worldbank, Wolfensohn Center for Development<br />
India: one of the fastest growing optical markets<br />
Africa & Middle East: catching up fast<br />
<strong>2012</strong> <strong>Results</strong> 67
Catch-Up Supporting Growth of the US Industry<br />
Progressive lenses<br />
Antireflective<br />
lenses<br />
Photochromic<br />
lenses<br />
Thin lenses (index>=1.6)<br />
50%<br />
95%<br />
70%<br />
27%<br />
26%<br />
20%<br />
37%<br />
6%<br />
USA<br />
Denmark<br />
USA<br />
China<br />
USA<br />
South Africa<br />
USA<br />
Japan<br />
Penetration of total lens market in volume / Source: <strong>Essilor</strong> estimate<br />
US market grew ~3% in volume in <strong>2012</strong><br />
Fast deployment of coating and digital surfacing capabilities<br />
<strong>2012</strong> <strong>Results</strong> 68
Strong Demand for Innovation<br />
from Professionals and Consumers Alike<br />
Consumers<br />
Eye-Care Professionals<br />
Laboratories<br />
Backside UV protectors represent 50% of Crizal ® lenses, just 1 year after launch<br />
60% of progressive lenses in Europe are digitalized after just 3 years<br />
<strong>2012</strong> <strong>Results</strong> 69
Improving Distribution Networks & Accessibility<br />
Entry level<br />
Mid-range<br />
Internet<br />
High-end<br />
Over 20,000 new Eye-Care Professionals per year<br />
Digital development driving growth of e-retail<br />
<strong>2012</strong> <strong>Results</strong> 70
A Strategy that Delivers <strong>Results</strong><br />
INNOVATE<br />
DEVELOP<br />
GROW<br />
STIMULATE<br />
Products and<br />
Services<br />
Top & Midrange<br />
markets<br />
Acquisitions &<br />
Partnerships<br />
Demand<br />
for Vision<br />
Improvement<br />
Operational and management efficiency<br />
Corporate social responsibility<br />
<strong>2012</strong> <strong>Results</strong><br />
71
Key Areas of Focus for 2013<br />
Talent Pool<br />
Innovation<br />
Market<br />
consolidation<br />
Operational<br />
Gains<br />
Improving<br />
Worldwide<br />
Vision<br />
Fast-Growing<br />
Markets<br />
Supply chain<br />
Developed<br />
Markets<br />
<strong>2012</strong> <strong>Results</strong><br />
72
Maximizing Value Creation through Innovation<br />
Innovation Market Consolidation Fast-Growing Markets Developed Markets<br />
Leveraging<br />
partnerships<br />
Cascading down<br />
Seeking out unmet<br />
consumer needs<br />
ITC* Dallas (<strong>2012</strong>)<br />
ITC* Créteil (2013)<br />
New technologies are driving segmented products and services: Personalization<br />
* ITC: Innovation & Technology Center<br />
Upgrading and innovating frequently and with differentiation<br />
at every price points<br />
<strong>2012</strong> <strong>Results</strong><br />
73
Gaining Share through Market Consolidation<br />
Innovation Market Consolidation Fast-Growing Markets Developed Markets<br />
Wholesalers,<br />
laboratories & casters Technologies New footprints<br />
Morocco<br />
Tunisia<br />
Laos<br />
Dominican<br />
Republic<br />
Turkey<br />
Colombia<br />
Sri Lanka<br />
Togo<br />
Côte d’Ivoire<br />
Chile<br />
Local market shares between 3% and 50%+<br />
Still over 130 countries with no direct distribution<br />
<strong>2012</strong> <strong>Results</strong><br />
77
Accelerating Development in Fast-Growing Markets<br />
Innovation Market Consolidation Fast-Growing Markets Developed Markets<br />
Brands and Innovation<br />
in high-end market<br />
Partnerships in<br />
mid-range market<br />
To generate a minimum of 25% growth per year<br />
A unique business model based on governance,<br />
culture and technology<br />
<strong>2012</strong> <strong>Results</strong><br />
78
Leveraging our Strengths in Developed Markets<br />
Innovation Market Consolidation Fast-Growing Markets Developed Markets<br />
Multinetworks<br />
Brands<br />
Integrated<br />
Business Solutions<br />
Significant media spend in 2013 on major brands<br />
Pricing and sales force efficiencies<br />
<strong>2012</strong> <strong>Results</strong><br />
83
Integrated Supply Chain to Improve Efficiency and Service<br />
Supply Chain Operational Gains Talent Pool Improving Vision Worldwide<br />
Europe:<br />
47<br />
North America: 163<br />
x3<br />
Asia – Oceania – Africa<br />
– Middle East:<br />
161<br />
13 <strong>Essilor</strong> Plants<br />
9 Partner Plants<br />
> 400 Local Prescription Labs<br />
7 Export Prescription Labs<br />
16 Distribution Centers<br />
Latin America: 31<br />
Designing innovative offers/solutions to increase value creation<br />
Complete end-to-end supply chain<br />
<strong>2012</strong> <strong>Results</strong><br />
87
2000<br />
2001<br />
2002<br />
2003<br />
2004<br />
2005<br />
2006<br />
2007<br />
2008<br />
2009<br />
2010<br />
2011<br />
Operational Gains to Continue Financing Growth<br />
Supply Chain Operational Gains Talent Pool Improving Vision Worldwide<br />
Reducing<br />
cost of goods Improving capacity Productivity gains<br />
120<br />
100<br />
80<br />
60<br />
40<br />
20<br />
0<br />
Unit Production Cost for Polycarbonate<br />
Lens (1) halved in 11 years<br />
New tooling for Multicoat<br />
deposition: +20% capacity (2)<br />
New, shorter process<br />
+20% productivity (3)<br />
Leveraging sourcing from all partners<br />
Optimizing the laboratory network<br />
(1) SFSV Lens / Base 100 in 2000 / Not adjusted for inflation - (2) Average capacity increase thanks to Gen IV tooling, depending on lens caliber - (3) 2013 implementation<br />
<strong>2012</strong> <strong>Results</strong><br />
89
Strengthening our Talent Pool to Support Growth<br />
Supply Chain Operational Gains Talent Pool Improving Vision Worldwide<br />
Lenses & Optical Instruments<br />
Equipments<br />
Readers<br />
Paris<br />
Baar<br />
Shanghai<br />
Dallas<br />
Rhode Island<br />
Dubai<br />
Bangalore<br />
Bangkok<br />
Singapore<br />
Mexico<br />
Rio de Janeiro<br />
Reinforcing local presence in regional hubs<br />
Worldwide deployment of “<strong>Essilor</strong> Principles”<br />
<strong>2012</strong> <strong>Results</strong><br />
90
53,000 People and<br />
a Unique Entrepreneurial Model with a Simple Mission<br />
Supply Chain Operational Gains Talent Pool Improving Vision Worldwide<br />
Improving<br />
the Vision of<br />
4.2 Billion<br />
People<br />
<strong>2012</strong> <strong>Results</strong><br />
91
Outlook for 2013<br />
Revenue Growth: more than 7%<br />
combined like-for-like and bolt-on acquisitions (1) growth<br />
Contribution from operations (2) :<br />
Maintain current high level of profitability<br />
(1) Local acquisitions or partnerships<br />
(2) Operating profit before compensation costs of share-based payments, restructuring costs, other income<br />
& expense and goodwill impairment<br />
<strong>2012</strong> <strong>Results</strong><br />
93