download the turkey energy revolution scenario
download the turkey energy revolution scenario
download the turkey energy revolution scenario

You also want an ePaper? Increase the reach of your titles
YUMPU automatically turns print PDFs into web optimized ePapers that Google loves.
GLOBAL ENERGY [R]EVOLUTION<br />
A SUSTAINABLE TURKEY ENERGY OUTLOOK<br />
key results of <strong>the</strong> <strong>turkey</strong> <strong>energy</strong> [r]evolution <strong>scenario</strong><br />
6<br />
“for us to develop in a sustainable way, strong measures<br />
have to be taken to combat climate change.”<br />
HU JINTAO,<br />
PRESIDENT OF CHINA<br />
© BERND JUERGENS/DREAMSTIME<br />
6 population development<br />
One important underlying factor in <strong>energy</strong> <strong>scenario</strong> building is future<br />
population development. Population growth affects <strong>the</strong> size and<br />
composition of <strong>energy</strong> demand, directly and through its impact on<br />
economic growth and development. World Energy Outlook 2007 uses <strong>the</strong><br />
United Nations Development Programme (UNDP) projections for<br />
population development. For this study <strong>the</strong> most recent population<br />
projections from UNDP up to 2050 are applied. 28 The world’s population<br />
is expected to grow by 0.77% on average over <strong>the</strong> period 2005 to 2050,<br />
from 6.5 billion people in 2005 to more than 9.1 billion in 2050.<br />
Population growth will slow over <strong>the</strong> projection period, from 1.2% during<br />
2005-2010 to 0.4% during 2040-2050. However, <strong>the</strong> updated<br />
projections show an increase in population of almost 300 million<br />
compared to <strong>the</strong> previous edition. This will fur<strong>the</strong>r increase <strong>the</strong> demand<br />
for <strong>energy</strong>. The population of <strong>the</strong> developing regions will continue to grow<br />
most rapidly. The Transition Economies will face a continuous decline,<br />
followed after a short while by <strong>the</strong> OECD Pacific countries. OECD<br />
Europe and OECD North America are expected to maintain <strong>the</strong>ir<br />
population, with a peak in around 2020/2030 and a slight decline<br />
afterwards. The share of <strong>the</strong> population living in today’s Non-OECD<br />
countries will increase from <strong>the</strong> current 82% to 86% in 2050. China’s<br />
contribution to world population will drop from 20% today to 15% in<br />
2050. Africa will remain <strong>the</strong> region with <strong>the</strong> highest growth rate, leading<br />
to a share of 21% of world population in 2050. Satisfying <strong>the</strong> <strong>energy</strong><br />
needs of a growing population in <strong>the</strong> developing regions of <strong>the</strong> world in an<br />
environmentally friendly manner is a key challenge for achieving a global<br />
sustainable <strong>energy</strong> supply. The Turkish population is projected to grow<br />
from 73 million people in 2005 to 99 million in 2050.<br />
economic growth<br />
Economic growth is a key driver for <strong>energy</strong> demand. Since 1971, each<br />
1% increase in global Gross Domestic Product (GDP) has been<br />
accompanied by a 0.6% increase in primary <strong>energy</strong> consumption. The<br />
decoupling of <strong>energy</strong> demand and GDP growth is <strong>the</strong>refore a prerequisite<br />
for reducing demand in <strong>the</strong> future. Most global <strong>energy</strong>/economic/<br />
environmental models constructed in <strong>the</strong> past have relied on market<br />
exchange rates to place countries in a common currency for estimation<br />
and calibration. This approach has been <strong>the</strong> subject of considerable<br />
discussion in recent years, and <strong>the</strong> alternative of purchasing power parity<br />
(PPP) exchange rates has been proposed. Purchasing power parities<br />
compare <strong>the</strong> costs in different currencies of a fixed basket of traded and<br />
non-traded goods and services and yield a widely-based measure of <strong>the</strong><br />
standard of living. This is important in analysing <strong>the</strong> main drivers of<br />
<strong>energy</strong> demand or for comparing <strong>energy</strong> intensities among countries.<br />
Although PPP assessments are still relatively imprecise compared to<br />
statistics based on national income and product trade and national price<br />
indexes, <strong>the</strong>y are considered to provide a better basis for global <strong>scenario</strong><br />
34<br />
development. 29 Thus all data on economic development in WEO 2007<br />
refers to purchasing power adjusted GDP. However, as WEO 2007 only<br />
covers <strong>the</strong> time period up to 2030, <strong>the</strong> projections for 2030-2050 are<br />
based on our own estimates. Prospects for GDP growth have increased<br />
considerably compared to <strong>the</strong> previous study, whilst underlying growth<br />
trends continue much <strong>the</strong> same. GDP growth in all regions is expected to<br />
slow gradually over <strong>the</strong> coming decades. World GDP is assumed to grow<br />
on average by 3.6% per year over <strong>the</strong> period 2005-2030, compared to<br />
3.3% from 1971 to 2002, and on average by 3.3% per year over <strong>the</strong><br />
entire modelling period.<br />
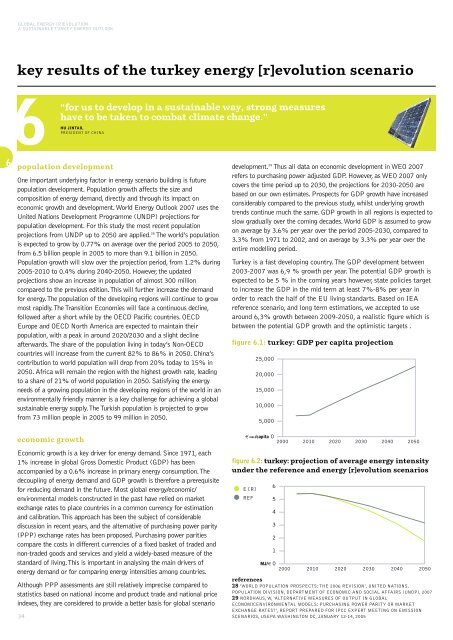
Turkey is a fast developing country. The GDP development between<br />
2003-2007 was 6,9 % growth per year. The potential GDP growth is<br />
expected to be 5 % in <strong>the</strong> coming years however, state policies target<br />
to increase <strong>the</strong> GDP in <strong>the</strong> mid term at least 7%-8% per year in<br />
order to reach <strong>the</strong> half of <strong>the</strong> EU living standarts. Based on IEA<br />
reference <strong>scenario</strong>, and long term estimations, we accepted to use<br />
around 6,3% growth between 2009-2050, a realistic figure which is<br />
between <strong>the</strong> potential GDP growth and <strong>the</strong> optimistic targets .<br />
figure 6.1: <strong>turkey</strong>: GDP per capita projection<br />
figure 6.2: <strong>turkey</strong>: projection of average <strong>energy</strong> intensity<br />
under <strong>the</strong> reference and <strong>energy</strong> [r]evolution <strong>scenario</strong>s<br />
E [R]<br />
• REF<br />
25,000<br />
20,000<br />
15,000<br />
10,000<br />
5,000<br />
€ 2005 /capita 0<br />
2000 2010 2020 2030 2040 2050<br />
6<br />
5<br />
4<br />
3<br />
2<br />
1<br />
MJ/€ 0<br />
2000 2010 2020 2030 2040 2050<br />
references<br />
28 ‘WORLD POPULATION PROSPECTS: THE 2006 REVISION’, UNITED NATIONS,<br />
POPULATION DIVISION, DEPARTMENT OF ECONOMIC AND SOCIAL AFFAIRS (UNDP), 2007<br />
29 NORDHAUS, W, ‘ALTERNATIVE MEASURES OF OUTPUT IN GLOBAL<br />
ECONOMICENVIRONMENTAL MODELS: PURCHASING POWER PARITY OR MARKET<br />
EXCHANGE RATES’, REPORT PREPARED FOR IPCC EXPERT MEETING ON EMISSION<br />
SCENARIOS, USEPA WASHINGTON DC, JANUARY 12-14, 2005
![Energy [R]evolution - European Commission](https://img.yumpu.com/49109324/1/184x260/energy-revolution-european-commission.jpg?quality=85)
![5905 gp [eu rev]csfr4.qxd - Energy [R]evolution](https://img.yumpu.com/42305023/1/184x260/5905-gp-eu-revcsfr4qxd-energy-revolution.jpg?quality=85)
![5905 gp [eu rev]csfr4.qxd - Energy [R]evolution](https://img.yumpu.com/28729264/1/184x260/5905-gp-eu-revcsfr4qxd-energy-revolution.jpg?quality=85)