Harden, J.W., K.L. Manies, J. O'Donnell, K. Johnson, S. Frolking, Z ...
Harden, J.W., K.L. Manies, J. O'Donnell, K. Johnson, S. Frolking, Z ...
Harden, J.W., K.L. Manies, J. O'Donnell, K. Johnson, S. Frolking, Z ...

Create successful ePaper yourself
Turn your PDF publications into a flip-book with our unique Google optimized e-Paper software.
G01012<br />
HARDEN ET AL.: C FATE IN BLACK SPRUCE FOREST SOILS<br />
G01012<br />
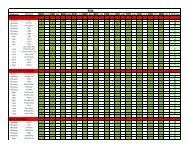
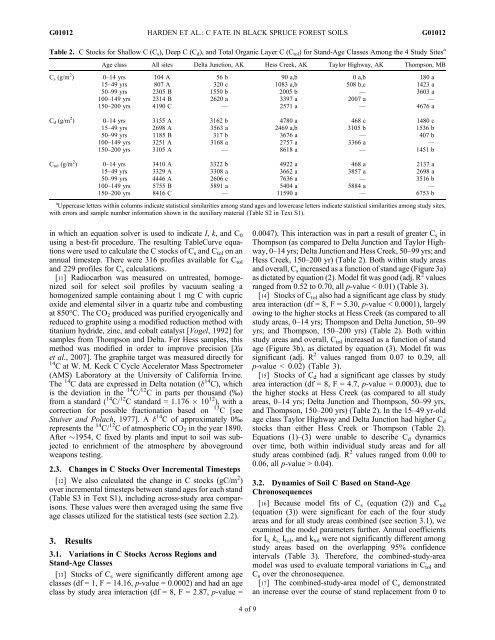
Table 2. C Stocks for Shallow C (C s ), Deep C (C d ), and Total Organic Layer C (C tol ) for Stand-Age Classes Among the 4 Study Sites a<br />
Age class All sites Delta Junction, AK Hess Creek, AK Taylor Highway, AK Thompson, MB<br />
C s (g/m 2 ) 0–14 yrs 104 A 56 b 90 a,b 0 a,b 180 a<br />
15–49 yrs 807 A 320 c 1083 a,b 508 b,c 1423 a<br />
50–99 yrs 2305 B 1550 b 2005 b — 3603 a<br />
100–149 yrs 2314 B 2620 a 3397 a 2007 a —<br />
150–200 yrs 4190 C — 2571 a — 4676 a<br />
C d (g/m 2 ) 0–14 yrs 3155 A 3162 b 4780 a 468 c 1480 c<br />
15–49 yrs 2698 A 3563 a 2469 a,b 3105 b 1536 b<br />
50–99 yrs 1185 B 317 b 3676 a — 407 b<br />
100–149 yrs 3251 A 3168 a 2757 a 3366 a —<br />
150–200 yrs 3105 A — 8618 a — 1451 b<br />
C tol (g/m 2 ) 0–14 yrs 3410 A 3322 b 4922 a 468 a 2137 a<br />
15–49 yrs 3329 A 3308 a 3662 a 3857 a 2698 a<br />
50–99 yrs 4446 A 2606 c 7636 a — 3516 b<br />
100–149 yrs 5755 B 5891 a 5404 a 5884 a —<br />
150–200 yrs 8416 C — 11590 a — 6753 b<br />
a Uppercase letters within columns indicate statistical similarities among stand ages and lowercase letters indicate statistical similarities among study sites,<br />
with errors and sample number information shown in the auxiliary material (Table S2 in Text S1).<br />
in which an equation solver is used to indicate I, k, and C 0<br />
using a best-fit procedure. The resulting TableCurve equations<br />
were used to calculate the C stocks of C s and C tol on an<br />
annual timestep. There were 316 profiles available for C tol<br />
and 229 profiles for C s calculations.<br />
[11] Radiocarbon was measured on untreated, homogenized<br />
soil for select soil profiles by vacuum sealing a<br />
homogenized sample containing about 1 mg C with cupric<br />
oxide and elemental silver in a quartz tube and combusting<br />
at 850°C. The CO 2 produced was purified cryogenically and<br />
reduced to graphite using a modified reduction method with<br />
titanium hydride, zinc, and cobalt catalyst [Vogel, 1992] for<br />
samples from Thompson and Delta. For Hess samples, this<br />
method was modified in order to improve precision [Xu<br />
et al., 2007]. The graphite target was measured directly for<br />
14 C at W. M. Keck C Cycle Accelerator Mass Spectrometer<br />
(AMS) Laboratory at the University of California Irvine.<br />
The 14 C data are expressed in Delta notation (d 14 C), which<br />
is the deviation in the 14 C/ 12 C in parts per thousand (‰)<br />
from a standard ( 14 C/ 12 C standard = 1.176 10 12 ), with a<br />
correction for possible fractionation based on 13 C [see<br />
Stuiver and Polach, 1977]. A d 14 C of approximately 0‰<br />
represents the 14 C/ 12 C of atmospheric CO 2 in the year 1890.<br />
After 1954, C fixed by plants and input to soil was subjected<br />
to enrichment of the atmosphere by aboveground<br />
weapons testing.<br />
2.3. Changes in C Stocks Over Incremental Timesteps<br />
[12] We also calculated the change in C stocks (gC/m 2 )<br />
over incremental timesteps between stand ages for each stand<br />
(Table S3 in Text S1), including across-study area comparisons.<br />
These values were then averaged using the same five<br />
age classes utilized for the statistical tests (see section 2.2).<br />
3. Results<br />
3.1. Variations in C Stocks Across Regions and<br />
Stand-Age Classes<br />
[13] Stocks of C s were significantly different among age<br />
classes (df = 1, F = 14.16, p-value = 0.0002) and had an age<br />
class by study area interaction (df = 8, F = 2.87, p-value =<br />
0.0047). This interaction was in part a result of greater C s in<br />
Thompson (as compared to Delta Junction and Taylor Highway,<br />
0–14 yrs; Delta Junction and Hess Creek, 50–99 yrs; and<br />
Hess Creek, 150–200 yr) (Table 2). Both within study areas<br />
and overall, C s increased as a function of stand age (Figure 3a)<br />
as dictated by equation (2). Model fit was good (adj. R 2 values<br />
ranged from 0.52 to 0.70, all p-value < 0.01) (Table 3).<br />
[14] Stocks of C tol also had a significant age class by study<br />
area interaction (df = 8, F = 5.30, p-value < 0.0001), largely<br />
owing to the higher stocks at Hess Creek (as compared to all<br />
study areas, 0–14 yrs; Thompson and Delta Junction, 50–99<br />
yrs; and Thompson, 150–200 yrs) (Table 2). Both within<br />
study areas and overall, C tol increased as a function of stand<br />
age (Figure 3b), as dictated by equation (3). Model fit was<br />
significant (adj. R 2 values ranged from 0.07 to 0.29, all<br />
p-value < 0.02) (Table 3).<br />
[15] Stocks of C d had a significant age classes by study<br />
area interaction (df = 8, F = 4.7, p-value = 0.0003), due to<br />
the higher stocks at Hess Creek (as compared to all study<br />
areas, 0–14 yrs; Delta Junction and Thompson, 50–99 yrs,<br />
and Thompson, 150–200 yrs) (Table 2). In the 15–49 yr-old<br />
age class Taylor Highway and Delta Junction had higher C d<br />
stocks than either Hess Creek or Thompson (Table 2).<br />
Equations (1)–(3) were unable to describe C d dynamics<br />
over time, both within individual study areas and for all<br />
study areas combined (adj. R 2 values ranged from 0.00 to<br />
0.06, all p-value > 0.04).<br />
3.2. Dynamics of Soil C Based on Stand-Age<br />
Chronosequences<br />
[16] Because model fits of C s (equation (2)) and C tol<br />
(equation (3)) were significant for each of the four study<br />
areas and for all study areas combined (see section 3.1), we<br />
examined the model parameters further. Annual coefficients<br />
for I s, k s, I tol , and k tol were not significantly different among<br />
study areas based on the overlapping 95% confidence<br />
intervals (Table 3). Therefore, the combined-study-area<br />
model was used to evaluate temporal variations in C tol and<br />
C s over the chronosequence.<br />
[17] The combined-study-area model of C s demonstrated<br />
an increase over the course of stand replacement from 0 to<br />
4of9