Chapter 15 – Chemical Equilibrium
Chapter 15 – Chemical Equilibrium
Chapter 15 – Chemical Equilibrium

You also want an ePaper? Increase the reach of your titles
YUMPU automatically turns print PDFs into web optimized ePapers that Google loves.
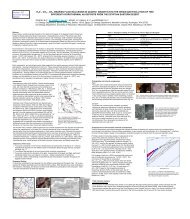
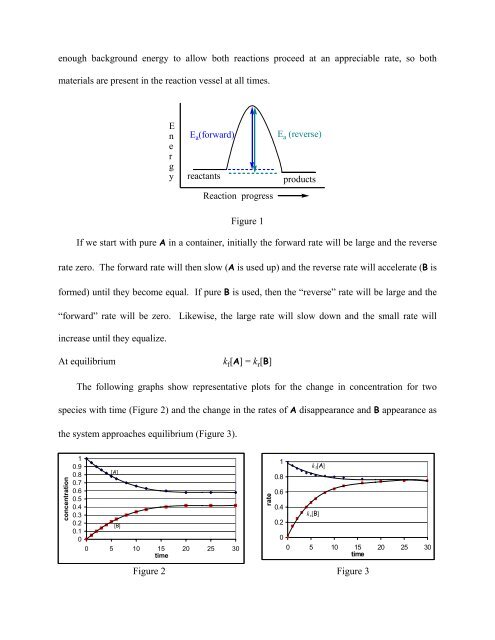
enough background energy to allow both reactions proceed at an appreciable rate, so both<br />
materials are present in the reaction vessel at all times.<br />
E<br />
n<br />
e<br />
r<br />
g<br />
y<br />
E a (forward)<br />
reactants<br />
Reaction progress<br />
Figure 1<br />
E a (reverse)<br />
products<br />
If we start with pure A in a container, initially the forward rate will be large and the reverse<br />
rate zero. The forward rate will then slow (A is used up) and the reverse rate will accelerate (B is<br />
formed) until they become equal. If pure B is used, then the “reverse” rate will be large and the<br />
“forward” rate will be zero. Likewise, the large rate will slow down and the small rate will<br />
increase until they equalize.<br />
At equilibrium<br />
k f [A] = k r [B]<br />
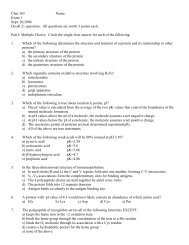
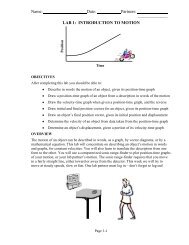
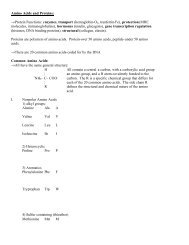
The following graphs show representative plots for the change in concentration for two<br />
species with time (Figure 2) and the change in the rates of A disappearance and B appearance as<br />
the system approaches equilibrium (Figure 3).<br />
concentration<br />
1<br />
0.9<br />
0.8<br />
0.7<br />
0.6<br />
0.5<br />
0.4<br />
0.3<br />
0.2<br />
0.1<br />
0<br />
[A]<br />
[B]<br />
0 5 10 <strong>15</strong> 20 25 30<br />
time<br />
rate<br />
1<br />
0.8<br />
0.6<br />
0.4<br />
0.2<br />
0<br />
k f [A]<br />
k r [B]<br />
0 5 10 <strong>15</strong> 20 25 30<br />
time<br />
Figure 2 Figure 3