
Create successful ePaper yourself
Turn your PDF publications into a flip-book with our unique Google optimized e-Paper software.
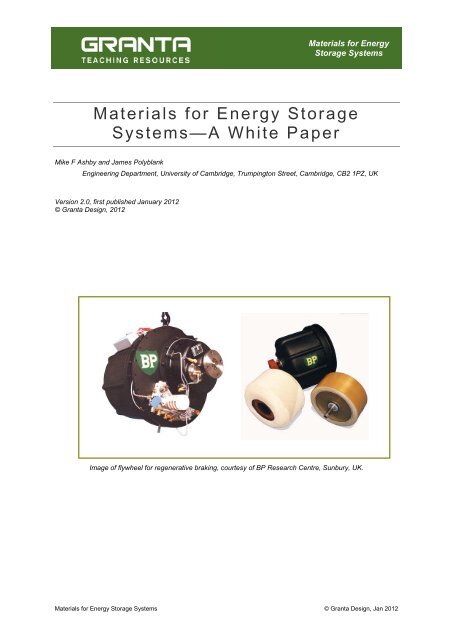
Materials for Energy<br />
Storage Systems<br />
Materials for Energy Storage<br />
Systems—A White Paper<br />
Mike F Ashby and James Polyblank<br />
Engineering Department, University of Cambridge, Trumpington Street, Cambridge, CB2 1PZ, UK<br />
<strong>Version</strong> 2.0, first published January 2012<br />
© <strong>Granta</strong> <strong>Design</strong>, 2012<br />
Image of flywheel for regenerative braking, courtesy of BP Research Centre, Sunbury, UK.<br />
Materials for Energy Storage Systems © <strong>Granta</strong> <strong>Design</strong>, Jan 2012
Table of Contents<br />
1. Introduction—the need for energy storage systems ................................................................1<br />
2. Overview—selecting energy storage systems .........................................................................2<br />
3. Pumped hydro storage ...........................................................................................................11<br />
4. Compressed air energy storage (CAES) ...............................................................................12<br />
5. Springs ...................................................................................................................................14<br />
6. Flywheels ...............................................................................................................................16<br />
7. Thermal Storage ....................................................................................................................17<br />
8. Batteries .................................................................................................................................18<br />
9. Hydrogen Energy Storage .....................................................................................................23<br />
10. Capacitors and super-capacitors .........................................................................................24<br />
11. Superconducting Magnetic Energy Storage (SMES)...........................................................26<br />
Appendix 1 Definition of terms ...................................................................................................27<br />
Appendix 2: Approximate Material Intensities for Energy Storage Systems ..............................29<br />
Further Reading .........................................................................................................................34<br />
Materials for Energy Storage Systems © <strong>Granta</strong> <strong>Design</strong>, Jan 2012
1. Introduction—the need for<br />
energy storage systems<br />
Energy storage systems are the source of<br />
power for products as diverse as hearing<br />
aids and satellites. Two sectors have a<br />
particular interest in large-scale energy<br />
storage systems: the utilities industry and<br />
the automotive industry. The portable<br />
electronics industry and the military also<br />
require energy storage systems, but on a<br />
smaller scale.<br />
The utility industry is faced with the<br />
problem that energy demand is not<br />
constant but fluctuates through the day.<br />
With the increasing dependence on<br />
renewable energy sources (wind, wave,<br />
solar), energy supply, too, fluctuates.<br />
Energy storage systems ensure that,<br />
when supply is high and demand is low,<br />
energy is not wasted, and that when<br />
supply is low and demand is high, the<br />
demand can still be met. An electricity grid<br />
allows electricity to be generated at one<br />
location and used at another. Energy<br />
storage systems allow electricity to be<br />
generated at one time and used at<br />
another. The automotive industry has<br />
rather different needs. Legislation to<br />
reduce emissions is driving the<br />
development of a new generation of low<br />
carbon vehicles. Gasoline is an<br />
exceptionally effective form of portable<br />
energy. Replacing it requires a storage<br />
system that can provide acceptable range<br />
and allow acceptably fast refueling or<br />
recharging.<br />
This report surveys prominent energy<br />
storage systems (Table 1). Section 2<br />
provides an overview of the findings and<br />
describes how energy storage systems<br />
can be selected. Subsequent sections<br />
provide a deeper analysis of each system,<br />
with a particular emphasis on their<br />
ultimate limits and the demands they place<br />
on material supply.<br />
Table 1. Classes and members of energy storage systems.<br />
Class<br />
Hydrocarbons (for comparison)<br />
Mechanical storage<br />
Thermal storage<br />
Chemical storage<br />
Electro-magnetic storage<br />
Systems<br />
Conventional fuels<br />
Pumped hydro<br />
Compressed air energy storage<br />
Springs<br />
Flywheels<br />
Thermal storage<br />
Li-ion batteries<br />
Sodium-sulfur batteries<br />
Lead-acid batteries<br />
Nickel cadmium batteries<br />
Nickel-metal hydride batteries<br />
Vanadium flow batteries<br />
Hydrogen fuel cells<br />
Super capacitors<br />
Superconducting magnetic energy storage<br />
Materials for Energy Storage Systems 1 © <strong>Granta</strong> <strong>Design</strong>, Jan 2012
As we found with systems for low carbon<br />
power generation (see Materials for Low-<br />
Carbon Power—A White Paper), the<br />
performance of energy storage systems<br />
depends on the type and scale of the<br />
system, its location, and the way it is<br />
managed. Technical developments<br />
continue to improve the performance of<br />
existing systems and add new ones. The<br />
figures and tables of this paper show<br />
representative ranges, but there is no<br />
guarantee that these ranges enclose all<br />
members of a given system.<br />
2. Overview—selecting energy<br />
storage systems<br />
Even within the utility industry and the<br />
automotive industry, there are different<br />
applications of energy storage devices.<br />
The utility industry needs short bursts of<br />
energy at high power for frequency<br />
regulation (that is, maintaining a constant<br />
mains frequency), while they need more<br />
sustained power for energy management<br />
(ensuring that demand is met, and supply<br />
is not wasted). Similarly, the automotive<br />
industry needs short bursts of energy for<br />
acceleration and more sustained power for<br />
long distance cruising.<br />
Six performance metrics for energy<br />
storage systems appear in Table 2.<br />
Specific energy and energy density are<br />
the energy storage capacity per unit mass<br />
and unit volume respectively. The<br />
operating cost is the approximate cost of<br />
one charge/discharge cycle of one unit of<br />
energy, and includes the cost of<br />
maintenance, heating, labor, etc. Specific<br />
power is the discharge power capacity per<br />
unit mass. The efficiency is defined as the<br />
ratio of total energy outputted by the<br />
system over total energy put into the<br />
system in one charge/discharge cycle.<br />
The cycle life is defined as the number of<br />
charge/discharge cycles possible until the<br />
capacity of the storage system drops to<br />
80% of its initial capacity.<br />
Figure 1 identifies the storage systems<br />
which are best for short power bursts and<br />
those able to provide more sustained<br />
power. The axes are Specific power<br />
(power per unit mass) and Specific energy<br />
(energy storage capacity per unit mass),<br />
with contours of constant discharge time.<br />
Superconducting magnetic energy storage<br />
(SMES), electric double layer capacitors<br />
Figure 1. A plot of power density against energy density of energy storage systems,<br />
with lines of charge/discharge time.<br />
Materials for Energy Storage Systems 2 © <strong>Granta</strong> <strong>Design</strong>, Jan 2012
(EDLC, also known as super-capacitors or<br />
ultra-capacitors), and flywheels can<br />
provide short bursts of power, while<br />
pumped hydro storage and thermal<br />
storage are better suited for longer<br />
duration power supply.<br />
Table 2. Performance metrics of energy storage systems 1 .<br />
Once a selection of storage systems with<br />
suitable discharge times have been<br />
identified for a given application, it then<br />
remains to select the energy storage<br />
system which has the best performance,<br />
and the lowest resource intensities.<br />
Storage System<br />
Specific<br />
Energy<br />
Energy<br />
Density<br />
Operating<br />
Cost<br />
Specific<br />
Power<br />
Efficiency<br />
Cycle Life<br />
(MJ/kg) (MJ/m 3 ) ($/MJ) (W/kg) (%) (#-cycles)<br />
Conventional fuels 20-50 15,000-<br />
72,000<br />
- - 18-50 1<br />
Pumped hydro 0.002-0.005 2-5 0.0006-<br />
0.0014<br />
0.02-0.3 70-80 400,000<br />
Compressed air energy<br />
storage<br />
0.36 25 0.0001-<br />
0.0019<br />
8 65-70 15,000<br />
Springs 0.00014-<br />
0.00033<br />
0.6-1.1 - - 98-99.9 Depends<br />
on loading 2<br />
Flywheels 0.002-0.025 2.1 0.0008-<br />
0.0017<br />
100-<br />
10,000<br />
75-85 150,000<br />
Thermal storage 0.032-0.036 160 0.0008-<br />
0.0019<br />
Li-ion batteries 0.32-0.68 720-1,400 0.0019-<br />
0.0047<br />
1.5-1.7 72-85 10,000-<br />
15,000<br />
250-340 80-90 300-2,000<br />
Sodium-sulfur batteries 0.2-0.7 140-540 0.0039 10-15 75-83 3600-4700<br />
Lead-acid batteries 0.07-0.18 200-430 0.0008-<br />
0.0028<br />
4-180 70-90 200-1500<br />
Nickel cadmium<br />
batteries<br />
Nickel-metal hydride<br />
batteries<br />
0.08-0.23 72-310 0.0008-<br />
0.0055<br />
0.1-0.43 190-1300 0.0006-<br />
0.0028<br />
30-150 60-85 800-1200<br />
4-140 65-85 300-1000<br />
Vanadium flow batteries 0.07-0.13 110-170 0.0039 2.2-3.1 71-88 10000-<br />
16000<br />
Hydrogen fuel cells 0.02-0.8 1-70 0.0006-<br />
0.0041<br />
5-20 27-35 5,000-<br />
10,000<br />
Super capacitors 0.010-0.020 10-25 0.0008-<br />
0.0019<br />
1,000-<br />
20,000<br />
90-95 1,000,000<br />
Superconducting<br />
magnetic energy<br />
storage<br />
0.001-0.02 2-10 0.0003-<br />
0.0083<br />
500-<br />
20,000<br />
85-92 50,000-<br />
200,000<br />
1 Some of the data in this table are easy to find, but others are not. Some have to be estimated from diagrams or<br />
schematics of the system, some deduced by analogy with similar systems, and some inferred from the physics<br />
on which the system depends. The values vary greatly with design, location and scale of the system, allowing<br />
wide variation. That means precision is low, but the difference between the values of competing systems is<br />
sufficiently great that it is still possible to draw meaningful conclusions.<br />
2 The cycle life of a spring depends on loading—for low alloy steels, for example, an increase in loading of 50%<br />
can reduce the lifetime by six orders of magnitude.<br />
Materials for Energy Storage Systems 3 © <strong>Granta</strong> <strong>Design</strong>, Jan 2012
Figure 2. Specific energy and energy density of energy storage methods, including a number of fuels for<br />
comparison. The densities of most solids sit within an order of magnitude of that of water (1,000kg/m 3 ), so it is<br />
no surprise that physical density of all the storage systems (apart from gases) sit within this range.<br />
The importance of each performance<br />
metric depends on the application. The<br />
automotive industry requires energy<br />
storage systems that are small and light,<br />
so are interested in high Specific energy<br />
and Energy density. These two metrics<br />
are the axes of Figure 2. Compared to<br />
fuels, with specific energies from 20 MJ/kg<br />
(for methanol) to 50 MJ/kg (for LPG) and<br />
energy densities from 16,000 MJ/m 3 (for<br />
methanol) and 72,000 MJ/m 3 (for coal), all<br />
of the “low carbon” energy storage<br />
systems perform poorly. Their specific<br />
energies and energy densities are at least<br />
one order of magnitude smaller than those<br />
of hydrocarbon fuels. Even explosives<br />
(which must include both reactants,<br />
whereas the masses of fuels do not<br />
include the oxygen the fuel reacts with)<br />
store much more energy than any other<br />
storage system per unit mass or volume.<br />
Many of these systems are not yet fully<br />
mature; future research and development<br />
will certainly improve their performance.<br />
But there are upper limits, physical and<br />
practical, beyond which performance<br />
cannot be pushed. A plot of these upper<br />
limits for specific energy and energy<br />
density (Figure 3) shows how they might<br />
compete with fuels in the future. The<br />
assumptions used to estimate these<br />
values are discussed in later sections.<br />
They are extremely optimistic. The ratio of<br />
the current specific energy to the<br />
estimated upper limit of each system<br />
(Figure 4) is around 1% for all except<br />
CAES and SMES, suggesting that there is<br />
some consistency in the level of optimism<br />
that has been applied. With the most<br />
optimistic assumptions, the only energy<br />
storage systems that approach the energy<br />
densities of fuels are hypothetical<br />
flywheels made from carbon nano-tubes<br />
(CNTs), hypothetical lithium-fluorine<br />
batteries, and superconducting magnetic<br />
energy storage (SMES). Even<br />
approaching these limits is improbable<br />
because of practicalities discussed in the<br />
subsequent sections of the report. It is<br />
very hard to compete successfully with<br />
hydrocarbon fuels.<br />
Materials for Energy Storage Systems 4 © <strong>Granta</strong> <strong>Design</strong>, Jan 2012
Figure 3. A plot of energy mass density vs. energy volume density optimistically<br />
achievable by various technologies.<br />
Figure 4. The ratio of the current specific energy to the limiting specific energy of<br />
energy storage systems.<br />
Materials for Energy Storage Systems 5 © <strong>Granta</strong> <strong>Design</strong>, Jan 2012
Figure 5 and Figure 6 show bar-charts of<br />
cycle efficiency and cycle life. Poor<br />
efficiency means large losses, making<br />
storage expensive. Poor cycle life makes<br />
investment in the system less attractive<br />
because of the cost and inconvenience of<br />
replacement.<br />
Figure 5. Cycle efficiency of energy storage systems.<br />
Fossil fuel engines/power plants are included for comparison.<br />
Figure 6. Cycle life of energy storage systems.<br />
Materials for Energy Storage Systems 6 © <strong>Granta</strong> <strong>Design</strong>, Jan 2012
Constructing an energy storage system<br />
requires resources. Five resource<br />
intensities of construction appear in<br />
Table 3. All are quoted per unit of energystorage<br />
capacity. Capital intensity is the<br />
cost of construction per MJ of storage<br />
capacity. Area intensity is the typical area<br />
used to site the storage system, per MJ of<br />
storage capacity. Material intensity is the<br />
mass of raw materials required to<br />
construct the storage system, per MJ.<br />
Energy intensity is the primary energy<br />
required to construct the storage system,<br />
and CO 2 intensity is the CO 2 emitted in<br />
constructing the storage system, per MJ of<br />
storage capacity.<br />
.<br />
Table 3. Resource intensities of construction of energy storage devices 3<br />
Storage System<br />
Capital<br />
Intensity<br />
Area Intensity<br />
Material<br />
Intensity<br />
Energy<br />
Intensity<br />
CO 2 Intensity<br />
($/MJ) (m 2 /MJ) (kg/MJ) (MJ embodied /MJ) (kg-CO 2 /MJ)<br />
Conventional<br />
Fuels<br />
0.045-0.065 4 - - 0.1-0.2 4 0.2-0.4 4<br />
Pumped Hydro 45-120 0.02-0.08 60-120 100-200 8-16<br />
Compressed Air<br />
Energy Storage<br />
4-20 0.008 2-12 74 5.3<br />
Springs 500-1,600 - 3,000-7,100 340,000-<br />
550,000<br />
24,000-42,000<br />
Flywheels 400-7,000 0.08-0.2 17-500 750-760 90-100<br />
Thermal Storage 14-26 0.003 0.4-50 120-130 8.9-9.0<br />
Li-ion Batteries 140-440 0.002-0.008 1.5-2.7 330-580 19-50<br />
Sodium-Sulphur<br />
Batteries<br />
Lead-Acid<br />
Batteries<br />
Nickel Cadmium<br />
Batteries<br />
Nickel-Metal<br />
Hydride Batteries<br />
Vanadium Flow<br />
Batteries<br />
Hydrogen Fuel<br />
Cells<br />
28-280 0.005-0.008 1.4-5 360-640 30-50<br />
50-220 0.009-0.03 4.5-12 110-980 5-130<br />
200-330 0.006-0.03 3.5-10 390-640 28-47<br />
130-440 0.003-0.03 2-7 550-940 28-67<br />
100-300 0.01 3.8-7 170-180 25-26<br />
55-2,300 0.001-0.015 1.3-50 140-150 9.7-9.8<br />
Super-capacitors 14,700-41,000 0.11-0.13 45-65 3,700-6,500 210-360<br />
Superconducting<br />
Magnetic Storage<br />
30,000-260,000 0.25-7.1 50-1,000 1,600-1,700 240-250<br />
3 Some of the data in this table are easy to find, but others are not. Some have to be estimated from diagrams or<br />
schematics of the system, some deduced by analogy with similar systems, and some inferred from the physics<br />
on which the system depends. The values vary greatly with design, location, and scale of the system, allowing<br />
wide variation. That means precision is low, but the difference between the values of competing systems is<br />
sufficiently great that it is still possible to draw meaningful conclusions.<br />
4 Note that conventional fuels can only be used once, so these figures cannot be compared directly with the other<br />
systems, but are included for completeness.<br />
Materials for Energy Storage Systems 7 © <strong>Granta</strong> <strong>Design</strong>, Jan 2012
Figure 7. The capital and energy intensities of construction of energy storage systems,<br />
both per cycle over the lifetime of the system.<br />
The capital and energy required to install a<br />
given energy-storage capacity depends on<br />
capital and energy intensities of the<br />
storage system. Figure 7 illustrates this. It<br />
has axes of<br />
Construction energy per MJ of<br />
Cycle life<br />
and<br />
Construction capital per MJ of<br />
Cycle life<br />
storage capactiy<br />
storage capactiy<br />
Compressed air energy storage has the<br />
lowest capital intensity per MJ-cycle.<br />
Super-capacitors are the least energy<br />
intensive storage system, largely because<br />
of their high cycle life. The energy and<br />
capital intensities of batteries are inflated<br />
by their lower cycle life, making some of<br />
them more expensive and more energy<br />
intensive per cycle than gasoline.<br />
Investment decisions for energy storage<br />
are influenced by the total cost per unit<br />
storage capacity per cycle. This is:<br />
Average cost ($ / MJ − cycle )<br />
= Construction cost ($ / MJ )<br />
+ Operating cost ($/<br />
MJ − cycle )<br />
Cycle life<br />
Figure 8 plots this for each system.<br />
It reveals that CAES is still the cheapest.<br />
Large scale implementations of energy<br />
storage systems for grid stability makes<br />
considerable demands on material supply<br />
and land area, making Material intensity<br />
and Area intensity metrics of particular<br />
importance to the utility industry. They are<br />
plotted in Figure 9. Thermal storage,<br />
lithium-ion batteries, and hydrogen<br />
storage use the least area and materials.<br />
Materials for Energy Storage Systems 8 © <strong>Granta</strong> <strong>Design</strong>, Jan 2012
Figure 8. Total costs of energy storage systems per unit storage capacity per cycle.<br />
Figure 9. The area and material intensities of energy storage systems.<br />
Using an overall material intensity is, of<br />
course, an oversimplification. What is<br />
important is which materials are used, and<br />
whether they are “critical”. The bills of<br />
materials for the energy storage systems<br />
studied here are listed in Appendix 2.<br />
These allow a comparison between the<br />
demands of each system and the current<br />
world production of critical materials,<br />
highlighting where supply might be a<br />
problem.<br />
Materials for Energy Storage Systems 9 © <strong>Granta</strong> <strong>Design</strong>, Jan 2012
What is a critical material There are four<br />
reasons for a material to be categorized in<br />
this way:<br />
• Production is primarily from<br />
sources considered unreliable for<br />
geo-political reasons;<br />
• Lack of substitutes for the material<br />
in its main application;<br />
• Supply is limited due to the<br />
economics of its production; or<br />
• Extreme price volatility.<br />
The annual productions of 27 materials<br />
that meet one or more of these criteria are<br />
shown in Figure 10, color-coded to show<br />
the reasons for concern.<br />
In subsequent sections we examine each<br />
energy storage system in turn, paying<br />
particular attention to critical materials. To<br />
do this we consider a hypothetical<br />
scenario, one that is compatible with that<br />
used in Materials for Low-Carbon Power—<br />
A White Paper. To complement the<br />
2,000 GW of power generation capacity<br />
hypothetically being replaced over a 10<br />
year period, 10 hours of storage capacity<br />
will be installed. This will require a storage<br />
capacity of 20,000 GWh, or 72 PJ<br />
(petajoule = 10 15 J). From this we calculate<br />
the fraction of current world production of<br />
each critical material that would be<br />
required to build the installations,<br />
revealing where material supply might be<br />
a problem.<br />
Figure 10. Current (2010) annual world production of 27 critical materials, highlighting the<br />
reasons for their being identified as critical.<br />
Materials for Energy Storage Systems 10 © <strong>Granta</strong> <strong>Design</strong>, Jan 2012
3. Pumped hydro storage<br />
Energy is stored if water is pumped from a<br />
lower reservoir to an upper reservoir that<br />
is 100-1,000 m higher (Figure 11). Energy<br />
is recovered by allowing the water to<br />
return to the lower reservoir through a<br />
generator like that of a hydro-power plant.<br />
The gravitational potential energy stored in<br />
a mass m of water by pumping it to a<br />
height h is:<br />
W = m g h<br />
(1)<br />
where g is the acceleration due to gravity<br />
(10 m/s 2 ). Assuming that the mass and<br />
volume of the dam and ancillary<br />
equipment are negligible compared to<br />
those of the water and that energy is<br />
recovered with 100% efficiency, the<br />
specific energy and the energy density are<br />
W W m<br />
= g h and = g h = ρ g h (2)<br />
m<br />
V V<br />
where V is the volume of water and ρ is<br />
the density of water (1,000 kg/m 3 ). The<br />
quantities ρ and g are approximately<br />
constant on earth, so the specific energy<br />
and energy density of a pumped hydro<br />
system depend only on h —the height of<br />
the upper reservoir above the lower one.<br />
To put an absolute upper limit on this, we<br />
postulate a pumped hydro system with the<br />
upper reservoir at the highest point on<br />
earth (Everest at 8,850m), and the lower<br />
reservoir at sea level, giving the<br />
(unattainable) limits<br />
and<br />
*<br />
⎛W<br />
⎞<br />
⎜ ⎟<br />
⎝ m ⎠<br />
*<br />
⎛ W ⎞<br />
⎜ ⎟<br />
⎝ V ⎠<br />
= 10 x 8850 J / kg<br />
= 1000 x 10 x 8850 = 88 , 500<br />
= 0.09 MJ / kg<br />
, 000<br />
3<br />
= 90 MJ / m<br />
J / m<br />
3<br />
Figure 11. Diagram of a pumped hydro storage system.<br />
Materials for Energy Storage Systems 11 © <strong>Granta</strong> <strong>Design</strong>, Jan 2012
Even this fantasy scenario gives values of<br />
specific energy and energy density that<br />
are almost three orders of magnitude<br />
smaller than those of oil. Real systems<br />
have values that are between 10 and 100<br />
times smaller still.<br />
The simplicity of pumped hydro systems<br />
makes them the preferred method of<br />
utility-scale energy storage, accounting for<br />
99% of world-wide capacity. An<br />
approximate bill of materials for such a<br />
system appears in Appendix 2. It suggests<br />
that the material demands for large scale<br />
deployment (following the scenario<br />
described in Section 2) would be<br />
manageable, requiring only 0.2% of the<br />
world production of chromium and<br />
manganese, the only critical materials<br />
required. The greatest obstacle to<br />
expansion is simply that of finding useable<br />
locations.<br />
4. Compressed air energy<br />
storage (CAES)<br />
CAES systems store energy by<br />
compressing air. Energy is recovered by<br />
expanding the air through a pneumatic<br />
motor or turbine connected to a generator.<br />
The compressed air can be stored in small<br />
tanks for mobile (e.g., automotive)<br />
applications, or in underground caverns or<br />
large balloons under the sea (which keeps<br />
it at high pressure) for utility scale<br />
applications.<br />
When air is compressed its temperature<br />
rises. If this heat leaks away, energy is<br />
lost. When the air is expanded again, it<br />
cools and can freeze the turbine. There<br />
are two ways of dealing with this. One is to<br />
insulate the compressed air chamber so<br />
that the heat does not escape, allowing<br />
adiabatic compression. The other is to<br />
pump slowly and allow the heat to escape<br />
or to be stored separately so that the<br />
temperature of the compressed air<br />
chamber remains constant, giving<br />
isothermal compression. Isothermal<br />
Figure 12. Diagram of a hybrid CAES system.<br />
Materials for Energy Storage Systems 12 © <strong>Granta</strong> <strong>Design</strong>, Jan 2012
compression must be followed by slow,<br />
isothermal expansion, allowing the heat to<br />
return to the air. In theory, either method<br />
could be 100% efficient, but in practice an<br />
efficiency of about 70% is the best<br />
achievable.<br />
Today’s CAES systems combine<br />
compressed air with natural gas. The gas<br />
burns to heat the air before the mixture<br />
enters the turbine (Figure 12). In a<br />
conventional gas power plant, substantial<br />
energy is used to compress air. The<br />
stored compressed air removes the need<br />
for this, increasing the efficiency. Taking<br />
out the contribution of the gas, CAES<br />
systems have an efficiency of 70% for<br />
round-trip compressed air storage.<br />
Large scale deployment of CAES systems<br />
would be manageable, requiring only<br />
using 0.001% of the annual production of<br />
chromium, and 0.3% of manganese<br />
(Appendix 2). Mobile applications require<br />
a pressure vessel, but this is unlikely to<br />
put pressure on supply of critical<br />
materials.<br />
The specific energy of today’s CAES<br />
systems is about 0.36 MJ/kg, and the<br />
energy density is about 25 MJ/m 3 , barely<br />
1% of the values for hydrocarbon fuels.<br />
Could they be improved The energy<br />
stored by isentropically compressing<br />
n moles of air at temperature T from<br />
pressure p A to p B into a pressure vessel of<br />
volume V is:<br />
WA−B<br />
⎛ p ⎞<br />
⎜ B<br />
= nR T ln<br />
⎟ =<br />
⎝ p A ⎠<br />
⎛ p ⎞<br />
⎜ B<br />
pB<br />
V ln<br />
⎟<br />
⎝ p A ⎠<br />
(3)<br />
The mass of a thin walled spherical vessel<br />
of radius, r, thickness, t, and made out of<br />
material of density, ρ, is:<br />
m = 4π<br />
r<br />
2<br />
t ρ<br />
(4)<br />
The wall thickness required to ensure that<br />
the wall does not yield under a pressure<br />
difference ∆p is:<br />
where<br />
1 ∆p r<br />
t ≥ 2 σ<br />
σ y<br />
(5)<br />
is the yield strength of the wall<br />
material. Substituting this into equation (5)<br />
gives:<br />
m =<br />
(6)<br />
The volume of the pressure vessel is<br />
4 3<br />
V = π r , allowing this equation to be reexpressed<br />
3<br />
as:<br />
m =<br />
(7)<br />
To minimize the mass, we need to<br />
maximize σ y / ρ . The structural material<br />
with the largest value of this index is<br />
CRFP with / ρ = 1.6 MJ/kg. Noting that,<br />
at high pressures<br />
the vessel is:<br />
y<br />
3<br />
2π<br />
r ρ ∆p<br />
σ<br />
y<br />
3 V ∆p<br />
2<br />
σ y<br />
ρ<br />
σ<br />
y<br />
∆p ≈<br />
mvessel = 0. 94 V p B<br />
pB<br />
the mass of<br />
(8)<br />
where pressures are in units of MPa and<br />
volume in m 3 . The mass of the air itself<br />
(at 300K):<br />
pB<br />
mair = ρ air V = 12 pBV<br />
(9)<br />
p A<br />
where ρ air is the density of air at<br />
atmospheric pressure (1.2 kg/m 3 at<br />
0.1 MPa). The specific energy is thus:<br />
m<br />
vessel<br />
W<br />
+ m<br />
air<br />
=<br />
p<br />
0 . 94 p<br />
p B<br />
V ln( )<br />
p A<br />
V + 12 p V<br />
p B<br />
= 0 . 08 ln( ) MJ/kg<br />
p A<br />
(10)<br />
It only remains to select the compression<br />
pressure. The most powerful compressors<br />
available today typically compress from<br />
atmospheric pressure (0.1 MPa) to<br />
100 MPa. (These compressors are used<br />
for hot isostatic pressing for powder<br />
B<br />
B<br />
B<br />
Materials for Energy Storage Systems 13 © <strong>Granta</strong> <strong>Design</strong>, Jan 2012
processing of materials.) This gives a<br />
specific energy of 0.55 MJ/kg, and an<br />
energy density of 580 MJ/m 3 . Even<br />
without the pressure vessel (e.g., in a<br />
solution mined salt cavern), the specific<br />
energy would be 0.59 MJ/kg. This is still<br />
two orders of magnitude smaller than<br />
conventional fuels.<br />
It should also be noted that, in calculating<br />
this upper limit, we have applied no safety<br />
factor (it should be at least 3), neglected<br />
the low efficiency of pneumatic pumps<br />
(20 – 30%), and assumed 100% energy<br />
recovery (in reality 80% at best). It is clear<br />
that compressed air storage can work for<br />
utility power but for mobile applications it<br />
cannot compete with fossil fuels.<br />
5. Springs<br />
Springs store energy by compressing or<br />
extending material elastically. There are<br />
no examples of springs being used for<br />
utility scale energy storage or to provide<br />
propulsion in automobiles. This is because<br />
they have very low specific energy. We<br />
highlight this here by considering the<br />
maximum energy we could store in a<br />
spring using today’s materials.<br />
The specific energy, energy density, and<br />
the capital intensity of energy storage in a<br />
material when stretched uniaxially to yield<br />
are:<br />
Energy density<br />
Specific energy<br />
Capital intensity<br />
W 1 σ y 2<br />
=<br />
V 2 E<br />
W<br />
m<br />
σ y<br />
2<br />
ρ E<br />
(11,a)<br />
(11,b)<br />
(11,c)<br />
where W is energy stored, V is the<br />
volume of material, m is the mass of<br />
material, C is the total cost of material,<br />
is the yield stress of the material, E is<br />
σ y<br />
the Young’s modulus, ρ is the density,<br />
and C m is the material cost per unit mass.<br />
Table 4 lists values for five different<br />
materials.<br />
C<br />
W<br />
=<br />
1<br />
2<br />
E ρ C<br />
= 2 m<br />
2<br />
σ y<br />
Figure 13. A titanium spring.<br />
Image courtesy of G and O Springs Ltd.<br />
Table 4. The performance of various materials for springs.<br />
Material MJ/m 3 MJ/kg USD/MJ Cycle<br />
Efficiency<br />
Polyurethane rubber (Unfilled) 30-400 0.03-0.4 20-200 40-70%<br />
PEBA (Shore D25) 21-38 0.021-0.038 220-400 70-94%<br />
Epoxy/S-glass fiber (0° ply) 30-33 0.015-0.017 1500-1700 98%<br />
Low alloy steel, AISI 9255,<br />
tempered 205°C<br />
8-12 0.001-0.0015 550-830 99.8-99.9%<br />
Carbon nano-tubes 8,400 5 30,000-160,000<br />
Materials for Energy Storage Systems 14 © <strong>Granta</strong> <strong>Design</strong>, Jan 2012
Polyurethane rubber is the best according<br />
to all three of these figures of merit.<br />
However cyclically compressing and<br />
expanding polyurethane rubber is<br />
extremely lossy, with a mechanical loss<br />
coefficient of tan(δ)=0.05-0.1, leading to a<br />
cycle efficiency of 40-70%. PEBA (Shore<br />
D25) has a better material efficiency of<br />
94%, but has a lower specific energy of<br />
0.021-0.038 MJ/kg compared to 0.03-<br />
0.4 MJ/kg for polyurethane rubber.<br />
Epoxy/S-glass fiber makes the lightest and<br />
smallest spring, while low alloy steel<br />
makes the cheapest. These have much<br />
higher cycle efficiencies (98% and 99.9%<br />
respectively), but the overall efficiency will<br />
be reduced by the mechanisms used to<br />
store and extract the energy. Thus the<br />
energy density of springs made from<br />
today’s materials is three orders of<br />
magnitude smaller than conventional<br />
fuels.<br />
Hill et al. (2009) claim that it would be<br />
possible to store 8,400 MJ/m 3 or 5 MJ/kg<br />
in carbon nano-tube springs. This might<br />
be true of a single nanotube, but scaling<br />
up to any useful size requires that the<br />
nanotubes are bonded in some kind of<br />
matrix, reducing the specific energy. A<br />
more realistic upper bound is to postulate<br />
that the spring material could be loaded to<br />
the theoretical strength, roughly E / 10 .<br />
Then using (as an example) the modulus<br />
and density of steel (200 GPa and<br />
7,900 kg/m 3 ) we find upper bounds from<br />
equations 11,a and 11,b as follows.<br />
Energy density:<br />
W<br />
V<br />
=<br />
2<br />
1 σ y<br />
2 E<br />
Specific energy:<br />
W<br />
m<br />
=<br />
2<br />
=<br />
1 σ y<br />
2 ρ E<br />
=<br />
1<br />
2<br />
E<br />
100<br />
E<br />
100<br />
3<br />
= 1000 MJ / m<br />
These are still far below the values for<br />
hydrocarbons.<br />
1<br />
2<br />
0.13 MJ / kg.<br />
ρ<br />
Figure 14. Diagram of a flywheel. The motor/generator is adapted to fit inside the flywheel to save space.<br />
The system is buried underground for safety.<br />
Materials for Energy Storage Systems 15 © <strong>Granta</strong> <strong>Design</strong>, Jan 2012
6. Flywheels<br />
A spinning flywheel stores kinetic energy<br />
(Figure 14), which is recovered by<br />
coupling the flywheel to a generator. An<br />
efficient flywheel is designed to have as<br />
large a rotational moment of inertia as<br />
possible and to spin fast. Frictional losses<br />
in the bearings and surrounding air reduce<br />
efficiency. They are reduced by using<br />
superconducting magnetic bearings to<br />
levitate the rotor and by cooling or<br />
pumping the air out of the containment. All<br />
of these require energy, so they too<br />
reduce efficiency slightly.<br />
Present-day flywheels have a specific<br />
energy in the range 0.002 – 0.025 MJ/kg<br />
and an energy density is between 1.7 and<br />
23 MJ/m 3 when ancillary devices are<br />
included, values that are much smaller<br />
than hydrocarbon fuels. What are the<br />
upper limits for both The following<br />
estimate gives an idea.<br />
The kinetic energy of a rotating cylinder is:<br />
1 W = I ω<br />
2<br />
(12)<br />
2<br />
where I is the rotational moment of<br />
inertia and ω the angular velocity. The<br />
moment of inertia is maximized for a given<br />
mass of material by making it into a thinwalled<br />
tube. If the tube has mass m ,<br />
radius R and wall thickness t<br />
(Figure 15, left), its moment of inertia per<br />
unit length is:<br />
2<br />
I = m R<br />
(13)<br />
Equating the centrifugal load in a small<br />
element of this ring to the resolved<br />
component of the circumferential stress in<br />
the wall when this stress is just below the<br />
its yield strength gives the maximum<br />
allowable angular velocity, ω :<br />
2<br />
from which<br />
σ y<br />
dmω R = ( R t ρ dθ<br />
) ω R = t dθ<br />
σ<br />
ω<br />
2<br />
giving a specific energy of<br />
W<br />
m<br />
σ y<br />
=<br />
2<br />
R ρ<br />
=<br />
y<br />
1 σ y<br />
2 ρ<br />
(14)<br />
MJ/kg (15)<br />
where σ is in MPa and the density ρ is<br />
in kg/m 3 . Among today’s materials, CFRP<br />
has the highest value of σ y / ρ ≈<br />
1.6 MJ/kg, allowing a flywheel with specific<br />
energy of 0.8 MJ/kg. This is two orders of<br />
magnitude smaller than the value for<br />
hydrocarbons, and we have not included<br />
the protective burst shield, the motorgenerator,<br />
or any safety factors (up to five<br />
for composite materials)—all of which<br />
reduce the specific energy.<br />
2<br />
y<br />
Figure 15. Left: A flywheel. The maximum kinetic energy it can store is limited by its strength.<br />
Right: Demand ratios for critical materials used in flywheel energy storage systems with superconducting<br />
magnetic bearings. *CFRP is included because, even though it is not a critical material, large scale<br />
implementation is likely to stretch its supply.<br />
Materials for Energy Storage Systems 16 © <strong>Granta</strong> <strong>Design</strong>, Jan 2012
It has been suggested that flywheels might<br />
be constructed that exploited the great<br />
strength ( = 100 GPa, Peng et al.,<br />
σ y<br />
2008) and low density ( ρ = 1,300 kg/m 3 ,<br />
Collins & Avouris, 2000) of carbon nanotubes,<br />
allowing a specific energy of<br />
40 MJ/kg, comparable with conventional<br />
fuels. However, this neglects the need for<br />
a supporting matrix. A more realistic upper<br />
limit, following the reasoning of the<br />
previous section, is to imagine a material<br />
with the density and modulus of steel and<br />
with the theoretical strength E / 10. , giving<br />
a specific energy<br />
W<br />
m<br />
=<br />
1 σ y<br />
2 ρ<br />
=<br />
1<br />
2<br />
E<br />
10<br />
=<br />
ρ<br />
1.3<br />
MJ/kg<br />
Large scale implementation of flywheel<br />
storage systems with superconducting<br />
bearings using yttrium barium copper<br />
oxide superconductors and CFRP disks<br />
(Appendix 2) could exert pressure on<br />
supply of yttrium and CFRP (Figure 15,<br />
right).<br />
7. Thermal Storage<br />
Thermal energy storage takes two forms.<br />
1. Heating an inert solid or liquid,<br />
using its heat capacity (specific<br />
heat), (J/kg.K) to retain energy,<br />
C p<br />
2. Causing a solid to melt, using its<br />
latent heat of fusion, L m (J/kg) to<br />
capture energy.<br />
Energy is recovered by passing a heattransfer<br />
fluid through the hot or molten<br />
body, passing the heat to a heat<br />
exchanger where it generates steam or<br />
hot gas for space heating or to drive a<br />
turbine. Utility-scale thermal energy<br />
storage is used to smooth the power<br />
output of concentrated solar plants<br />
(Figure 16). The sun’s radiation is focused<br />
on a collector containing molten salt<br />
(typically 40% potassium nitrate, 60%<br />
sodium nitrate). The molten salt is held in<br />
hot tanks until the energy is needed when<br />
an oil-loop from the hot tank carries the<br />
heat to a steam generator and turbine to<br />
generate electrical power.<br />
Figure 16. Diagram of a molten salt thermal storage system connected to a solar tower.<br />
Only the thermal storage block is included when considering material usage.<br />
Materials for Energy Storage Systems 17 © <strong>Granta</strong> <strong>Design</strong>, Jan 2012
Table 5. Properties of materials for thermal energy storage.<br />
Material<br />
Melting point<br />
( o C)<br />
Specific heat<br />
(kJ/kg o C)<br />
Energy density<br />
(MJ/m 3 o C)<br />
Latent heat of<br />
fusion (MJ/kg)<br />
Aluminum 660 0.92 2.5 0.39<br />
Cast Iron 1,200 0.54 3.9 0.27<br />
Lead 324 0.13 1.5 0.034<br />
Lithium 180 3.6 1.9 0.43<br />
Sodium 100-760 1.3 0.95 0.11<br />
Molten alt (50% KNO 3 ; 40% NaNO 2 ) 140-540 1.6 2.6 -<br />
Fireclay 1450 1.0 2.1-2.6 Approx 0.8<br />
Granite 1450 0.79 1.9 Approx 0.85<br />
50% Ethylene Glycol; 50% Water 0 3.5 3.7 Approx 0.3<br />
Water 0 4.2 4.2 0.34<br />
The specific energies of present-day<br />
thermal storage systems lie in the range<br />
0.032 – 0.036 MJ/kg, comparable with<br />
batteries but at three orders of magnitudes<br />
smaller than hydrocarbon fuel. What is the<br />
upper limit on their performance To<br />
answer that we need the thermal<br />
properties of thermal storage materials.<br />
Table 5 lists some of these.<br />
The element with the greatest specific<br />
heat capacity is lithium (3.6 kJ/kg/K).<br />
Lithium melts at 180°C, but can be stored<br />
in its liquid state, conceivably up to<br />
1000°C. If we assume that the specific<br />
heat capacity of liquid lithium is the same<br />
as that of the solid and add its latent heat<br />
of fusion (~0.4 MJ/kg), the total energy<br />
density becomes ~3.5 MJ/kg.<br />
Latent heat storage offers substantial<br />
specific energy, stored and recovered over<br />
a narrow temperature range. The melting<br />
point determines the output temperature,<br />
so must be chosen to match the<br />
application. The energy density is then<br />
determined by the latent heat of fusion<br />
(Table 5).<br />
Thermal energy storage creates no<br />
alarming demands for critical materials.<br />
Meeting the scenario described earlier<br />
could require 0.6% of the world production<br />
of chromium and 5% of that of nickel.<br />
8. Batteries<br />
Batteries store chemical energy. There<br />
two classes of battery. Primary batteries<br />
can only be used once, after which they<br />
can be recycled, but not recharged.<br />
Secondary batteries can be recharged<br />
100-10,000+ times before they fail. Here,<br />
we consider six types of secondary<br />
batteries which have shown promise in<br />
utility scale or automotive scale energy<br />
storage: lead-acid, lithium ion (Li-ion),<br />
sodium-sulfur (NaS), nickel-cadmium<br />
(Ni-Cd or NiCad), nickel-metal hydride<br />
(Ni-MH), and vanadium redox flow<br />
batteries (VRB). Appendix 2 contains bills<br />
of material for each.<br />
A battery consists of two half cells, each<br />
containing a metal and a salt solution of<br />
that metal (e.g., metal sulfate). The half<br />
cell with the more reactive metal (metal A,<br />
in this example) is the anode. The metal is<br />
oxidized:<br />
A →<br />
+ 2x<br />
A<br />
+<br />
−<br />
2 x e<br />
Materials for Energy Storage Systems 18 © <strong>Granta</strong> <strong>Design</strong>, Jan 2012
Figure 17. Left: diagram of the discharge of a lead-acid battery.<br />
Right: Demand ratios for antimony and lead used in lead acid batteries.<br />
*These are not critical, but large scale implementation is expected to stretch their supply.<br />
Figure 18. Left: Diagram of the discharging of a lithium-ion battery.<br />
Right: Demand ratios for critical materials used in lithium-ion batteries.<br />
The half cell with the less reactive metal<br />
(metal B) is the cathode. The metal ions<br />
from the solution are reduced:<br />
+ 2<br />
B x −<br />
+ 2 x e →<br />
The metals from each half cell are<br />
connected to an external load through a<br />
circuit that transports the electrons from<br />
the anode to the cathode, providing<br />
electrical power. In order to maintain<br />
balance of charge, anions (negatively<br />
charged ions) are allowed to pass through<br />
B<br />
a porous disk from one solution to the<br />
other.<br />
Lead acid batteries (Figure 17) have a<br />
lead anode and a lead dioxide cathode.<br />
On discharge, both of these become lead<br />
sulfate. At the anode:<br />
−<br />
+ −<br />
Pb + HSO4<br />
→ PbSO4<br />
+ H + 2 e<br />
At the cathode the reaction is:<br />
+ − −<br />
2 + H + HSO 4 + 2 e → PbSO 4 2<br />
PbO 3 + H 2 O<br />
Materials for Energy Storage Systems 19 © <strong>Granta</strong> <strong>Design</strong>, Jan 2012
Figure 19. Left: Diagram of the discharge of a sodium-sulfur battery.<br />
Right: Demand ratios for critical materials used in sodium-sulfur batteries.<br />
Lead-acid batteries do not use critical<br />
materials in significant quantities.<br />
However, large scale implementation will<br />
require an increase in the supply of both<br />
lead and antimony (Figure 17, right).<br />
Li-ion batteries (Figure 18) have an<br />
anode of graphite intercalated with lithium<br />
and a cathode of lithium compounds.<br />
During discharge, lithium ions move from<br />
the graphite anode:<br />
+ −<br />
Li x C6 → x Li + x e + 6 C<br />
The Li + ions diffuse through the separator<br />
and are taken up by the lithium<br />
compounds (typically, a lithium metal<br />
oxide compound, LiMO) at the cathode:<br />
+ −<br />
Li1−<br />
x MO + x Li + x e → LiMO<br />
Large scale adoption of Li-ion for<br />
automotive propulsion or utility electricity<br />
storage may be constrained by the supply<br />
of lithium and graphite. Figure 18, right,<br />
shows that large scale implementation<br />
would result in lithium usage which is<br />
about eighty times today’s supply. The<br />
demand for graphite could exceed three<br />
times today’s supply production.<br />
Sodium-sulfur batteries (Figure 19) have<br />
an anode of molten sodium and a cathode<br />
of molten sulfur. On discharge, the sodium<br />
is oxidized and the ions pass through an<br />
alumina electrolyte to reduce the sulfur<br />
and create sodium polysulfide. The overall<br />
reaction is:<br />
2 Na + 4 S → Na2S4<br />
Graphite is used to contain the molten<br />
sulfur and prevent it from corroding the<br />
current collectors and casing. Large scale<br />
implementation of NaS batteries may<br />
stretch the supply of graphite, as it will use<br />
40% of the annual supply (Figure 19,<br />
right).<br />
Ni-Cd batteries (Figure 20) have a<br />
cadmium-plated anode and a nickel oxidehydroxide<br />
plated cathode. On discharge,<br />
the cadmium at the anode is oxidized:<br />
−<br />
−<br />
Cd + 2 OH → Cd(<br />
OH ) 2 + 2 e<br />
The nickel oxide-hydroxide is reduced:<br />
−<br />
−<br />
NiO(<br />
OH ) + H 2 O + 2 e → Ni(<br />
OH ) 2 + OH<br />
Materials for Energy Storage Systems 20 © <strong>Granta</strong> <strong>Design</strong>, Jan 2012
Figure 20. Left: Diagram of the discharge of a nickel-cadmium battery. Right: Demand ratios for critical<br />
materials used in nickel-cadmium batteries. *Cadmium is included because, even though it is not a critical<br />
material, large scale implementation is likely to stretch its supply.<br />
Figure 21. Left: Diagram of the discharge of a nickel-metal hydride battery.<br />
Right: Demand ratios for critical materials used in nickel-metal hydride batteries.<br />
Large scale implementation of Ni-Cd<br />
batteries could be constrained by of<br />
supply of nickel, cobalt, and lithium<br />
(Figure 20, right). Although cadmium is not<br />
classified as a critical material, assuring its<br />
supply could be a problem.<br />
Nickel-metal hydride batteries<br />
(Figure 21) resemble Ni-Cd batteries, but<br />
the anode is plated with a metal hydride<br />
rather than cadmium. On discharge, the<br />
metal hydride is oxidized:<br />
−<br />
−<br />
MH + OH → M + H 2O<br />
+ 2 e<br />
The nickel is reduced, as in the Ni-Cd<br />
batteries:<br />
−<br />
−<br />
NiO(<br />
OH ) + H 2 O + 2 e → Ni(<br />
OH ) 2 + OH<br />
Materials for Energy Storage Systems 21 © <strong>Granta</strong> <strong>Design</strong>, Jan 2012
Figure 22. Left: Diagram of the discharge of a vanadium redox flow battery. Right: Demand ratios for critical<br />
materials used in vanadium flow batteries. *Vanadium is included because, although it is not a critical<br />
material, large scale implementation is likely to stretch its supply.<br />
The anode, typically, is a hydride of<br />
lanthanum, neodymium, praseodymium,<br />
or cerium. Of these, cerium has the largest<br />
annual production, so we assume that the<br />
large scale implementations would use<br />
cerium hydride. This would result in a<br />
bottleneck of cerium and nickel supply<br />
(Figure 21, right). Even if the large scale<br />
implementation used a mixture of the<br />
available metals, such that only ¼ of the<br />
cerium was used, this would still result in<br />
the use of 200 times the current annual<br />
production—and this ratio would be larger<br />
for the other elements.<br />
Vanadium redox batteries (Figure 22)<br />
differ from other batteries. The electrolytes<br />
are stored in tanks, and are pumped<br />
through the battery cell, where they are<br />
reduced or oxidized. The anode and<br />
cathode electrolytes are made up of a<br />
solution of vanadium in different oxidation<br />
states. The anode electrolyte is a solution<br />
of vanadium (II) ions, which are oxidized<br />
to vanadium (III) ions on discharge:<br />
+ 2<br />
V<br />
+ 3<br />
→ V<br />
−<br />
+ e<br />
The cathode electrolyte is a solution of<br />
vanadium (V) oxide ions, which are<br />
reduced to vanadium (IV) oxide ions:<br />
+ + − + 2 −<br />
VO2<br />
+ H + e → VO + OH<br />
Large scale implementation of VRBs<br />
would use a significant fraction of today’s<br />
production of graphite (Figure 22, right)<br />
and would stretch the supply of vanadium,<br />
even though this is not a critical material.<br />
The ultimate limits for batteries<br />
To determine the maximum theoretical<br />
specific energy of batteries, we need to<br />
consider the standard electrode potential<br />
(SEP) of various half-cells. Consider, as<br />
an example, a lithium anode and a fluorine<br />
cathode (ignoring any practicalities of<br />
making this safe!), a combination with an<br />
exceptional high SEP differences. The<br />
oxidation of lithium<br />
+ −<br />
Li → Li + e<br />
has a standard electrode potential of<br />
3.04 V, and the reduction of fluorine<br />
F + 2 e<br />
− → 2 F<br />
−<br />
2<br />
has a standard electrode potential of<br />
2.87 V. The overall reaction<br />
2 Li + F2 → 2 LiF<br />
Materials for Energy Storage Systems 22 © <strong>Granta</strong> <strong>Design</strong>, Jan 2012
gives a cell voltage of V=5.91 V. For one<br />
mole of reactants, having a mass of<br />
51.9 g, the two moles of electrons<br />
exchanged, with charge C = 2 x 96,485<br />
Coulombs, will deliver the energy:<br />
W = V C = 5 .91 x 2 96,485 = 1.14 MJ / mole<br />
corresponding to a specific energy of<br />
22 MJ/kg, comparable with that of<br />
conventional fuels (20 – 50 MJ/kg). Safety<br />
concerns have held back the development<br />
of the lithium-fluorine cell. The closest<br />
technology is the lithium-carbon<br />
monofluoride (Li-CFx) cell, which has the<br />
combined reaction:<br />
x Li + ( CF)<br />
x → x LiF +<br />
x C<br />
The carbon maintains the fluorine in a safe<br />
compound, but reduces the theoretical<br />
energy density to 7.9 MJ/kg, which we will<br />
take as an upper limit for battery<br />
technology. In practice real (Li-CFx) cells<br />
have only achieved energy densities in the<br />
range 0.94 – 2.8 MJ/kg, and they are not<br />
rechargeable.<br />
9. Hydrogen Energy Storage<br />
Energy can be stored by using it to<br />
generate hydrogen by electrolysis of water<br />
(Figure 23). Energy is recovered by<br />
passing the hydrogen to a fuel cell to<br />
generate electricity. Electrolysis breaks<br />
the water into positive H + ions (or protons)<br />
and oxygen. At the anode:<br />
+ −<br />
2 H 2O<br />
→ O2<br />
+ 4 H + 4 e<br />
At the cathode:<br />
+ −<br />
2 H + 2 e → H 2<br />
In the fuel cell hydrogen passes the<br />
anode, where it is oxidized to hydrogen<br />
ions (or protons) and electrons at the<br />
anode:<br />
+ −<br />
H 2 → 2 H + 2 e<br />
At the cathode, oxygen is reduced with the<br />
hydrogen to form water:<br />
+ −<br />
O2 + 4 H + 4 e → 2 H 2O<br />
The electrolyte allows passage of<br />
hydrogen ions but not electrons. The<br />
electrons flow through an external circuit,<br />
Figure 23. Diagram of hydrogen energy storage.<br />
Materials for Energy Storage Systems 23 © <strong>Granta</strong> <strong>Design</strong>, Jan 2012
where they deliver energy to a load.<br />
Catalysts are required at the cathode and<br />
anode, platinum at the anode, and nickel<br />
at the cathode. Their use raises concerns<br />
over supply: large scale deployment might<br />
use ~25% of nickel supply and 400% of<br />
world production of platinum (Figure 24).<br />
Figure 24. Demand ratios for critical materials used<br />
in hydrogen storage systems.<br />
The performance metrics of hydrogen<br />
storage presented in Table 2, and used in<br />
subsequent charts, are based on<br />
conceptual designs of a hydrogen storage<br />
system for which a number of<br />
assumptions have been made. The data is<br />
based on hydrogen generators and fuel<br />
cells (Hydrogenics, 2010). The mass of<br />
the hydrogen generator was not included<br />
in the onboard hydrogen storage. The<br />
specific energy and energy density of the<br />
stored hydrogen are based on the US<br />
Department of Energy 2010 targets for<br />
hydrogen storage of 5.4 MJ/kg and<br />
3.2 MJ/m 3 (US Department of Energy,<br />
2011), which have been met by MOF-177<br />
(a zinc compound that absorbs hydrogen<br />
as a hydride).<br />
The US Department of Energy has also<br />
set ultimate targets for the specific energy<br />
and energy density of hydrogen storage:<br />
9 MJ/kg and 8,300 MJ/m 3 . These can be<br />
taken as the practical limits on hydrogen<br />
energy storage, assuming that they will<br />
not be significantly affected by the mass of<br />
the fuel cell and hydrogen generator.<br />
These are barely competitive with<br />
conventional fuels, but many automotive<br />
companies are already investing heavily in<br />
research on hydrogen power vehicles.<br />
10. Capacitors and supercapacitors<br />
A capacitor stores energy as electrical<br />
charge. At its simplest it consists of two<br />
closely-spaced plates with a dielectric<br />
between them (Figure 25, left). Energy is<br />
used to move charge from one plate to the<br />
other, creating a potential difference<br />
between them. Energy is extracted by<br />
allowing the charge to return, passing<br />
through an external load. Capacitors can<br />
be charged and discharged very quickly<br />
giving high specific power, but their<br />
specific energy is small, about<br />
0.0001 MJ/kg.<br />
Figure 25. Left A capacitor. Right: A super-capacitor<br />
Materials for Energy Storage Systems 24 © <strong>Granta</strong> <strong>Design</strong>, Jan 2012
The energy stored in a capacitor is<br />
1 2<br />
W = C V<br />
2<br />
where C is the capacitance and V is the<br />
voltage. However, the electric field cannot<br />
exceed the breakdown field, V d , which<br />
limits the voltage to V = Vd<br />
d , where d is<br />
the distance between plates. The<br />
capacitance of a capacitor is given by<br />
C = ε A / d where ε = ε r ε o is the electric<br />
permittivity of the dielectric, ε r is the<br />
relative permittivity, ε o is the permittivity of<br />
free space, and A is the area of the<br />
plates. Assembling these results gives the<br />
maximum energy that the capacitor can<br />
contain without breakdown:<br />
1<br />
2<br />
Wmax<br />
= ε r ε o A d V<br />
2<br />
d<br />
and a maximum specific energy<br />
Wmax<br />
m<br />
2<br />
1 Vd<br />
= ε r ε o<br />
2 ρ<br />
where m is the mass and ρ is the<br />
density of the dielectric. The maximum<br />
specific energy of a number of dielectrics,<br />
listed in Table 6, suggests that capacitors<br />
with a styrene-butadiene dielectric might<br />
double the performance to 0.0002 MJ/kg.<br />
Super-capacitors offer greater<br />
performance. Super-capacitors store the<br />
charges at the interface between activated<br />
carbon and a liquid electrolyte (Figure 25,<br />
right), rather than between two plates.<br />
Because of the large surface to volume<br />
ratio of activated carbon, and the<br />
vanishingly thin distance over which the<br />
charge is stored, super-capacitors have<br />
greater capacitance and energy densities<br />
of 0.01-0.1 MJ/kg. The band-gap of<br />
dielectric materials limits the maximum<br />
energy density achievable in supercapacitors<br />
to about 2 MJ/kg (House,<br />
2009), still an order of magnitude less than<br />
that of conventional fuels.<br />
Super-capacitors do not use critical<br />
materials so that large scale<br />
implementation would not result in supply<br />
bottlenecks.<br />
Dielectric<br />
Table 6. Properties of dielectric materials 5 .<br />
Dielectric Breakdown Density, ρ<br />
constant, ε r field, V d (kg/m 3 )<br />
(MV/m)<br />
Specific energy<br />
(MJ/kg)<br />
Syrene-Butadiene Block<br />
Copolymer<br />
2.45-2.55 85-140 1,000 0.0001-0.0002<br />
Cyclo Olefin Polymer 2.13-2.47 67-73 1,000 0.00005<br />
Transparent Polyamide<br />
(nylon)<br />
3.3-4.6 49-51 1,000 0.00004-0.00005<br />
Vermiculite 6-8 8-14 64-160 0.00002-0.00007<br />
Mica 5.4-8.7 40-79 2,600-3,200 0.00001-0.00007<br />
Alumina (97.6) 9.0-9.5 41-45 3,700-3,800 0.00002<br />
5 Data from CES EduPack<br />
Materials for Energy Storage Systems 25 © <strong>Granta</strong> <strong>Design</strong>, Jan 2012
11. Superconducting Magnetic<br />
Energy Storage (SMES)<br />
Superconducting magnetic energy storage<br />
(SMES) systems store energy as a<br />
magnetic field, set up by passing current<br />
through a superconducting coil. Because<br />
there is no resistance, the current and the<br />
field, once established, continues to flow<br />
without consuming further power. Energy<br />
is recovered by discharging the current<br />
through an external load.<br />
Superconducting magnets require<br />
refrigeration and that does consume<br />
power, reducing efficiency, especially over<br />
large periods. High temperature<br />
superconductors (HTS) such as YBCO—<br />
yttrium barium copper oxide—which<br />
become superconducting at ~77K require<br />
less power for refrigeration than low<br />
temperature ~4K superconductors (LTS),<br />
but they still need some. For this reason,<br />
SMES tends to be used for short term<br />
storage (e.g., for frequency regulation).<br />
The energy density stored in a magnetic<br />
field is:<br />
Based on current HTS-SMES systems,<br />
large scale implementation would result in<br />
a bottleneck of supply of Yttrium, essential<br />
for the superconducting YBCO magnets<br />
(Figure 26).<br />
Figure 26. Demand ratios for critical materials<br />
used in superconducting magnetic energy<br />
storage.<br />
W<br />
V<br />
=<br />
2<br />
1 B<br />
2 µ<br />
o<br />
where B is the magnetic flux density and<br />
µ o is the permittivity of free space. The<br />
energy density is maximized by<br />
maximizing B , which, for a type-II<br />
superconductor, cannot exceed the upper<br />
critical field of the magnet windings. The<br />
upper critical field of YBCO is 250 T at a<br />
temperature of zero Kelvin. If 250 T can<br />
be achieved, an energy density of<br />
25,000 MJ/m 3 can be achieved. Assuming<br />
a similar physical density to today’s SMES<br />
devices, this would result in a specific<br />
energy of 50 MJ/kg. This is competitive<br />
with fuels, but is only achieved at<br />
unrealistically low temperatures, and does<br />
not include the mass of the cryostat and<br />
ancillary devices.<br />
Materials for Energy Storage Systems 26 © <strong>Granta</strong> <strong>Design</strong>, Jan 2012
Appendix 1 Definition of terms<br />
Resource intensities of<br />
construction<br />
Capital intensity<br />
US$/MJ<br />
The capital intensity of an energy-storage<br />
system is the cost of building or<br />
purchasing the system per megajoule of<br />
storage capacity. As an example, a typical<br />
alkaline AA battery has a capacity of<br />
around 13.5x10 -3 MJ and costs about a<br />
dollar. Its capital intensity is:<br />
Capital intensity<br />
= Cost/Storage capacity<br />
= 1 / 0.0135<br />
= 74 $/MJ<br />
Area intensity m 2 /MJ<br />
The area intensity of an energy storage<br />
system is the area of land that the system<br />
typically occupies per megajoule of<br />
storage capacity. As an example, the<br />
Ffestiniog pumped hydro power station<br />
has an area of 340,000 m² and can store<br />
4.7 x 10 6 MJ. Its area intensity is:<br />
Area intensity<br />
= Area/Storage capacity<br />
= 340,000 / (4.7 x 10 6 )<br />
= 0.07 m 2 /MJ<br />
Material intensity<br />
kg/MJ<br />
The material intensity of an energy<br />
storage system is the mass of material<br />
that the system typically requires per<br />
megajoule of storage capacity. As an<br />
example, a particular Bosch car battery<br />
has a capacity of 4.36 MJ and a mass of<br />
23.2 kg. Its mass intensity is calculated as<br />
Material intensity<br />
= Mass of material/Storage capacity<br />
= 23.2 / 4.36<br />
= 5.4 kg/MJ<br />
The bill of materials for a given storage<br />
system allows the material intensity to be<br />
broken down by material. These materialspecific<br />
intensities can then be compared<br />
to the annual world production of that<br />
material to flag up systems that, if<br />
deployed widely, might be constrained by<br />
material supply.<br />
Energy intensity<br />
MJ/MJ<br />
The energy intensity of an energy storage<br />
system is the energy required to create<br />
the system per megajoule of storage<br />
capacity. This includes the energy needed<br />
to extract and process raw materials,<br />
fabricate components, and construct the<br />
final plant, with transport at different<br />
stages of the construction process taken<br />
into account. As an example, the energy<br />
needed to build a hypothetical molten salt<br />
thermal storage system with a capacity of<br />
7.2x10 6 MJ was calculated at 9.2x10 8 MJ.<br />
Its energy intensity is:<br />
Energy intensity<br />
= Construction energy/Storage capacity<br />
= 9.2 x 10 8 /(7.2 x 10 6 )<br />
= 128 MJ/MJ<br />
CO2<br />
intensity<br />
kg/MJ<br />
The CO 2 intensity (or carbon intensity) of<br />
an energy storage system is the CO 2<br />
(equivalent) released to the atmosphere<br />
as a consequence of its construction the<br />
system per megajoule of storage capacity.<br />
As an example, a hypothetical thermal<br />
energy storage system has a capacity of<br />
7.2x10 6 MJ and causes the emission of<br />
6.4x10 7 kg of CO 2 . The carbon intensity is:<br />
CO 2 intensity<br />
= CO 2 emission/Storage capacity<br />
= 6.4 x 10 7 / (7.2 x 10 6 )<br />
= 8.9 kg/MJ<br />
Operational parameters<br />
Specific energy<br />
MJ/kg<br />
The specific energy of an energy-storage<br />
system is the energy the system can store<br />
per unit of its mass. As and example, a<br />
silver oxide button cell has a mass of 0.7 g<br />
(7x10 -4 kg) whilst storing 2.2x10 -4 MJ. Its<br />
specific energy is<br />
Specific energy<br />
= Energy stored/Mass<br />
= 2.2 x 10 -4 / (7 x 10 -4 )<br />
= 0.31 MJ/kg<br />
Energy density<br />
MJ/m<br />
The energy density of an energy-storage<br />
system is the energy the system can store<br />
per unit of volume. As an example, a lead-<br />
3<br />
Materials for Energy Storage Systems 27 © <strong>Granta</strong> <strong>Design</strong>, Jan 2012
acid battery measuring 120x80x80 mm<br />
can store 0.3 MJ. Its energy density is:<br />
Energy density<br />
= Energy stored/Volume<br />
= 0.3 / (7.7 x 10 -4 )<br />
3<br />
= 391 MJ/m<br />
Specific power<br />
W/kg<br />
The specific power is the rate at which<br />
energy can be drawn from the system per<br />
unit of its mass. As an example, the<br />
Maxwell VCAP350 super-capacitor weighs<br />
63 g (6.3x10 -2 kg) and can discharge with<br />
a continuous power of 67.5 W. Its specific<br />
power is calculated to be<br />
Specific power<br />
= Energy per second/Mass<br />
= 67.5 / 0.063<br />
= 1071 W/kg<br />
Economic energy-storage capacity<br />
W/kg<br />
The economic energy storage capacity is<br />
the range of energy for which a particular<br />
storage system is economically viable. As<br />
an example, it is impractical to create a<br />
pumped hydro storage plant for a tiny<br />
amount of amounts of energy. It is equally<br />
impractical to use silver oxide batteries to<br />
store megajoules of energy.<br />
Economic energy power capacity W/kg<br />
The economic power capacity of an<br />
energy storage technology is the range of<br />
power outputs that systems can deliver<br />
economically.<br />
Cycle efficiency %<br />
The cycle efficiency is the percentage of<br />
the energy put into a system that is<br />
recovered when the energy is retrieved.<br />
This is measured for a typical cycle time,<br />
and will usually decrease if cycle is<br />
unusually long. As examples, a battery will<br />
slowly discharge if unused and frictional<br />
losses of a flywheel increase the longer it<br />
is spinning.<br />
Cycle efficiency<br />
= (Energy output / Energy input) x 100<br />
Cycle life -<br />
The cycle life is the number of times an<br />
energy storage system can charged and<br />
discharged before the capacity of the<br />
system drops below 80% of its initial<br />
capacity. Cycle life is limited by factors<br />
such as fatigue in mechanical systems<br />
and electrolyte degradation in<br />
electrochemical systems.<br />
Operating cost<br />
US$/MJ<br />
The operating cost is the approximate cost<br />
of one charge/discharge cycle of one unit<br />
of energy, and includes the cost of<br />
maintenance, heating, labor, etc.<br />
Adaptable for mobile systems Yes/No<br />
Adaptable for mobile systems. If ticked<br />
(meaning Yes) the energy storage system<br />
is suitable for providing mobile power such<br />
as powering an automobile or a portable<br />
communication device.<br />
Upper limits for performance<br />
metrics<br />
Theoretical max specific energy MJ/kg<br />
The maximum specific energy of an<br />
energy storage system is the theoretical<br />
upper limit to the energy it can store per<br />
unit mass. As an example, the theoretical<br />
strength, roughly E/10 (where E is<br />
Young’s modulus) sets an absolute upper<br />
limit to the energy that could be stored in<br />
springs and flywheels.<br />
3<br />
Theoretical max energy density MJ/m<br />
The maximum energy density of an<br />
energy storage system is the theoretical<br />
upper limit to the energy it can store per<br />
unit volume. As an example, the<br />
theoretical strength, roughly E/10 (where<br />
E is Young’s modulus) sets an absolute<br />
upper limit to the energy that could be<br />
stored in springs and flywheels.<br />
Status<br />
Current installed capacity<br />
GJ<br />
The current installed capacity is the sum<br />
of the energy storage capacities of all<br />
systems using a certain technology<br />
worldwide.<br />
Growth rate<br />
% per year<br />
The growth rate is the rate of additional<br />
energy capacity added per year,<br />
expressed as a percentage of the current<br />
installed capacity.<br />
Materials for Energy Storage Systems 28 © <strong>Granta</strong> <strong>Design</strong>, Jan 2012
Appendix 2: Approximate<br />
Material Intensities for Energy<br />
Storage Systems<br />
Bills of materials for energy storage<br />
systems are assembled here. They are<br />
expressed as material intensities, I m ,<br />
meaning mass (kg) of each material per<br />
unit (MJ) of energy storage capacity.<br />
There is no systematic, self consistent<br />
assembly of such data of which we are<br />
aware, so it has to be patched together<br />
from diverse sources. These differ in detail<br />
and scope. Some, for instance, are limited<br />
to the system alone, others include the<br />
copper and other materials needed to<br />
connect the system to the grid. Others<br />
give indirect information from which<br />
missing material content can be inferred.<br />
So be prepared for inconsistencies.<br />
Despite these difficulties there is enough<br />
information here to draw conclusions<br />
about the demand that a commitment to<br />
any one of them would put on material<br />
supply. The resource-demand plots in the<br />
text use the data in these tables. They are<br />
based on an imagined scenario: that in<br />
order to meet global electric power<br />
demand, the capacity of a chosen power<br />
system must be expanded by 200 GW per<br />
Pumped Hydro Storage<br />
year (See the Materials for Low Carbon<br />
Power White Paper), and to compliment<br />
this, 10 hours of storage capacity must be<br />
built—meaning 2,000 GW.hr or 7.2 PJ<br />
(equal to 7.2 x 10 6 MJ) of storage capacity<br />
per year. The metric for resource pressure<br />
Rs<br />
is the mass of each material required<br />
for the expansion of the system per year,<br />
6<br />
7.2 x10<br />
I m , expressed in kg/year divided<br />
by the current (2010) global production per<br />
year, , also expressed in kg/year.<br />
P a<br />
6<br />
Rs<br />
= 7.2 x10<br />
I m<br />
Pa<br />
The plots show this as the percent<br />
demand of current production.<br />
The resource demand is not interesting<br />
when it is trivial. The plots show the<br />
demand on the materials that are deemed<br />
to be “critical”, as explained in Section 2,<br />
together with other (non-critical) materials<br />
whose supply will likely be stretch by large<br />
scale implementation of the particular<br />
system. Their global annual productions<br />
for critical materials in 2010 appear Figure<br />
10. They are marked with an asterisk (*) in<br />
the tables below.<br />
Material<br />
Intensity (kg/MJ)<br />
Aluminum 0.01<br />
Brass 0.0002-0.0014<br />
Chromium* 0.005-0.01<br />
Concrete 60-120<br />
Copper 0.0014-0.0049<br />
Iron 0.60-0.79<br />
Lead 0.0006-0.005<br />
Magnesium 0.0002-0.002<br />
Manganese* 0.0004-0.003<br />
Molybdenum 0.0005-0.004<br />
Plastics 0.012-0.02<br />
Wood 0.16-1.3<br />
Zinc 0.0008-0.01<br />
Total mass, all materials 61-120<br />
Materials and quantities (Tahara et al., 1997), (Pacca & Horvath, 2002), (Vattenfall AB<br />
Generation Nordic, 2008) and (Ribeiro & da Silva, 2010).<br />
Materials for Energy Storage Systems 29 © <strong>Granta</strong> <strong>Design</strong>, Jan 2012
Compressed Air Energy Storage<br />
Material<br />
Intensity (kg/MJ)<br />
Carbon steel 0.0084-0.054<br />
Chromium* 0.000006-0.00013<br />
Concrete 1.8-12<br />
Copper 0.00025-0.0016<br />
High Alloy Steel 0.086-0.56<br />
Iron 0.0045-0.029<br />
Manganese* 0.0011-0.0069<br />
Molybdenum 0.000011-0.000069<br />
Plastics 0.00093-0.0060<br />
Silicon 0.00024-0.0015<br />
Vanadium 0.000032-0.00021<br />
Total mass, all materials 1.9-13<br />
Materials and quantities from (Meier & Kulcinski, 2000).<br />
Flywheels<br />
Material<br />
Intensity (kg/MJ)<br />
Carbon Fiber 1.8<br />
Carbon Steel 12-400<br />
Copper 1-30<br />
Plastics 2-4<br />
YBCO 0.0058-0.17<br />
of which Barium 0.0024-0.07<br />
of which Copper 0.0017-0.051<br />
of which Yttrium* 0.00078-0.023<br />
Total mass, all materials 17-500<br />
Materials and quantities from (Hartikainen et al., 2007).<br />
Thermal Storage<br />
Material<br />
Intensity (kg/MJ)<br />
Calcium Silicate 0.06-0.12<br />
Carbon Steel 0.78-1.4<br />
Chromium* 0.008-0.03<br />
Concrete 3.1-4.8<br />
Foam Glass 0.041-0.084<br />
Mineral Wool 0.15-0.26<br />
Molten Salt<br />
7.1-24<br />
(40% KNO 3 , 60% NaNO 3 )<br />
Nickel* 0.0044-0.017<br />
Nitrogen 0.026-0.4<br />
Refractory Brick 0.40-0.62<br />
Silica 0-17<br />
Total mass, all materials 12-48<br />
Materials and quantities from (Heath et al., 2009).<br />
Materials for Energy Storage Systems 30 © <strong>Granta</strong> <strong>Design</strong>, Jan 2012
Lead Acid Batteries<br />
Material<br />
Intensity (kg/MJ)<br />
Antimony 0.055-0.14<br />
Copper 0.017-0.042<br />
Glass 0.11-0.28<br />
Lead 1.4-3.5<br />
Lead oxides 1.9-4.9<br />
Plastics 0.55-1.4<br />
Sulfuric Acid 0.55-1.4<br />
Total mass, all materials 4.6-12<br />
Materials and quantities from (Sullivan & Gaines, 2010).<br />
Lithium-Ion Batteries<br />
Material<br />
Intensity (kg/MJ)<br />
Aluminum 0.072<br />
Carbon Black 0.075-0.09<br />
Copper 0.13<br />
Ethylene Glycol Dimethyl Ether 0.44<br />
Graphite* 0.47<br />
Lithium Compounds 1.2<br />
of which Lithium* 0.2<br />
Plastics 0.18-0.2<br />
Total mass, all materials 1.5-2.6<br />
Based on Iron Phosphate type Lithium Ion Batteries. Materials and quantities from (Zackrisson et al., 2010).<br />
Sodium-Sulfur Batteries<br />
Material<br />
Intensity (kg/MJ)<br />
Alumina 0.18-0.63<br />
Aluminum 0.32-1.1<br />
Carbon Steel 0.18-0.64<br />
Copper 0.05-0.17<br />
Glass 0.06-0.22<br />
Graphite* 0.03-0.1<br />
Plastics 0.11-0.4<br />
Silica 0.21-0.76<br />
Sodium 0.11-0.4<br />
Sulfur 0.18-0.63<br />
Total mass, all materials 1.4-5<br />
Materials and quantities from (Sullivan & Gaines, 2010).<br />
Materials for Energy Storage Systems 31 © <strong>Granta</strong> <strong>Design</strong>, Jan 2012
Nickel-Cadmium Batteries<br />
Material<br />
Intensity (kg/MJ)<br />
Cadmium 1.1-3.1<br />
Carbon Steel 0.38-1.1<br />
Chromium* 0.091-0.26<br />
Cobalt* 0.06-0.18<br />
Copper 0.18-0.51<br />
Lithium Hydroxide 0.03-0.09<br />
of which Lithium* 0.0087-0.025<br />
Nickel and Compounds 1.6-4.7<br />
of which Nickel* 1.3-3.9<br />
Plastics 0.13-0.39<br />
Potassium Hydroxide 0.22-0.65<br />
Total mass, all materials 3.8-11<br />
Materials and quantities from (Sullivan & Gaines, 2010) and (Gaines & Singh, 1995).<br />
Nickel-Metal Hydride Batteries<br />
Material<br />
Intensity (kg/MJ)<br />
Carbon Steel 1.2-3.5<br />
Cerium* 0.22-0.64<br />
Nickel and Compounds 0.81-2.4<br />
of which Nickel* 0.66-2.0<br />
Plastics 0.14-0.04<br />
Potassium Hydroxide 0.08-0.24<br />
Total mass, all materials 2.5-6.8<br />
Materials and quantities from (Sullivan & Gaines, 2010).<br />
Vanadium Flow Batteries<br />
Material<br />
Intensity (kg/MJ)<br />
Carbon Black 0.037-0.065<br />
Carbon Steel 0.85-1.5<br />
Copper 0.064-0.11<br />
Graphite* 0.024-0.042<br />
Plastics 0.31-0.54<br />
Sulfuric Acid 2.1-3.6<br />
Vanadium 0.45-0.78<br />
Total mass, all materials 3.8-6.6<br />
Materials and quantities from (Rydh, 1999).<br />
Materials for Energy Storage Systems 32 © <strong>Granta</strong> <strong>Design</strong>, Jan 2012
Hydrogen Storage<br />
Material<br />
Intensity (kg/MJ)<br />
Aluminum 0.03<br />
Carbon Black 0.01<br />
Carbon Steel 1.7<br />
Chromium* 0.09<br />
Copper 0.2<br />
Glass Fiber 0.06<br />
Graphite* 0.24<br />
Molybdenum 0.0007<br />
Nickel* 0.05<br />
Phosphoric Acid 0.02<br />
Plastics 0.04<br />
Platinum* 0.000003<br />
Silicon Carbonate 0.12<br />
Zinc 0.06<br />
Total mass, all materials 2.6<br />
Materials and quantities from (van Rooigen, 2006) and (Nadal, 1997).<br />
Super-capacitors<br />
Material<br />
Intensity (kg/MJ)<br />
Activated Carbon 12-14<br />
Aluminum 9.8-20<br />
Plastics 1-2.5<br />
Ammonium Salts in Acetonitrile 23-29<br />
Total mass, all materials 45-66<br />
Materials and quantities from (Maxwell Technologies, Inc., 2009) and (Maxwell Technologies, Inc., 2011).<br />
Superconducting Magnetic Energy Storage<br />
Material<br />
Intensity (kg/MJ)<br />
Carbon Steel 32<br />
Copper 3.8<br />
Sulfuric Acid 0.22<br />
YBCO 0.52<br />
of which Barium 0.21<br />
of which Copper 0.15<br />
of which Yttrium* 0.07<br />
Total mass, all materials 36<br />
Materials and quantities from (Hartikainen et al., 2007).<br />
Materials for Energy Storage Systems 33 © <strong>Granta</strong> <strong>Design</strong>, Jan 2012
Further Reading<br />
The starting point—sources that help with the big picture<br />
Electricity Storage Association (2009) “Technology Comparison” Electricity Storage<br />
Association, Washington, DC USA<br />
http://www.electricitystorage.org/technology/storage_technologies/technology_comparison<br />
(Accessed 08/11)<br />
Harvey, L.D.D. (2010) “Mitigating the adverse effect of fluctuations in available wind energy”<br />
in “Energy and the New Reality 2: Carbon-Free Energy Supply” Earthscan Publishing,<br />
London UK. ISBN 978-1-84971-073-2 pp. 129-138<br />
House, K.Z. (2009) “The limits of energy storage technology” The Bulletin of Atomic<br />
Sciences http://www.thebulletin.org/web-edition/columnists/kurt-zenz-house/the-limits-ofenergy-storage-technology<br />
(Accessed 07/11)<br />
MacKay D.J.C. (2009) “Fluctuations and Storage” in “Sustainable energy – without the hot<br />
air” UIT Publishers, Cambridge UK. ISBN 978-0-9544529-3-3 and<br />
http://www.withouthotair.com pp. 186-202<br />
Rastler, D. (2009) “Overview of Electric Energy Storage Options for the Electric Enterprise”<br />
Electric Power Research Institute, CA USA<br />
http://www.energy.ca.gov/2009_energypolicy/documents/2009-04-<br />
02_workshop/presentations/0_3%20EPRI%20-%20Energy%20Storage%20Overview%20-<br />
%20Dan%20Rastler.pdf (Accessed 08/11)<br />
Rastler, D. (2011) “Energy Storage Technology Status” Electric Power Research Institute,<br />
CA USA<br />
http://mydocs.epri.com/docs/publicmeetingmaterials/1104/4ANZGWRJTYQ/E236208_02._R<br />
astler_Energy_Storage_Technology_Status.pdf (Accessed 08/11)<br />
Ribeiro, P.F., Johnson, B.K., Crow, M.L., Arsoy, A. and Liu, Y. (2001) “Energy storage<br />
systems for advanced power applications” Proceedings of the IEEE Vol. 89 (12) pp. 1744-<br />
1756<br />
Schaber, C., Mazza, P. and Hammerschlag, R. (2004) “Utility-Scale Storage of Renewable<br />
Energy” The Electricity Journal Vol. 17 (6) pp. 21-24<br />
Schoenung S.M. (2001) “Characteristics and Technologies for Long-vs. Short-Term Energy<br />
Storage” Sandia National Laboratories, CA USA http://prod.sandia.gov/techlib/accesscontrol.cgi/2001/010765.pdf<br />
(Accessed 08/11)<br />
Schoenung, S.M. and Hassenzahl, W.V. (2003) “Long- vs. Short-Term Energy Storage<br />
Technologies Analysis” Sandia National Laboratories, CA USA<br />
http://prod.sandia.gov/techlib/access-control.cgi/2003/032783.pdf (Accessed 08/11)<br />
Pumped Hydro Storage<br />
Denholm, P. and Kulcinski, G.L. (2004) “Life cycle energy requirements and greenhouse gas<br />
emissions from large scale energy storage systems” Energy Conversion and Management<br />
Vol. 45 (13-14) pp. 2153-72<br />
Pacca, S. and Horvath, A. (2002) “Greenhouse Gas Emissions from Building and Operating<br />
Electric Power Plants in the Upper Colorado River Basin” Environmental Science and<br />
Technology, Vol. 36 (14) pp.3194-3200<br />
Ribeiro, F.d.M. and da Silva, G.A. (2010) “Life-cycle inventory for hydroelectric generation: a<br />
Brazilian case study” Journal of Cleaner Production, Vol. 18 (1) pp.44-54<br />
Materials for Energy Storage Systems 34 © <strong>Granta</strong> <strong>Design</strong>, Jan 2012
Tahara, K., Kojima, T. and Inaba, A. (1997) “Evaluation of CO2 payback time of power<br />
plants by LCA” Proceedings of the Third International Conference on Carbon Dioxide<br />
Removal, Energy Conversion and Management<br />
Vattenfall AB Generation Nordic (2008) “Certified Environmental Product Declaration<br />
EPD(R) of Electricity from Vattenfall's Nordic Hydropower”<br />
http://www.vattenfall.com/en/file/Environmental_Product_Declara_8459904.pdf (Accessed<br />
08/11)<br />
Compressed Air Energy Storage<br />
BINE Informationsdienst (2007) “AA-CAES – Forschungsziele”,<br />
http://www.bine.info/hauptnavigation/publikationen/projektinfos/publikation/druckluftspeicherkraftwerke/aa-caes-forschungsziele/<br />
(Accessed 07/11)<br />
Denholm, P. and Kulcinski, G.L. (2004) “Life cycle energy requirements and greenhouse gas<br />
emissions from large scale energy storage systems” Energy Conversion and Management<br />
Vol. 45 (13-14) pp. 2153-2172<br />
Iowa Stored Energy Park, The (2010) “About The Iowa Stored Energy Park”<br />
http://www.isepa.com/about_isep.asp (Accessed 08/11)<br />
Knight, M. (2008) “Where to store wind-powered energy Under water!” CNN, Technology<br />
http://edition.cnn.com/2008/TECH/science/03/31/windpower/ (Accessed 08/11)<br />
Meier, P.J. and Kulcinski, G.L. (2000) “Life-Cycle Energy Cost and Greenhouse Gas<br />
Emissions for Gas Turbine Power” Energy Centre of Wisconsin<br />
http://www.ecw.org/prod/202-1.pdf (Accessed 08/11)<br />
Messina, J. (2010) “Compressed Air Energy Storage: Renewable Energy” Physorg,<br />
Technology, Energy & Green Tech http://www.physorg.com/news188048601.html<br />
(Accessed 08/11)<br />
Zolfagharifard, E. (2011) “Compressed air energy storage has bags of potential” The<br />
Engineer http://www.theengineer.co.uk/1008374.article (Accessed 08/11)<br />
Springs<br />
Chiu, C.H., Hwan, C.L., Tsai, H.S. and Lee, W.P. (2007) “An experimental investigation into<br />
the mechanical behaviors of helical composite springs” Composite Structures, Vol. 77 (3) pp.<br />
331-340<br />
Hill, F.A., Havel, T.F. and Livermore, C. (2009) “Modeling mechanical energy storage in<br />
springs based on carbon nanotubes” Nanotechnology<br />
Flywheels<br />
Beacon Power “Frequency Regulation and Flywheels”<br />
http://www.beaconpower.com/files/Flywheel_FR-Fact-Sheet.pdf (Accessed 08/11)<br />
Collins, P.G. and Avouris, P. (2000) “Nanotubes for Electronics” Scientific American<br />
Hartikainen, T., Mikkonen, R. and Lehtonen, J. (2007) “Environmental Advantages of<br />
Superconducting Devices in Distrubitued Electricity-Generation” Applied Energy, Vol. 84 (1)<br />
pp. 29-38<br />
EFDA JET (2001) “Flywheel Generators” EDFA JET, Oxfordshire UK<br />
http://www.jet.efda.org/focus-on/jets-flywheels/flywheel-generators/ (Accessed 08/11)<br />
Materials for Energy Storage Systems 35 © <strong>Granta</strong> <strong>Design</strong>, Jan 2012
Flybrid Systems (2011) “Flybrid Systems Website” http://www.flybridsystems.com/<br />
(Accessed 08/11)<br />
LaMonica, M. (2008) “One megawatt of grid storage, 10 big flywheels” CNET News, Green<br />
Tech http://news.cnet.com/8301-11128_3-9968539-54.html (Accessed 08/11)<br />
Lazarewicz, M. and Judson, J. (2011) “Performance of First 20 MW Commercial Flywheel<br />
Frequency Regulation Plant” Beacon Power Corporation, CA, USA<br />
http://www.beaconpower.com/files/Beacon_Power_presentation_ESA%206_7_11_FINAL.pd<br />
f (Accessed 08/11)<br />
Peng, B. et al. (2008) “Measurements of near-ultimate strength for multiwalled carbon<br />
nanotubes and irradiation-induced crosslinking improvements” Nature Nanotechnology Vol.<br />
3, pp.626-631<br />
Racecar Engineering (2011) “Flywheel hybrid systems (KERS)” http://www.racecarengineering.com/articles/f1/flywheel-hybrid-systems-kers/<br />
(Accessed 08/11)<br />
Thermal Storage<br />
Burkhardt III, J.J., Heath, G.A., Turchi, C.S. (2011) “Life Cycle Assessment of a Parabolic<br />
Trough Concentrating Solar Power Plant and the Impacts of Key <strong>Design</strong> Alternatives”<br />
Environmental Science and Technology Vol. 45 (6) pp. 2457-2464<br />
CALMAC (2007) “Thermal Energy Storage – ICEBANK Model C Specifications and<br />
Drawings” CALMAC Manufacturing Corporation, NJ, USA<br />
http://www.calmac.com/products/icebankc_specs.asp (Accessed 08/11)<br />
The Engineering ToolBox “Heat Storage in Materials”<br />
http://www.engineeringtoolbox.com/sensible-heat-storage-d_1217.html (Accessed 08/11)<br />
Heath, G., Turchi, C., Burkhardt, J., Kutscher, C. and Decker, T. (2009) “Life Cycle<br />
Assessment of Thermal Energy Storage: Two-Tank Indirect and Thermocline” American<br />
Society of Mechanical Engineers (ASME) Third International Conference on Energy<br />
Sustainability, San Francisco<br />
Macnaghten, J. (2010) “Electricity Storage Part 3: Isentropic Electricity Storage” Isentropic<br />
Ltd, Cambridge, UK<br />
http://www.chase.org.uk/files/Isentropic%20ARM%20presentation%20(part%202).pdf<br />
(Accessed 08/11)<br />
Tamme, R. (2009) “Thermal Energy Storage for Large Scale CSP Plants” DLR – Germal<br />
Aerospace Center, Institute of Technical Thermodynamics<br />
http://www.srcf.ucam.org/cuens/img/Academic_Material/Tamme_Storage%20CSP.pdf<br />
(Accessed 08/11)<br />
Batteries<br />
Buchman, I. (2003) “Battery University” http://batteryuniversity.com/ (Accessed 08/11)<br />
Conway, E. (2003) “World’s biggest battery switched on in Alaska” The Telegraph,<br />
Technology http://www.telegraph.co.uk/technology/3312118/Worlds-biggest-batteryswitched-on-in-Alaska.html<br />
(Accessed 08/11)<br />
Denholm, P. and Kulcinski, G.L. (2004) “Life cycle energy requirements and greenhouse gas<br />
emissions from large scale energy storage systems” Energy Conversion and Management<br />
Vol. 45 (13-14) pp. 2153-2172<br />
Energizer “Technical Information” Energizer, MO, USA http://data.energizer.com/ (Accessed<br />
08/11)<br />
Materials for Energy Storage Systems 36 © <strong>Granta</strong> <strong>Design</strong>, Jan 2012
Gaines, L. and Cuenca, R. (2000) “Costs of Lithium-Ion Batteries for Vehicles” Center for<br />
Transportation Research, Argonne National Laboratory, IL USA<br />
http://www.transportation.anl.gov/pdfs/TA/149.pdf (Accessed 08/11)<br />
Gaines, L. and Nelson, P. (2010) “Lithium-Ion Batteries: Examining Material Demand and<br />
Recycling Issues” Argonne National Laboratory, IL, USA<br />
http://www.transportation.anl.gov/pdfs/B/626.PDF (Accessed 08/11)<br />
Gaines, L. and Singh, M. (1995) “Energy and Environmental Impacts of Electric Vehicle<br />
Battery Production and Recycling” Total Life Cycle Conference and Exposition, Vienna,<br />
Austria<br />
Hartikainen, T., Mikkonen, R. and Lehtonen, J. (2007) “Environmental Advantages of<br />
Superconducting Devices in Distrubitued Electricity-Generation” Applied Energy, Vol. 84 (1)<br />
pp. 29-38<br />
Haruna, H., Itoh, S., Horiba, T., Seki, E. and Kohno, K. (2011) “Large-format lithium-ion<br />
batteries for electrical power storage” Journal of Power Sources Vol. 196 (16) pp. 7002-7005<br />
HILTech Developments Limited (2005) “Vanadium Redox Flow battery – Key Features”<br />
HILTech Developments Limited, Sunderland, UK<br />
http://hiltechdevelopments.com/uploads/news/id43/vanadium_redox.pdf (Accessed 08/11)<br />
Kopera, J.J.C. (2004) “Inside the Nickel Metal Hydride Battery” Cobasys, MI, USA<br />
http://www.cobasys.com/pdf/tutorial/inside_nimh_battery_technology.pdf (Accessed 08/11)<br />
Lotspeich, C. and Van Holde, D. (2002) “Flow Batteries: Has Really Large Scale Battery<br />
Storage Come of Age” Energy Efficiency Center, University of California, CA, USA<br />
NGK Insulators, Ltd. “Principle of the NAS Battery” NGK Insulators, Ltd. Nagoya Japan<br />
http://www.ngk.co.jp/english/products/power/nas/principle/index.html (Accessed 08/11)<br />
Nicad Power (2010) “Technical Data [of Nickel Cadmium Batteries]” Nicad Power Pte Ltd.,<br />
Singapore http://www.nicadpower.com/products/technical/ (Accessed 08/11)<br />
Rydh, C.J. (1999) “Environmental assessment of vanadium redox and lead-acid batteries for<br />
stationary energy storage” Journal of Power Sources Vol. 80 (1-2) pp.21-29<br />
De-Leon, S. (2011) “Li/CFx Batteries, The Renaissance” Schmuel De-Leon Energy, Ltd.,<br />
Israel http://www.contourenergy.com/technology/presentations/sdl_presentation.pdf<br />
(Accessed 08/11)<br />
Skyllas-Kazacos, M. “An Historical Overview of the Vanadium Redox Flow Battery<br />
Development at the University of New South Wales, Autralia” School of Chemical<br />
Engineering & Industrial Chemistry, University of New South Wales, Sydney, Australia<br />
http://www.vrb.unsw.edu.au/overview.htm (Accessed 08/11)<br />
Sullivan, J.L. and Gaines, L. (2010) “A Review of Battery Life-Cycle Analysis: State of<br />
Knowledge and Critical Needs” Energy Systems Division, Argonne National Laboratory, IL,<br />
USA http://www.transportation.anl.gov/pdfs/B/644.PDF (Accessed 08/11)<br />
Wright, R. (2009) “New battery could change world, one house at a time” Daily Herald<br />
http://www.heraldextra.com/news/article_b0372fd8-3f3c-11de-ac77-001cc4c002e0.html<br />
(Accessed 08/11)<br />
Zackrisson, M., Avellán, L. and Orlenius, J. (2010) “Life cycle assessment of lithium-ion<br />
batteries for plug-in hybrid electric vehicles - Critical issues” Journal of Cleaner Production<br />
Vol. 18 (15) pp.1519-1529<br />
Zelinsky, M., Koch, J., Fetcenko, M. (2010) “Heat Tolerant NiMH Batteries for Stationary<br />
Power” Ovonic Battery Company, MI, USA<br />
Materials for Energy Storage Systems 37 © <strong>Granta</strong> <strong>Design</strong>, Jan 2012
Hydrogen Energy Storage<br />
Granovskii, M., Dincer, I., Rosen, M.A. (2006) “Life cycle assessment of hydrogen fuel cell<br />
and gasoline vehicles” International Journal of Hydrogen Energy Vol. 31 (3) pp. 337-352<br />
Hydrogenics (2010a) “Fuel Cell Power Systems based on PEM technology”<br />
http://www.hydrogenics.com/fuel/ (Accessed 08/11).<br />
Hydrogenics (2010b) “Hydrogen Generators based on water electrolysis”<br />
http://www.hydrogenics.com/hydro/ (Accessed 08/11)<br />
Nadal, G. (1997) “Life Cycle Air Emissions from Fuel Cells and Gas Turbines in Power<br />
Generation” London: Imperial College of Science, Technology and Medicine, London UK<br />
http://www3.imperial.ac.uk/portal/pls/portallive/docs/1/7294736.PDF (Accessed 08/11)<br />
US Department of Energy (2011) “DOE Targets for Onboard Hydrogen Storage Systems for<br />
Light-Duty Vehicles”<br />
http://www1.eere.energy.gov/hydrogenandfuelcells/storage/current_technology.html<br />
(Accessed 07/11)<br />
van Rooijen, J. (2006) “A Life Cycle Assessment of the PureCell(TM) Stationary Fuel Cell<br />
System: Providing a Guide for Environmental Improvement” Center for Sustainable Systems,<br />
University of Michigan http://css.snre.umich.edu/css_doc/CSS06-08.pdf (Accessed 07/11)<br />
Capacitors<br />
Kim, I.H., Ma, S.B., Kim, K.B. “Super-capacitor” Lab. Of Energy Conversion & Storage<br />
Materials, Yonsei University, Seoul, Korea<br />
http://web.yonsei.ac.kr/echemlab/public_html/data/sucap.pdf (Accessed 08/11)<br />
Maxwell Technologies, Inc. (2009) “Product Guide - Maxwell Technologies BOOSTCAP<br />
Ultra-capacitors” http://about.maxwell.com/pdf/1014627_BOOSTCAP_Product_Guide.pdf<br />
(Accessed 08/11)<br />
Maxwell Technologies, Inc. (2011) “Production Information Sheet #1004596.3”<br />
http://about.maxwell.com/ultracapacitors/products/pis.asp (Accessed 08/11)<br />
Superconducting Magnetic Energy Storage<br />
ClimateTechWiki “Energy Storage: Superconducting magnetic energy storage (SMES)”<br />
http://climatetechwiki.org/technology/jiqweb-ee (Accessed 08/11)<br />
Hartikainen, T., Mikkonen, R. and Lehtonen, J. (2007) “Environmental Advantages of<br />
Superconducting Devices in Distributed Electricity-Generation” Applied Energy, Vol. 84 (1)<br />
pp. 29-38.<br />
Schnyder, G. and Sjöström, M. (2005) “SMES” École Polytechnique Fédérale de Lausanne,<br />
Switzerland<br />
http://lanoswww.epfl.ch/studinfo/courses/cours_supra/smes/Report_18%20SMES.pdf<br />
(Accessed 08/11)<br />
Materials for Energy Storage Systems 38 © <strong>Granta</strong> <strong>Design</strong>, Jan 2012