Comparison of irrigation performance based on management and ...
Comparison of irrigation performance based on management and ...
Comparison of irrigation performance based on management and ...

You also want an ePaper? Increase the reach of your titles
YUMPU automatically turns print PDFs into web optimized ePapers that Google loves.
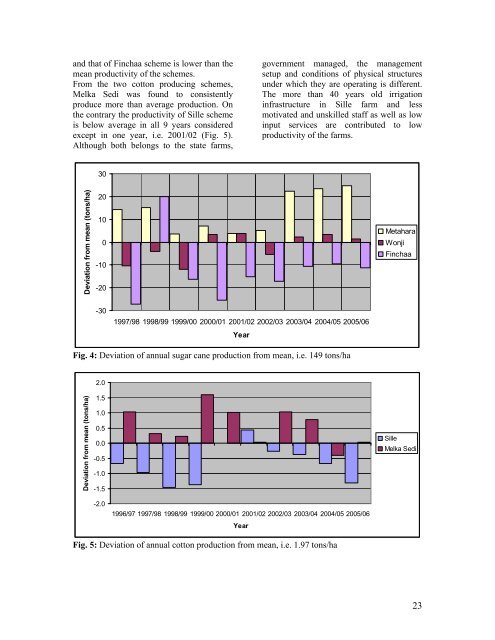
<strong>and</strong> that <str<strong>on</strong>g>of</str<strong>on</strong>g> Finchaa scheme is lower than the<br />
mean productivity <str<strong>on</strong>g>of</str<strong>on</strong>g> the schemes.<br />
From the two cott<strong>on</strong> producing schemes,<br />
Melka Sedi was found to c<strong>on</strong>sistently<br />
produce more than average producti<strong>on</strong>. On<br />
the c<strong>on</strong>trary the productivity <str<strong>on</strong>g>of</str<strong>on</strong>g> Sille scheme<br />
is below average in all 9 years c<strong>on</strong>sidered<br />
except in <strong>on</strong>e year, i.e. 2001/02 (Fig. 5).<br />
Although both bel<strong>on</strong>gs to the state farms,<br />
government managed, the <strong>management</strong><br />
setup <strong>and</strong> c<strong>on</strong>diti<strong>on</strong>s <str<strong>on</strong>g>of</str<strong>on</strong>g> physical structures<br />
under which they are operating is different.<br />
The more than 40 years old <str<strong>on</strong>g>irrigati<strong>on</strong></str<strong>on</strong>g><br />
infrastructure in Sille farm <strong>and</strong> less<br />
motivated <strong>and</strong> unskilled staff as well as low<br />
input services are c<strong>on</strong>tributed to low<br />
productivity <str<strong>on</strong>g>of</str<strong>on</strong>g> the farms.<br />
30<br />
Deviati<strong>on</strong> from mean (t<strong>on</strong>s/ha)<br />
20<br />
10<br />
0<br />
-10<br />
-20<br />
Metahara<br />
W<strong>on</strong>ji<br />
Finchaa<br />
-30<br />
1997/98 1998/99 1999/00 2000/01 2001/02 2002/03 2003/04 2004/05 2005/06<br />
Year<br />
Fig. 4: Deviati<strong>on</strong> <str<strong>on</strong>g>of</str<strong>on</strong>g> annual sugar cane producti<strong>on</strong> from mean, i.e. 149 t<strong>on</strong>s/ha<br />
2.0<br />
Deviati<strong>on</strong> from mean (t<strong>on</strong>s/ha)<br />
1.5<br />
1.0<br />
0.5<br />
0.0<br />
-0.5<br />
-1.0<br />
-1.5<br />
Sille<br />
Melka Sedi<br />
-2.0<br />
1996/97 1997/98 1998/99 1999/00 2000/01 2001/02 2002/03 2003/04 2004/05 2005/06<br />
Year<br />
Fig. 5: Deviati<strong>on</strong> <str<strong>on</strong>g>of</str<strong>on</strong>g> annual cott<strong>on</strong> producti<strong>on</strong> from mean, i.e. 1.97 t<strong>on</strong>s/ha<br />
23