Data Replication in Data Intensive Scientific Applications - CiteSeerX
Data Replication in Data Intensive Scientific Applications - CiteSeerX
Data Replication in Data Intensive Scientific Applications - CiteSeerX

Create successful ePaper yourself
Turn your PDF publications into a flip-book with our unique Google optimized e-Paper software.
12<br />
Average file access time (second)<br />
500000<br />
400000<br />
300000<br />
200000<br />
100000<br />
Ditributed <strong>in</strong> Random<br />
Cascad<strong>in</strong>g <strong>in</strong> Random<br />
Distributed <strong>in</strong> TS-Static<br />
Cascad<strong>in</strong>g <strong>in</strong> TS-Static<br />
Distributed <strong>in</strong> TS-Dynamic<br />
Cascad<strong>in</strong>g <strong>in</strong> TS-Dynamic<br />
Average file access time (second)<br />
700000<br />
600000<br />
500000<br />
400000<br />
300000<br />
200000<br />
100000<br />
Ditributed <strong>in</strong> Random<br />
Cascad<strong>in</strong>g <strong>in</strong> Random<br />
Distributed <strong>in</strong> TS-Static<br />
Cascad<strong>in</strong>g <strong>in</strong> TS-Static<br />
Distributed <strong>in</strong> TS-Dynamic<br />
Cascad<strong>in</strong>g <strong>in</strong> TS-Dynamic<br />
0<br />
1000 50000 200000 400000 600000 8000001000000<br />
Total number of files<br />
0<br />
1 50 100 200 400 600 800 1000<br />
Storage Capacity (GB)<br />
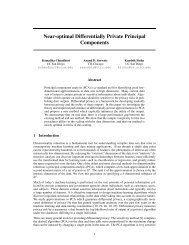
(a) Vary<strong>in</strong>g total number of files.<br />
(b) Vary<strong>in</strong>g storage capacity of each node.<br />
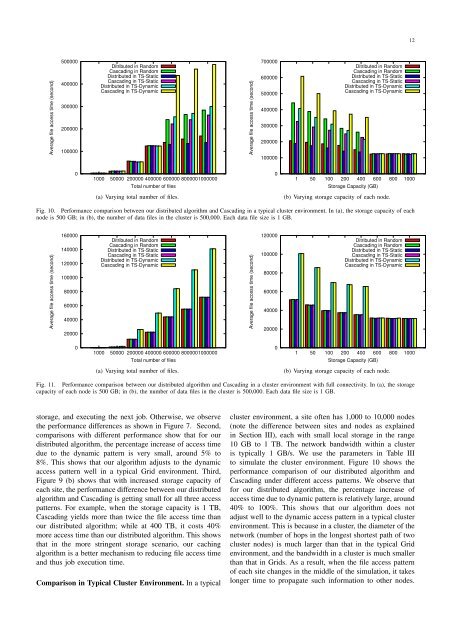
Fig. 10. Performance comparison between our distributed algorithm and Cascad<strong>in</strong>g <strong>in</strong> a typical cluster environment. In (a), the storage capacity of each<br />
node is 500 GB; <strong>in</strong> (b), the number of data files <strong>in</strong> the cluster is 500,000. Each data file size is 1 GB.<br />
Average file access time (second)<br />
160000<br />
140000<br />
120000<br />
100000<br />
80000<br />
60000<br />
40000<br />
20000<br />
Ditributed <strong>in</strong> Random<br />
Cascad<strong>in</strong>g <strong>in</strong> Random<br />
Distributed <strong>in</strong> TS-Static<br />
Cascad<strong>in</strong>g <strong>in</strong> TS-Static<br />
Distributed <strong>in</strong> TS-Dynamic<br />
Cascad<strong>in</strong>g <strong>in</strong> TS-Dynamic<br />
Average file access time (second)<br />
120000<br />
100000<br />
80000<br />
60000<br />
40000<br />
20000<br />
Ditributed <strong>in</strong> Random<br />
Cascad<strong>in</strong>g <strong>in</strong> Random<br />
Distributed <strong>in</strong> TS-Static<br />
Cascad<strong>in</strong>g <strong>in</strong> TS-Static<br />
Distributed <strong>in</strong> TS-Dynamic<br />
Cascad<strong>in</strong>g <strong>in</strong> TS-Dynamic<br />
0<br />
1000 50000 200000 400000 600000 8000001000000<br />
Total number of files<br />
0<br />
1 50 100 200 400 600 800 1000<br />
Storage Capacity (GB)<br />
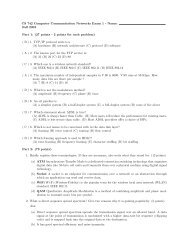
(a) Vary<strong>in</strong>g total number of files.<br />
(b) Vary<strong>in</strong>g storage capacity of each node.<br />
Fig. 11. Performance comparison between our distributed algorithm and Cascad<strong>in</strong>g <strong>in</strong> a cluster environment with full connectivity. In (a), the storage<br />
capacity of each node is 500 GB; <strong>in</strong> (b), the number of data files <strong>in</strong> the cluster is 500,000. Each data file size is 1 GB.<br />
storage, and execut<strong>in</strong>g the next job. Otherwise, we observe<br />
the performance differences as shown <strong>in</strong> Figure 7. Second,<br />
comparisons with different performance show that for our<br />
distributed algorithm, the percentage <strong>in</strong>crease of access time<br />
due to the dynamic pattern is very small, around 5% to<br />
8%. This shows that our algorithm adjusts to the dynamic<br />
access pattern well <strong>in</strong> a typical Grid environment. Third,<br />
Figure 9 (b) shows that with <strong>in</strong>creased storage capacity of<br />
each site, the performance difference between our distributed<br />
algorithm and Cascad<strong>in</strong>g is gett<strong>in</strong>g small for all three access<br />
patterns. For example, when the storage capacity is 1 TB,<br />
Cascad<strong>in</strong>g yields more than twice the file access time than<br />
our distributed algorithm; while at 400 TB, it costs 40%<br />
more access time than our distributed algorithm. This shows<br />
that <strong>in</strong> the more str<strong>in</strong>gent storage scenario, our cach<strong>in</strong>g<br />
algorithm is a better mechanism to reduc<strong>in</strong>g file access time<br />
and thus job execution time.<br />
Comparison <strong>in</strong> Typical Cluster Environment. In a typical<br />
cluster environment, a site often has 1,000 to 10,000 nodes<br />
(note the difference between sites and nodes as expla<strong>in</strong>ed<br />
<strong>in</strong> Section III), each with small local storage <strong>in</strong> the range<br />
10 GB to 1 TB. The network bandwidth with<strong>in</strong> a cluster<br />
is typically 1 GB/s. We use the parameters <strong>in</strong> Table III<br />
to simulate the cluster environment. Figure 10 shows the<br />
performance comparison of our distributed algorithm and<br />
Cascad<strong>in</strong>g under different access patterns. We observe that<br />
for our distributed algorithm, the percentage <strong>in</strong>crease of<br />
access time due to dynamic pattern is relatively large, around<br />
40% to 100%. This shows that our algorithm does not<br />
adjust well to the dynamic access pattern <strong>in</strong> a typical cluster<br />
environment. This is because <strong>in</strong> a cluster, the diameter of the<br />
network (number of hops <strong>in</strong> the longest shortest path of two<br />
cluster nodes) is much larger than that <strong>in</strong> the typical Grid<br />
environment, and the bandwidth <strong>in</strong> a cluster is much smaller<br />
than that <strong>in</strong> Grids. As a result, when the file access pattern<br />
of each site changes <strong>in</strong> the middle of the simulation, it takes<br />
longer time to propagate such <strong>in</strong>formation to other nodes.