Annual report 2012-2013 - Grasim
Annual report 2012-2013 - Grasim
Annual report 2012-2013 - Grasim

Create successful ePaper yourself
Turn your PDF publications into a flip-book with our unique Google optimized e-Paper software.
NOTES FORMING PART OF THE<br />
FINANCIAL STATEMENTS<br />
<strong>Grasim</strong> Industries Limited - <strong>Annual</strong> Report <strong>2012</strong>-<strong>2013</strong><br />
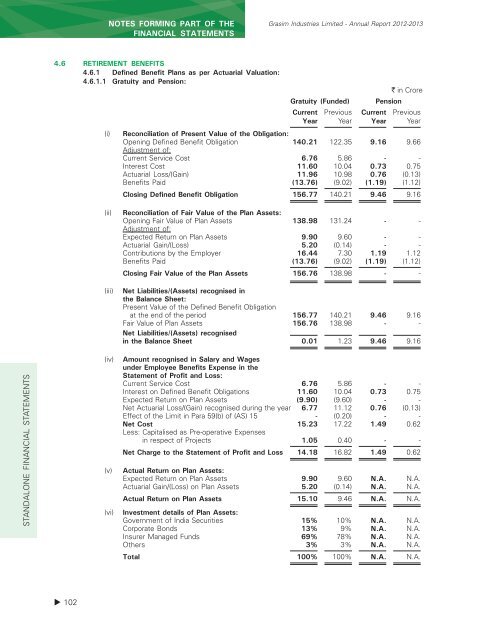
4.6 RETIREMENT BENEFITS<br />
4.6.1 Defined Benefit Plans as per Actuarial Valuation:<br />
4.6.1.1 Gratuity and Pension:<br />
(i)<br />
` in Crore<br />
Gratuity (Funded) Pension<br />
Current Previous Current Previous<br />
Year Year Year Year<br />
Reconciliation of Present Value of the Obligation:<br />
Opening Defined Benefit Obligation 140.21 122.35 9.16 9.66<br />
Adjustment of:<br />
Current Service Cost 6.76 5.86 - -<br />
Interest Cost 11.60 10.04 0.73 0.75<br />
Actuarial Loss/(Gain) 11.96 10.98 0.76 (0.13)<br />
Benefits Paid (13.76) (9.02) (1.19) (1.12)<br />
Closing Defined Benefit Obligation 156.77 140.21 9.46 9.16<br />
(ii)<br />
(iii)<br />
Reconciliation of Fair Value of the Plan Assets:<br />
Opening Fair Value of Plan Assets 138.98 131.24 - -<br />
Adjustment of:<br />
Expected Return on Plan Assets 9.90 9.60 - -<br />
Actuarial Gain/(Loss) 5.20 (0.14) - -<br />
Contributions by the Employer 16.44 7.30 1.19 1.12<br />
Benefits Paid (13.76) (9.02) (1.19) (1.12)<br />
Closing Fair Value of the Plan Assets 156.76 138.98 - -<br />
Net Liabilities/(Assets) recognised in<br />
the Balance Sheet:<br />
Present Value of the Defined Benefit Obligation<br />
at the end of the period 156.77 140.21 9.46 9.16<br />
Fair Value of Plan Assets 156.76 138.98 - -<br />
Net Liabilities/(Assets) recognised<br />
in the Balance Sheet 0.01 1.23 9.46 9.16<br />
STANDALONE FINANCIAL STATEMENTS<br />
(iv)<br />
(v)<br />
(vi)<br />
Amount recognised in Salary and Wages<br />
under Employee Benefits Expense in the<br />
Statement of Profit and Loss:<br />
Current Service Cost 6.76 5.86 - -<br />
Interest on Defined Benefit Obligations 11.60 10.04 0.73 0.75<br />
Expected Return on Plan Assets (9.90) (9.60) - -<br />
Net Actuarial Loss/(Gain) recognised during the year 6.77 11.12 0.76 (0.13)<br />
Effect of the Limit in Para 59(b) of (AS) 15 - (0.20) - -<br />
Net Cost 15.23 17.22 1.49 0.62<br />
Less: Capitalised as Pre-operative Expenses<br />
Less: in respect of Projects 1.05 0.40 - -<br />
Net Charge to the Statement of Profit and Loss 14.18 16.82 1.49 0.62<br />
Actual Return on Plan Assets:<br />
Expected Return on Plan Assets 9.90 9.60 N.A. N.A.<br />
Actuarial Gain/(Loss) on Plan Assets 5.20 (0.14) N.A. N.A.<br />
Actual Return on Plan Assets 15.10 9.46 N.A. N.A.<br />
Investment details of Plan Assets:<br />
Government of India Securities 15% 10% N.A. N.A.<br />
Corporate Bonds 13% 9% N.A. N.A.<br />
Insurer Managed Funds 69% 78% N.A. N.A.<br />
Others 3% 3% N.A. N.A.<br />
Total 100% 100% N.A. N.A.<br />
102