Annual report 2012-2013 - Grasim
Annual report 2012-2013 - Grasim
Annual report 2012-2013 - Grasim

You also want an ePaper? Increase the reach of your titles
YUMPU automatically turns print PDFs into web optimized ePapers that Google loves.
NOTES FORMING PART OF THE<br />
FINANCIAL STATEMENTS<br />
<strong>Grasim</strong> Industries Limited - <strong>Annual</strong> Report <strong>2012</strong>-<strong>2013</strong><br />
` in Crore<br />
Current Previous<br />
Year<br />
Year<br />
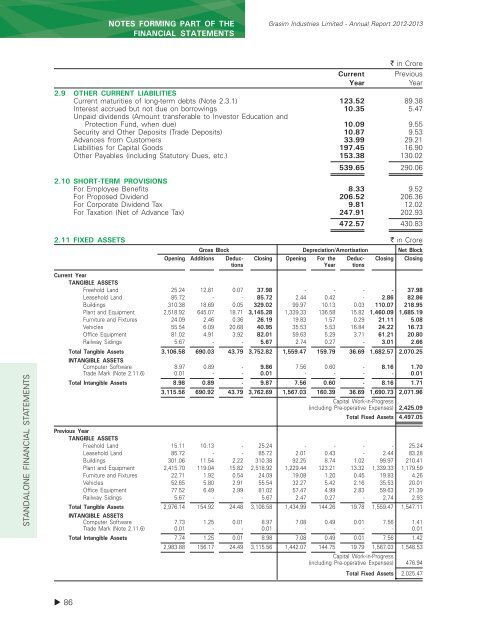
2.9 OTHER CURRENT LIABILITIES<br />
Current maturities of long-term debts (Note 2.3.1) 123.52 89.38<br />
Interest accrued but not due on borrowings 10.35 5.47<br />
Unpaid dividends (Amount transferable to Investor Education and<br />
Protection Fund, when due) 10.09 9.55<br />
Security and Other Deposits (Trade Deposits) 10.87 9.53<br />
Advances from Customers 33.99 29.21<br />
Liabilities for Capital Goods 197.45 16.90<br />
Other Payables (including Statutory Dues, etc.) 153.38 130.02<br />
539.65 290.06<br />
2.10 SHORT-TERM PROVISIONS<br />
For Employee Benefits 8.33 9.52<br />
For Proposed Dividend 206.52 206.36<br />
For Corporate Dividend Tax 9.81 12.02<br />
For Taxation (Net of Advance Tax) 247.91 202.93<br />
472.57 430.83<br />
STANDALONE FINANCIAL STATEMENTS<br />
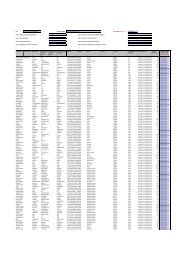
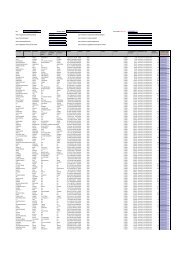
2.11 FIXED ASSETS ` in Crore<br />
Gross Block Depreciation/Amortisation Net Block<br />
Opening Additions Deduc- Closing Opening For the Deduc- Closing Closing<br />
tions Year tions<br />
Current Year<br />
TANGIBLE ASSETS<br />
Freehold Land 25.24 12.81 0.07 37.98 - - - - 37.98<br />
Leasehold Land 85.72 - - 85.72 2.44 0.42 - 2.86 82.86<br />
Buildings 310.38 18.69 0.05 329.02 99.97 10.13 0.03 110.07 218.95<br />
Plant and Equipment 2,518.92 645.07 18.71 3,145.28 1,339.33 136.58 15.82 1,460.09 1,685.19<br />
Furniture and Fixtures 24.09 2.46 0.36 26.19 19.83 1.57 0.29 21.11 5.08<br />
Vehicles 55.54 6.09 20.68 40.95 35.53 5.53 16.84 24.22 16.73<br />
Office Equipment 81.02 4.91 3.92 82.01 59.63 5.29 3.71 61.21 20.80<br />
Railway Sidings 5.67 - - 5.67 2.74 0.27 - 3.01 2.66<br />
Total Tangible Assets 3,106.58 690.03 43.79 3,752.82 1,559.47 159.79 36.69 1,682.57 2,070.25<br />
INTANGIBLE ASSETS<br />
Computer Software 8.97 0.89 - 9.86 7.56 0.60 - 8.16 1.70<br />
Trade Mark (Note 2.11.6) 0.01 - - 0.01 - - - - 0.01<br />
Total Intangible Assets 8.98 0.89 - 9.87 7.56 0.60 - 8.16 1.71<br />
3,115.56 690.92 43.79 3,762.69 1,567.03 160.39 36.69 1,690.73 2,071.96<br />
Capital Work-in-Progress<br />
(including Pre-operative Expenses) 2,425.09<br />
Total Fixed Assets 4,497.05<br />
Previous Year<br />
TANGIBLE ASSETS<br />
Freehold Land 15.11 10.13 - 25.24 - - - - 25.24<br />
Leasehold Land 85.72 - - 85.72 2.01 0.43 - 2.44 83.28<br />
Buildings 301.06 11.54 2.22 310.38 92.25 8.74 1.02 99.97 210.41<br />
Plant and Equipment 2,415.70 119.04 15.82 2,518.92 1,229.44 123.21 13.32 1,339.33 1,179.59<br />
Furniture and Fixtures 22.71 1.92 0.54 24.09 19.08 1.20 0.45 19.83 4.26<br />
Vehicles 52.65 5.80 2.91 55.54 32.27 5.42 2.16 35.53 20.01<br />
Office Equipment 77.52 6.49 2.99 81.02 57.47 4.99 2.83 59.63 21.39<br />
Railway Sidings 5.67 - - 5.67 2.47 0.27 - 2.74 2.93<br />
Total Tangible Assets 2,976.14 154.92 24.48 3,106.58 1,434.99 144.26 19.78 1,559.47 1,547.11<br />
INTANGIBLE ASSETS<br />
Computer Software 7.73 1.25 0.01 8.97 7.08 0.49 0.01 7.56 1.41<br />
Trade Mark (Note 2.11.6) 0.01 - - 0.01 - - - - 0.01<br />
Total Intangible Assets 7.74 1.25 0.01 8.98 7.08 0.49 0.01 7.56 1.42<br />
2,983.88 156.17 24.49 3,115.56 1,442.07 144.75 19.79 1,567.03 1,548.53<br />
Capital Work-in-Progress<br />
(including Pre-operative Expenses) 476.94<br />
Total Fixed Assets 2,025.47<br />
86