paper - ForOT Optical Turbulence Forecasts
paper - ForOT Optical Turbulence Forecasts
paper - ForOT Optical Turbulence Forecasts

You also want an ePaper? Increase the reach of your titles
YUMPU automatically turns print PDFs into web optimized ePapers that Google loves.
Title : will be set by the publisher<br />
Editors : will be set by the publisher<br />
EAS Publications Series, Vol. , 2007<br />
A DIFFERENT GLANCE TO THE SITE TESTING ABOVE<br />
DOME C<br />
Elena Masciadri 1 , Franck Lascaux 1 , Jeffrey Stoesz 1 , Susanna Hagelin 1<br />
and Kerstin Geissler 2<br />
Abstract. Due to the recent interest shown by astronomers towards the<br />
Antarctic Plateau as a potential site for large astronomical facilities,<br />
we assisted in the last years to a strengthening of site testing activities<br />
in this region, particularly at Dome C. Most of the results collected<br />
so far concern meteorologic parameters and optical turbulence measurements<br />
based on different principles using different instruments. At<br />
present we have several elements indicating that, above the first 20-30<br />
meters, the quality of the optical turbulence above Dome C is better<br />
than above whatever other site in the world. The challenging question,<br />
crucial to know which kind of facilities to build on, is to establish how<br />
much better the Dome C is than a mid-latitude site. In this contribution<br />
we will provide some complementary elements and strategies of<br />
analysis aiming to answer to this question. We will try to concentrate<br />
the attention on critical points, i.e. open questions that still require<br />
explanation/attention.<br />
1 Introduction<br />
Most of the site testing done so far above Dome C has been carried out with measurements<br />
taken with different instruments and based on different techniques. Our<br />
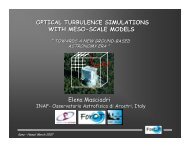
approach to the site testing in this context is different. We intend to estimate the<br />
optical turbulence (CN 2 ) with the employment of atmospherical models at mesoscale,<br />
more precisely we plan to use the Meso-Nh model (Masciadri & Jabouille<br />
2001, Masciadri, Avila & Sanchez 2004 , Masciadri & Egner 2006). This approach<br />
provides the possibility to reconstruct 3D CN<br />
2 maps (not only vertical profiles)<br />
and to forecast the optical turbulence. The flexible scheduling and optimization<br />
of scientific observational programs for new class of ground-based telescopes pass<br />
1 INAF-Osservatorio Astrofisico di Arcetri, Firenze, Italy; e-mail: masciadri@arcetri.astro.it<br />
2 European Southern Observatory, Alonso de Cordova 3107, Santiago, Chile<br />
c○ EDP Sciences 2007<br />
DOI: (will be inserted later)
2 Title : will be set by the publisher<br />
necessarily by the forecast of the optical turbulence; this topic is therefore strictly<br />
correlated to the success and the survival of the ground-based astronomy of next<br />
decades. We recently set-up a research group at the Osservatorio Astrofisico di<br />
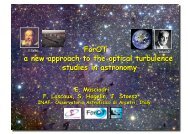
Arcetri (Florence) 1 whose aim is to carry out a project (FOROT) centered on the<br />
characterization and forecast of the <strong>Optical</strong> <strong>Turbulence</strong>. The core project includes<br />
the study of two sites: the Mt. Graham, site of the Large Binocular Telescope<br />
(LBT) and the Internal Antarctic Plateau (Dome C, South Pole and Dome A).<br />
The final goal of our work is to employ this technique to other sites in the world<br />
mainly for application to the ELTs. The orographic maps of the Internal Antarctic<br />
Plateau, as reconstructed by the Meso-Nh model, is shown in Fig.1. Simulations<br />
will be carried out with different horizontal resolution depending on site and scientific<br />
goals that we intend to reach.<br />
Why Antarctica <br />
• Because the whole International Community showed great interest with respect<br />
to this site.<br />
• Because several site testing campaigns are on-going and this means that a<br />
large number of measurements will be soon available. This means a possibility<br />
to constrain models outputs.<br />
• Because we will have the possibility to answer to critical scientific questions<br />
among those: (1) ability of meso-scale models in discriminating between<br />
sites located on the same plateau but characterized by different turbulence<br />
features, (2) characterization of an uncontaminated site such as Dome A, (3)<br />
ability of meso-scale models in forecasting the optical turbulence.<br />
2 Challenges at Dome C<br />
We can summarize the promising potentialities of Dome C for future Astronomy<br />
in this Antarctic Continent with the following statement: at Dome C, above<br />
20-30 m the quality of the atmosphere is better than above whatever<br />
other site at mid-latitude. What does it mean Above a good mid-latitude<br />
site, the free atmosphere seeing ε FA (by definition for h ≥ 1 km) is typically<br />
larger than 0.4 arcsec. Above Dome C, the free atmosphere seeing is ≤ 0.4 arcsec<br />
and the thickness of the boundary layer is as thin as a few tens of meters (∼ 30<br />
m). An exact estimate of such a thickness is obviously important but we would<br />
like to highlight that it has been shown (Ragazzoni et al. 2004) that, using 2 DMs<br />
opportunely conjugated in the low part of the atmosphere, it is possible to correct<br />
the first 200 m reaching 15 arcmin FOV with reasonable good Strehl Ratio. This<br />
already does of Dome C an extremely interesting site. The residual turbulence in<br />
the free atmosphere, that is not corrected with the system described by Ragazzoni<br />
1 http : //forot.arcetri.astro.it
Give a shorter title using \runningtitle 3<br />
Fig. 1. Orographic map centred above South Pole and extended on 3000 km × 3000 km.<br />
et al. (2004), is critical to assure the predicted performances. For this reason we<br />
think that the main priority in a list of studies to be carried out, is to confirm the<br />
upper limit for ε FA measured so far. As we will explain in the next section, these<br />
results need to be confirmed.<br />
3 The different “glance”<br />
Fundamental requirement for our study is to collect as many as possible elements<br />
(included measurements) to constrain simulations. Here we list a few critical<br />
points telling us that we still need further studies in the fields of site testing and<br />
a different strategic approaches in the organization of site testing campaigns.<br />
(1) The vertical profilers: MASS, SSS and Balloons never ran contemporaneously.<br />
We can not, at present, know the dispersion between instruments. (2)<br />
Some instruments, such as the SSS, are prototypes and need careful validation.<br />
A comparison made on statistical base between measurements from SSS and another<br />
profiler taken as a reference need to be done. Results published so far only<br />
concern the comparison between one CN<br />
2 profile from SSS and balloon. (3) Measurements<br />
show discrepancies sometimes. In Agabi et al. (2006), for example, the<br />
median isoplanatic angle measured by the DIMM and the Balloons is respectively<br />
2.7 and 4.7 arcsec. This corresponds to a discrepancy of ∼ 50%. What we suspect<br />
is that most of the balloons measurements reach the height of 12 km and above<br />
this height the turbulence is not measured due to balloons explosion. As a conse-
4 Title : will be set by the publisher<br />
quence, the isoplanatic angle measured by balloons is larger than the isoplanatic<br />
angle measured by a DIMM.<br />
To supply further elements that might comply with our needs we decided to<br />
follow a different approach: to study the analyses provided by the European Center<br />
for Medium Weather <strong>Forecasts</strong> (ECMWF) General Circulation Models. These are<br />
vertical profiles of absolute and potential temperature, wind speed and direction<br />
extracted in the grid point (75 ◦ S, 123 ◦ E), horizontal resolution 0.5 ◦ , extended<br />
up to 0.1 hPa, 60 vertical levels with resolution decreasing with height. Data<br />
have been treated statistically on the 2003-2004 period at heights h ≥ 30 m. The<br />
scientific goals of this study are: (1) to provide a yearly meteorologic parameters<br />
analysis, (2) to calculate the probability to trigger optical turbulence in different<br />
slabs of atmosphere and in different periods of the year and (3) to estimate the<br />
quality of ECMWF analyses in perspective to use these data to initialise Meso-Nh.<br />
Analyses reliability has been proved in Geissler & Masciadri (2006). In that<br />
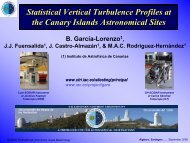
<strong>paper</strong> the main results of this study are extensively described. Figure 2 shows<br />
the median wind speed in summer and winter time above 2 sites: Dome C and<br />
San Pedro Mártir. The latter has been selected as representative of a mid-latitude<br />
site. It is possible to observe that above Dome C the wind speed is particularly<br />
weak in summer time on the whole troposphere; a peak appears at around 5 km<br />
above the ground (tropopause). In winter time the wind speed increases monotonically<br />
above 10 km above the ground reaching 30 m/sec above 20 km. Such<br />
a strong wind speed should be considered with attention for at least 2 reasons.<br />
Firstly it might trigger dynamic instabilities in the high free atmosphere, secondly<br />
it might affect the wavefront coherence time τ 0 . This parameter indeed scales as<br />
C 2 N (h) · |V (h)|5/3 , i.e. is particularly sensitive to large wind speed values.<br />
Fig.3 shows the median wind speed vertical profile in winter time (June and July)<br />
above South Pole and the median wind speed vertical profile in winter time above<br />
Dome C. Both results are retrieved by statistical estimates of ECMWF analyses.<br />
It is interesting to note that the wind speed at high altitudes is much weaker at<br />
South Pole than at Dome C.<br />
How we can connect meteorological and astroclimatic parameters The study of<br />
the Richardson number R i =R i (∂θ/∂h,∂V /∂h), parameter indicating the probability<br />
to trigger turbulence, shows (Geissler & Masciadri 2006, Fig.14) a monotonic<br />
increasing of the turbulence activity above 15 km from summer towards and across<br />
the winter time. One would expect therefore a more intense turbulence activity at<br />
high altitudes during the winter than during the summer time. The trend identified<br />
by the Richardson maps is confirmed by measurements of θ 0 obtained with<br />
the same instrument in summer and winter time. θ 0 is much larger in summer<br />
time (6.8 arcsec - Aristidi et al. (2005)) than in winter time (2.7 arcsec - Agabi<br />
et al. (2006)). This means that turbulence at high altitudes is weaker in summer<br />
than in winter time. We should therefore increase the statistic of measurements<br />
in August, September and October to better characterize this phenomenon.<br />
A further result related to the seeing in the free atmosphere (ε FA ) requiring
Give a shorter title using \runningtitle 5<br />
Fig. 2. Comparison between the median wind speed profile estimated during the winter<br />
time (full bold line) and summer time (dashed line line) (2003) above Dome C and the<br />
median wind speed profile estimated above the San Pedro Mártir Observatory in summer<br />
(dotted line) and winter (full thin line) time. San Pedro Mártir is taken as representative<br />
of a mid-latitude site.<br />
Fig. 3. ECMWF analyeses estimates. Left: median wind speed vertical profile in winter<br />
time (June and July) above South Pole (dotted line). Right: median wind speed vertical<br />
profile in winter time above Dome C (dotted lines are first and third quartiles). See<br />
Geissler & Masciadri (2006) for further details.<br />
attention and careful verification is the following. We can retrieve from the Fig.5<br />
(Agabi et al. 2006) that seeing measured by a DIMM placed at 20 m above the<br />
ground grows in a monotonic way reaching values greater than 1 arcsec in August.<br />
Where this turbulence come from if the seeing above 30 m has been estimated not<br />
greater than 0.4 arcsec during the winter time One could think that this is the<br />
contribution associated to the thin layer between 20 and 30 m. If we look at the<br />
typical C 2 N values at 20-30 meters (10−14 ≤ C 2 N ≤ 5 × 10⁻¹⁴ ) (Fig.3, Agabi et<br />
al. 2006), we calculate the correspondent seeing in the 20-30 m slab and we finally
6 Title : will be set by the publisher<br />
subtract 2 the result from the seeing reported in Fig.5, we find a seeing in the range<br />
0.45 - 0.92 arcsec (at h ≥ 30 m). We therefore obtain a seeing above 30 m that<br />
is greater than the 0.4 arcsec indicated by preliminary results. This exhorts us in<br />
pushing on further studies of seeing in this region of the atmosphere.<br />
4 Conclusion<br />
We summarize the main points discussed in this contribution: (1) We indicated<br />
an alternative method (ECMWF analyses) to check measurements, to constrain<br />
simulations and characterize climatology above Dome C. (2) Further optical turbulence<br />
measurements are necessary to carry out all scientific programs related<br />
to site testing. However it would be suitable that future site testing campaigns<br />
are planned conjointly with all teams working on site testing taking into account<br />
requirements of all scientific programs. This is the only way to maximize the<br />
scientific outputs of activities supported by an international logistic (IPEV and<br />
PNRA) and funded by national and international structures such as the EC. (3)<br />
We recommend to run the SSS in contemporary way to the DIMM (N ◦ 1) adapted<br />
to isoplanatic angle measurements placed at the same height than SSS (8 m) and<br />
to the DIMM (N ◦ 2) placed at 20 m. It would be fundamental to collect a large<br />
statistic employing this instruments configuration. In this way we will have 3 independent<br />
ways to measure the free atmosphere and it will be able to cross-correlate<br />
results in this particular critical region of the atmosphere. This approach is particularly<br />
important for the FOROT activities and also, as explained in Section 2,<br />
to design the future of Astronomy at Dome C.<br />
5 Acknowledgments<br />
This work has been funded by the Marie Curie Excellence Grant (FOROT) -<br />
MEXT-CT-2005-023878<br />
References<br />
Aristidi, E., Agabi, K., Fossat, E., Azouit, M., Martin, F., Sadibekova, T., Travouillon,<br />
T., Vernin, J., Ziad, A. 2005c, A&A, 444, 2, 651<br />
Agabi, K., Aristidi, E., Azouit, M., Fossat, E., Martin, F., Sadibekova, T., Vernin, J.,<br />
Ziad, A. 2006, PASP, 118, 344<br />
Geissler, K. & Masciadri, E. 2006, PASP, 118, 845, 1048<br />
Masciadri & Jabouille, 2001, A&A, 2001, 376, 727<br />
Masciadri, E., Avila, R., Sanchez, L., 2006, RMxAA, 40, 3<br />
Masciadri, E. & Egner, S., 2006, PASP, 118, 848, 1604<br />
Ragazzoni et al. 2004, 16 April 2004 - Workshop at LUAN, Nice, France<br />
2 The seeing subtraction is done following the (∑ (ε i ) 5/3) 3/5 rule.