Income Diversification and Poverty Income Diversification and Poverty
Income Diversification and Poverty Income Diversification and Poverty
Income Diversification and Poverty Income Diversification and Poverty

You also want an ePaper? Increase the reach of your titles
YUMPU automatically turns print PDFs into web optimized ePapers that Google loves.
Chapter 5: <strong>Income</strong> <strong>Diversification</strong> from the Farmers’ Perspective<br />
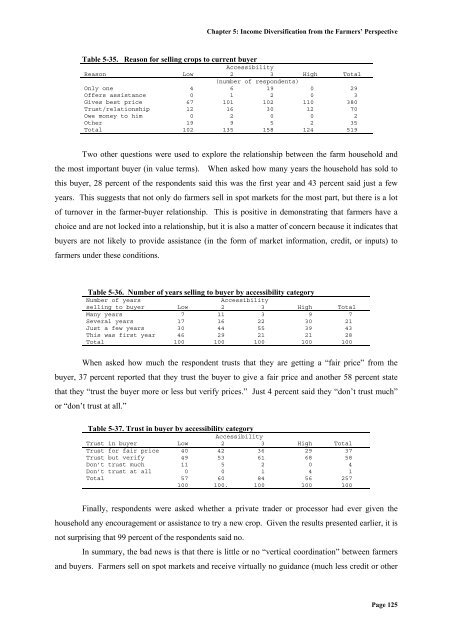
Table 5-35. Reason for selling crops to current buyer<br />
Accessibility<br />
Reason Low 2 3 High Total<br />
(number of respondents)<br />
Only one 4 6 19 0 29<br />
Offers assistance 0 1 2 0 3<br />
Gives best price 67 101 102 110 380<br />
Trust/relationship 12 16 30 12 70<br />
Owe money to him 0 2 0 0 2<br />
Other 19 9 5 2 35<br />
Total 102 135 158 124 519<br />
Two other questions were used to explore the relationship between the farm household <strong>and</strong><br />
the most important buyer (in value terms). When asked how many years the household has sold to<br />
this buyer, 28 percent of the respondents said this was the first year <strong>and</strong> 43 percent said just a few<br />
years. This suggests that not only do farmers sell in spot markets for the most part, but there is a lot<br />
of turnover in the farmer-buyer relationship. This is positive in demonstrating that farmers have a<br />
choice <strong>and</strong> are not locked into a relationship, but it is also a matter of concern because it indicates that<br />
buyers are not likely to provide assistance (in the form of market information, credit, or inputs) to<br />
farmers under these conditions.<br />
Table 5-36. Number of years selling to buyer by accessibility category<br />
Number of years<br />
Accessibility<br />
selling to buyer Low 2 3 High Total<br />
Many years 7 11 3 9 7<br />
Several years 17 16 22 30 21<br />
Just a few years 30 44 55 39 43<br />
This was first year 46 29 21 21 28<br />
Total 100 100 100 100 100<br />
When asked how much the respondent trusts that they are getting a “fair price” from the<br />
buyer, 37 percent reported that they trust the buyer to give a fair price <strong>and</strong> another 58 percent state<br />
that they “trust the buyer more or less but verify prices.” Just 4 percent said they “don’t trust much”<br />
or “don’t trust at all.”<br />
Table 5-37. Trust in buyer by accessibility category<br />
Accessibility<br />
Trust in buyer Low 2 3 High Total<br />
Trust for fair price 40 42 36 29 37<br />
Trust but verify 49 53 61 68 58<br />
Don’t trust much 11 5 2 0 4<br />
Don’t trust at all 0 0 1 4 1<br />
Total 57 60 84 56 257<br />
100 100. 100 100 100<br />
Finally, respondents were asked whether a private trader or processor had ever given the<br />
household any encouragement or assistance to try a new crop. Given the results presented earlier, it is<br />
not surprising that 99 percent of the respondents said no.<br />
In summary, the bad news is that there is little or no “vertical coordination” between farmers<br />
<strong>and</strong> buyers. Farmers sell on spot markets <strong>and</strong> receive virtually no guidance (much less credit or other<br />
Page 125