Income Diversification and Poverty Income Diversification and Poverty
Income Diversification and Poverty Income Diversification and Poverty
Income Diversification and Poverty Income Diversification and Poverty

Create successful ePaper yourself
Turn your PDF publications into a flip-book with our unique Google optimized e-Paper software.
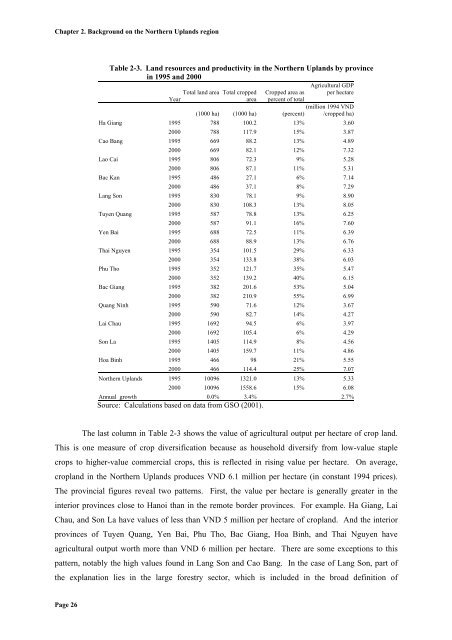
Chapter 2. Background on the Northern Upl<strong>and</strong>s region<br />
Table 2-3. L<strong>and</strong> resources <strong>and</strong> productivity in the Northern Upl<strong>and</strong>s by province<br />
in 1995 <strong>and</strong> 2000<br />
Total l<strong>and</strong> area Total cropped Cropped area as<br />
Agricultural GDP<br />
per hectare<br />
Year<br />
area percent of total<br />
(1000 ha) (1000 ha) (percent)<br />
(million 1994 VND<br />
/cropped ha)<br />
Ha Giang 1995 788 100.2 13% 3.60<br />
2000 788 117.9 15% 3.87<br />
Cao Bang 1995 669 88.2 13% 4.89<br />
2000 669 82.1 12% 7.32<br />
Lao Cai 1995 806 72.3 9% 5.28<br />
2000 806 87.1 11% 5.31<br />
Bac Kan 1995 486 27.1 6% 7.14<br />
2000 486 37.1 8% 7.29<br />
Lang Son 1995 830 78.1 9% 8.90<br />
2000 830 108.3 13% 8.05<br />
Tuyen Quang 1995 587 78.8 13% 6.25<br />
2000 587 91.1 16% 7.60<br />
Yen Bai 1995 688 72.5 11% 6.39<br />
2000 688 88.9 13% 6.76<br />
Thai Nguyen 1995 354 101.5 29% 6.33<br />
2000 354 133.8 38% 6.03<br />
Phu Tho 1995 352 121.7 35% 5.47<br />
2000 352 139.2 40% 6.15<br />
Bac Giang 1995 382 201.6 53% 5.04<br />
2000 382 210.9 55% 6.99<br />
Quang Ninh 1995 590 71.6 12% 3.67<br />
2000 590 82.7 14% 4.27<br />
Lai Chau 1995 1692 94.5 6% 3.97<br />
2000 1692 105.4 6% 4.29<br />
Son La 1995 1405 114.9 8% 4.56<br />
2000 1405 159.7 11% 4.86<br />
Hoa Binh 1995 466 98 21% 5.55<br />
2000 466 114.4 25% 7.07<br />
Northern Upl<strong>and</strong>s 1995 10096 1321.0 13% 5.33<br />
2000 10096 1558.6 15% 6.08<br />
Annual growth 0.0% 3.4% 2.7%<br />
Source: Calculations based on data from GSO (2001).<br />
The last column in Table 2-3 shows the value of agricultural output per hectare of crop l<strong>and</strong>.<br />
This is one measure of crop diversification because as household diversify from low-value staple<br />
crops to higher-value commercial crops, this is reflected in rising value per hectare. On average,<br />
cropl<strong>and</strong> in the Northern Upl<strong>and</strong>s produces VND 6.1 million per hectare (in constant 1994 prices).<br />
The provincial figures reveal two patterns. First, the value per hectare is generally greater in the<br />
interior provinces close to Hanoi than in the remote border provinces. For example. Ha Giang, Lai<br />
Chau, <strong>and</strong> Son La have values of less than VND 5 million per hectare of cropl<strong>and</strong>. And the interior<br />
provinces of Tuyen Quang, Yen Bai, Phu Tho, Bac Giang, Hoa Binh, <strong>and</strong> Thai Nguyen have<br />
agricultural output worth more than VND 6 million per hectare. There are some exceptions to this<br />
pattern, notably the high values found in Lang Son <strong>and</strong> Cao Bang. In the case of Lang Son, part of<br />
the explanation lies in the large forestry sector, which is included in the broad definition of<br />
Page 26