Income Diversification and Poverty Income Diversification and Poverty
Income Diversification and Poverty Income Diversification and Poverty
Income Diversification and Poverty Income Diversification and Poverty

You also want an ePaper? Increase the reach of your titles
YUMPU automatically turns print PDFs into web optimized ePapers that Google loves.
Chapter 2. Background on the Northern Upl<strong>and</strong>s region<br />
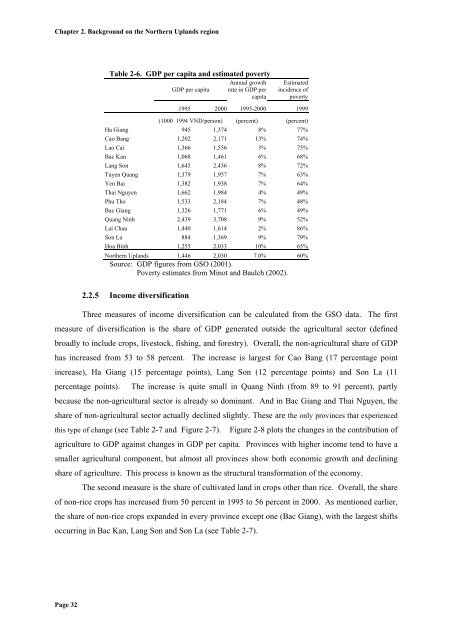
Table 2-6. GDP per capita <strong>and</strong> estimated poverty<br />
GDP per capita<br />
Annual growth<br />
rate in GDP per<br />
capita<br />
Estimated<br />
incidence of<br />
poverty<br />
1995 2000 1995-2000 1999<br />
(1000 1994 VND/person) (percent) (percent)<br />
Ha Giang 945 1,374 8% 77%<br />
Cao Bang 1,202 2,171 13% 74%<br />
Lao Cai 1,366 1,556 3% 75%<br />
Bac Kan 1,068 1,461 6% 68%<br />
Lang Son 1,645 2,436 8% 72%<br />
Tuyen Quang 1,379 1,957 7% 63%<br />
Yen Bai 1,382 1,938 7% 64%<br />
Thai Nguyen 1,662 1,984 4% 49%<br />
Phu Tho 1,533 2,184 7% 48%<br />
Bac Giang 1,326 1,771 6% 49%<br />
Quang Ninh 2,439 3,708 9% 52%<br />
Lai Chau 1,440 1,614 2% 86%<br />
Son La 884 1,369 9% 79%<br />
Hoa Binh 1,255 2,033 10% 65%<br />
Northern Upl<strong>and</strong>s 1,446 2,030 7.0% 60%<br />
Source: GDP figures from GSO (2001).<br />
<strong>Poverty</strong> estimates from Minot <strong>and</strong> Baulch (2002).<br />
2.2.5 <strong>Income</strong> diversification<br />
Three measures of income diversification can be calculated from the GSO data. The first<br />
measure of diversification is the share of GDP generated outside the agricultural sector (defined<br />
broadly to include crops, livestock, fishing, <strong>and</strong> forestry). Overall, the non-agricultural share of GDP<br />
has increased from 53 to 58 percent. The increase is largest for Cao Bang (17 percentage point<br />
increase), Ha Giang (15 percentage points), Lang Son (12 percentage points) <strong>and</strong> Son La (11<br />
percentage points). The increase is quite small in Quang Ninh (from 89 to 91 percent), partly<br />
because the non-agricultural sector is already so dominant. And in Bac Giang <strong>and</strong> Thai Nguyen, the<br />
share of non-agricultural sector actually declined slightly. These are the only provinces that experienced<br />
this type of change (see Table 2-7 <strong>and</strong> Figure 2-7). Figure 2-8 plots the changes in the contribution of<br />
agriculture to GDP against changes in GDP per capita. Provinces with higher income tend to have a<br />
smaller agricultural component, but almost all provinces show both economic growth <strong>and</strong> declining<br />
share of agriculture. This process is known as the structural transformation of the economy.<br />
The second measure is the share of cultivated l<strong>and</strong> in crops other than rice. Overall, the share<br />
of non-rice crops has increased from 50 percent in 1995 to 56 percent in 2000. As mentioned earlier,<br />
the share of non-rice crops exp<strong>and</strong>ed in every province except one (Bac Giang), with the largest shifts<br />
occurring in Bac Kan, Lang Son <strong>and</strong> Son La (see Table 2-7).<br />
Page 32