Income Diversification and Poverty Income Diversification and Poverty
Income Diversification and Poverty Income Diversification and Poverty
Income Diversification and Poverty Income Diversification and Poverty

Create successful ePaper yourself
Turn your PDF publications into a flip-book with our unique Google optimized e-Paper software.
Chapter 3. Patterns <strong>and</strong> trends in diversification<br />
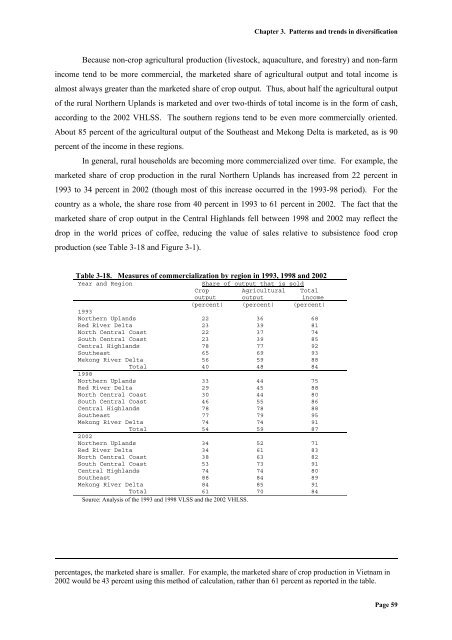
Because non-crop agricultural production (livestock, aquaculture, <strong>and</strong> forestry) <strong>and</strong> non-farm<br />
income tend to be more commercial, the marketed share of agricultural output <strong>and</strong> total income is<br />
almost always greater than the marketed share of crop output. Thus, about half the agricultural output<br />
of the rural Northern Upl<strong>and</strong>s is marketed <strong>and</strong> over two-thirds of total income is in the form of cash,<br />
according to the 2002 VHLSS. The southern regions tend to be even more commercially oriented.<br />
About 85 percent of the agricultural output of the Southeast <strong>and</strong> Mekong Delta is marketed, as is 90<br />
percent of the income in these regions.<br />
In general, rural households are becoming more commercialized over time. For example, the<br />
marketed share of crop production in the rural Northern Upl<strong>and</strong>s has increased from 22 percent in<br />
1993 to 34 percent in 2002 (though most of this increase occurred in the 1993-98 period). For the<br />
country as a whole, the share rose from 40 percent in 1993 to 61 percent in 2002. The fact that the<br />
marketed share of crop output in the Central Highl<strong>and</strong>s fell between 1998 <strong>and</strong> 2002 may reflect the<br />
drop in the world prices of coffee, reducing the value of sales relative to subsistence food crop<br />
production (see Table 3-18 <strong>and</strong> Figure 3-1).<br />
Table 3-18. Measures of commercialization by region in 1993, 1998 <strong>and</strong> 2002<br />
Year <strong>and</strong> Region<br />
Share of output that is sold<br />
Crop Agricultural Total<br />
output output income<br />
(percent) (percent) (percent)<br />
1993<br />
Northern Upl<strong>and</strong>s 22 36 68<br />
Red River Delta 23 39 81<br />
North Central Coast 22 37 74<br />
South Central Coast 23 39 85<br />
Central Highl<strong>and</strong>s 78 77 92<br />
Southeast 65 69 93<br />
Mekong River Delta 56 59 88<br />
Total 40 48 84<br />
1998<br />
Northern Upl<strong>and</strong>s 33 44 75<br />
Red River Delta 29 45 88<br />
North Central Coast 30 44 80<br />
South Central Coast 46 55 86<br />
Central Highl<strong>and</strong>s 78 78 88<br />
Southeast 77 79 95<br />
Mekong River Delta 74 74 91<br />
Total 54 59 87<br />
2002<br />
Northern Upl<strong>and</strong>s 34 52 71<br />
Red River Delta 34 61 83<br />
North Central Coast 38 63 82<br />
South Central Coast 53 73 91<br />
Central Highl<strong>and</strong>s 74 74 80<br />
Southeast 88 84 89<br />
Mekong River Delta 84 85 91<br />
Total 61 70 84<br />
Source: Analysis of the 1993 <strong>and</strong> 1998 VLSS <strong>and</strong> the 2002 VHLSS.<br />
percentages, the marketed share is smaller. For example, the marketed share of crop production in Vietnam in<br />
2002 would be 43 percent using this method of calculation, rather than 61 percent as reported in the table.<br />
Page 59