Host Marriott 2004 Annual Report - Host Hotels & Resorts, Inc
Host Marriott 2004 Annual Report - Host Hotels & Resorts, Inc
Host Marriott 2004 Annual Report - Host Hotels & Resorts, Inc

You also want an ePaper? Increase the reach of your titles
YUMPU automatically turns print PDFs into web optimized ePapers that Google loves.
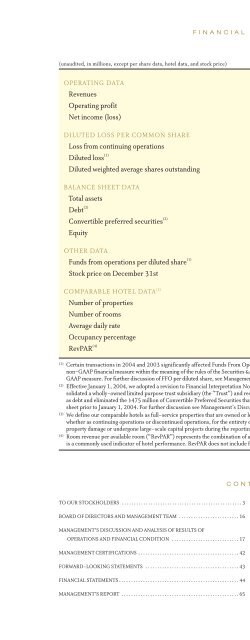
FINANCIAL HIGHLIGHTS<br />
(unaudited, in millions, except per share data, hotel data, and stock price) <strong>2004</strong> 2003 2002<br />
OPERATING DATA<br />
Revenues $ 3,640 $ 3,288 $ 3,345<br />
Operating profit 407 299 417<br />
Net income (loss) — 14 (16)<br />
DILUTED LOSS PER COMMON SHARE<br />
Loss from continuing operations $ (.31) $ (.97) $ (.39)<br />
Diluted loss (1) $ (.12) $ (.07) $ (.19)<br />
Diluted weighted average shares outstanding 337.3 281.0 263.0<br />
BALANCE SHEET DATA<br />
Total assets $ 8,421 $ 8,592 $ 8,316<br />
Debt (2) 5,523 5,486 5,638<br />
Convertible preferred securities (2) — 475 475<br />
Equity 2,395 2,136 1,610<br />
OTHER DATA<br />
Funds from operations per diluted share (1) $ .77 $ .99 $ 1.09<br />
Stock price on December 31st 17.30 12.32 8.85<br />
COMPARABLE HOTEL DATA (3)<br />
Number of properties 103 103<br />
Number of rooms 52,063 52,183<br />
Average daily rate $149.64 $145.42<br />
Occupancy percentage 71.9% 69.0%<br />
RevPAR (4) $107.66 $100.35<br />
(1)<br />
Certain transactions in <strong>2004</strong> and 2003 significantly affected Funds From Operations (FFO) per diluted share and loss per share. FFO per diluted share is a<br />
non-GAAP financial measure within the meaning of the rules of the Securities & Exchange Commission and, accordingly, has been reconciled to the comparable<br />
GAAP measure. For further discussion of FFO per diluted share, see Management’s Discussion and Analysis of Results of Operations and Financial Condition.<br />
(2)<br />
Effective January 1, <strong>2004</strong>, we adopted a revision to Financial Interpretation No. 46 “Consolidation of Variable Interest Entities” (FIN 46R). As a result, we deconsolidated<br />
a wholly-owned limited purpose trust subsidiary (the “Trust”) and recorded the $492 million Convertible Subordinated Debentures issued by the Trust<br />
as debt and eliminated the $475 million of Convertible Preferred Securities that were previously classified in the mezzanine section of our consolidated balance<br />
sheet prior to January 1, <strong>2004</strong>. For further discussion see Management’s Discussion and Analysis of Results of Operations and Financial Condition.<br />
(3)<br />
We define our comparable hotels as full-service properties that are owned or leased by us and the operations of which are included in our consolidated results,<br />
whether as continuing operations or discontinued operations, for the entirety of the reporting periods being compared, and that have not sustained substantial<br />
property damage or undergone large-scale capital projects during the reporting periods being compared.<br />
(4)<br />
Room revenue per available room (“RevPAR”) represents the combination of average daily room rate charged and the average daily occupancy achieved, and<br />
is a commonly used indicator of hotel performance. RevPAR does not include food and beverage or other ancillary revenues generated by the property.<br />
CONTENTS<br />
TO OUR STOCKHOLDERS . . . . . . . . . . . . . . . . . . . . . . . . . . . . . . . . . . . . . . . . . . . . . . . . . . 3<br />
BOARD OF DIRECTORS AND MANAGEMENT TEAM . . . . . . . . . . . . . . . . . . . . . . . . . 16<br />
MANAGEMENT’S DISCUSSION AND ANALYSIS OF RESULTS OF<br />
OPERATIONS AND FINANCIAL CONDITION . . . . . . . . . . . . . . . . . . . . . . . . . . . . 17<br />
MANAGEMENT CERTIFICATIONS . . . . . . . . . . . . . . . . . . . . . . . . . . . . . . . . . . . . . . . . . . 42<br />
FORWARD-LOOKING STATEMENTS . . . . . . . . . . . . . . . . . . . . . . . . . . . . . . . . . . . . . . . 43<br />
FINANCIAL STATEMENTS . . . . . . . . . . . . . . . . . . . . . . . . . . . . . . . . . . . . . . . . . . . . . . . . . . 44<br />
MANAGEMENT’S REPORT . . . . . . . . . . . . . . . . . . . . . . . . . . . . . . . . . . . . . . . . . . . . . . . . . 65<br />
MANAGEMENT’S REPORT ON INTERNAL CONTROL OVER<br />
FINANCIAL REPORTING . . . . . . . . . . . . . . . . . . . . . . . . . . . . . . . . . . . . . . . . . . . . . . . .65<br />
REPORTS OF INDEPENDENT REGISTERED PUBLIC ACCOUNTING<br />
FIRM ON INTERNAL CONTROL OVER FINANCIAL<br />
REPORTING AND MANAGEMENT’S ASSESSMENT<br />
AND ON THE CONSOLIDATED FINANCIAL STATEMENTS . . . . . . . . . . . . . . . . 66<br />
SELECTED FINANCIAL DATA . . . . . . . . . . . . . . . . . . . . . . . . . . . . . . . . . . . . . . . . . . . . . . . 67<br />
HOST MARRIOTT PORTFOLIO . . . . . . . . . . . . . . . . . . . . . . . . . . . . . . . . . . . . . . . . . . . . . 68<br />
DIRECTORS, OFFICERS AND MANAGEMENT TEAM . . . . . . INSIDE BACK COVER<br />
CORPORATE INFORMATION . . . . . . . . . . . . . . . . . . . . . . . . . . . . INSIDE BACK COVER